Article
J. Braz. Chem. Soc., Vol. 22, No. 5, 875-883, 2011. Printed in Brazil - ©2011 Sociedade Brasileira de Química
0103 - 5053 $6.00+0.00
A
*e-mail: [email protected]
Electrooxidation of Phenol on a Ti/RuO
2Anode: Effect of Some Electrolysis
Parameters
Iranildes D. dos Santos,a Júlio C. Afonso*,b and Achilles J. B. Dutraa
aPrograma de Engenharia Metalúrgica e de Materiais/Coordenação dos Programas de
Pós-Graduação em Engenharia (COPPE), Universidade Federal do Rio de Janeiro, 21941-909 Rio de Janeiro-RJ, Brazil
bDepartamento de Química Analítica, Instituto de Química, Universidade Federal do Rio de Janeiro,
21941-909 Rio de Janeiro-RJ, Brazil
Foram investigadas as inluências do tempo de eletrólise, da área anódica, da densidade de corrente e do tipo de eletrólito na degradação de fenol e de seus subprodutos de oxidação em
anodo de Ti/RuO2. Foi observado que na presença de cloreto ocorreu rápida degradação de fenol
e de seus subprodutos. Resultados de cromatograia gasosa/espectroscopia de massa (GC/MS)
mostraram que a presença de cloreto levou à formação inicial de clorofenóis através do Cl2 e/ou
OCl¯ gerados durante a eletrólise. Entretanto, eles posteriormente atuaram na degradação dos
clorofenóis. As concentrações limites estabelecidas pelo Órgão Ambiental Brasileiro (CONAMA) para descartes de fenol e clorofenóis foram obtidas após 360 min de eletrólise a uma densidade
de corrente ixa de 10 mA cm-2.Voltamogramas cíclicos obtidos antes e após 436 h de eletrólise
em condições severas de salinidade (2 mol L-1) e densidade de corrente (800 mA cm-2) mostraram
que o eletrodo de Ti/RuO2 não perdeu suas propriedades eletrocatalíticas.
The inluences of electrolysis time, anodic area, current density and supporting electrolyte
on phenol and its byproducts degradation on a Ti/RuO2 anode were investigated. It was observed
that phenol and its byproducts were rapidly broken down in the presence of chloride ions. Gas chromatography/mass spectrometry (GC/MS) data have shown that the presence of chloride ions lead to chlorophenols formation, due to reactions with Cl2 and/or OCl¯ generated during electrolysis.
However, these intermediate products were also degraded later by the oxidizing agents. The standards established by the CONAMA (Brazilian National Council for the Environment) for phenols and chlorophenols in efluents were achieved after 360 min of electrolysis with a current density of 10 mA cm-2. Cyclic voltammograms obtained with the anodes before and after 436 h of electrolysis
under severe salinity conditions (2 mol L-1) and current density (800 mA cm-2) showed that
Ti/RuO2 did not lose its electrocatalytic properties. This fact indicates that Ti/RuO2 can be used
for the treatment of efluents containing phenols in a chloride environment.
Keywords: electrooxidation, phenols, chlorophenols, supporting electrolyte
Introduction
Phenols are persistent organic compounds found in aqueous efluents from domestic activities such as cooking, washing and bathing, as well as petroleum reineries, steel plants, dyeing manufacturing, pharmaceutical and plastic industries.1-4 They are refractory to conventional treatment
process and, in the presence of chlorine, they may produce chlorophenols, which are carcinogenic and even more refractory to degradation than the phenols themselves.4-6
There are several available processes to treat efluents containing phenols, such as biological treatment, advanced oxidation processes, oxidation in supercritical water and electrochemical oxidation.6-8 Furthermore, some of those
processes, for instance photocatalytic oxidation process, presents high operational costs and operational issues due to catalyst deactivation.9 The electrolytic process has shown
to be an eficient low cost, an alternative to the treatment of several aqueous efluents containing organic and inorganic pollutants.3,4,6,10-15 In this process, different electrode
Some authors16-18 reported that the “active” electrodes
such as Ti/RuO2 and Ti/IrO2 are not very effective for phenols degradation. In these electrodes, there is a strong interaction between the hydroxyl radical (OH•)and the
surface of the electrode (M). This interaction may lead to the possible transition of the oxygen from OH•at the
electrode surface forming an oxide with higher oxidation state (reaction 1). This condition is found in electrodes with low oxygen overpotential 1.23 V vs. SHE (standard
hydrogen electrode).18 The redox pair MO/M can promote
a selective oxidation of organic compounds (reaction 2). In such electrodes, there is a competition with the oxygen generation during the oxidation of organic compounds due to chemical decomposition of the oxide with higher oxidation state (reaction 3).
M(OH•) → MO + H+ + e– (reaction 1)
MO + R → M + RO (reaction 2)
MO → M + ½ O
2 (reaction 3)
For “non-active” electrodes Ti/PbO2, BDD and
Ti/SnO2-Sb, there is a weak interaction between OH• and
the electrode surface. The oxidation of organic compounds occurs via OH• radical (reaction 4) leading to their
complete removal as CO2 and H2O. Reaction 3 occurs
simultaneously to the oxygen generation (reaction 5). In these circumstances, the electrode surface does not play a role in the oxidation of organic compounds.18-20 This
oxidation mechanism takes place on electrodes with high oxygen overpotential.
M(OH•) + R → M + mCO
2 + nH2O + H+ + e– (reaction 4)
M(OH•) → M + ½ O
2 + H+ + e– (reaction 5)
Li et al.16 used Ti/SnO
2-Sb, Ti/RuO2 and Pt anodes for
the electrochemical degradation of phenol in sulfate media. Phenol was degraded on the three anodes; however there is a substantial difference on their degradation eficiency. The complete phenol oxidation took 36, 18 and 5 h with the Ti/RuO2, Pt and Ti/SnO2-Sb, respectively. Although
the Ti/RuO2 anode presented the lower phenol oxidation eficiency in sulfate media, it is recognized as a very stable material for chlorine evolution.21 In sulfate medium, the
phenol oxidation takes place only on the anode surface (direct mechanism), because there is no relevant generation of oxidizing species during electrolysis. On the other hand, phenol degradation in the presence of chloride can occur through both mechanisms: direct and indirect. The
indirect oxidation is due to the presence of hypochlorite/ chlorine species in solution formed by the oxidation of chloride ions on the anode surface.22,23 Hypochlorite ion
predominates in alkaline media. While chlorine is more stable in acidic environment since the ionization constant of hypochlorous acid is 2.95 × 10⁻⁸ (pK
a = 7.53). However,
the indirect electrochemical oxidation presents some drawbacks, for instance the possible formation of persistent organochloride compounds2,24,25 and the low resistance of
electrode materials in this medium.
The objective of this paper was to investigate the electrochemical conditions for complete removal of phenol and its byproducts using a Ti/RuO2 anode, aiming at a future
application for efluents treatment. The choice of Ti/RuO2 anode was due to its wide use in industrial processes, such as chlor-alkali industry and efluent treatment. This anode low overpotential for oxygen and chlorine evolution, good conductivity, thermal stability in a wide temperature range and is fairly resistant to corrosion.5,26
Experimental
Voltammetric tests were carried out with an EG&G PAR model 273A potentiostat/galvanostat connected to a microcomputer with the M270 software. The cell was a 250 mL glass beaker with an acrylic cover. The working electrode was a RuO2 layered titanium plate,
provided by De Nora/Brazil; titanium plates were used as counter electrodes and a silver-silver chloride electrode in a 1 mol L-1 KCl solution, the reference (Eo = 0.222 V).
Unless otherwise stated, all the tests were conducted at 25 oC without stirring.
The batch electrolysis tests were conducted in the same cell used in the voltammetry, but under constant moderate stirring. The anodic area ranged from 14 to 27 cm2. For
the long duration tests the anodic potential was monitored throughout the experiment.
Some tests were conducted in a 160 mL plug low reactor (low-by cell), which is presented, along with its accessories, in Figure 1. For these tests, 400 mL of a 0.34 mol L-1 NaCl solution containing 100 mg L-1 of phenol
were used. The anode area was 107 cm2, the solution
low rate 0.23 mL s-1 and the current density was ixed at
10 mA cm2.
The solution pH was adjusted with 0.1 mol L-1 HCl
or NaOH solutions whenever necessary and measured with a pH meter. Bi-distilled water was used for solution preparation and all the reagents were analytically grade, without further puriication. For all the experiments the initial NaCl and phenol concentrations ranged respectively from 0.01 to 0.34 mol L-1 and 30 to 100 mg L-1, respectively.
When used as supporting electrolyte, Na2SO4 concentration
was 0.34 mol L-1.
The concentrations of phenol and its intermediate degradation products were monitored with an UV-Vis spectrophotometer, according to procedure described by Amlathe et al.27 Gas chromatography coupled to mass
spectrometry (GC/MS) was used to identify and quantify the electrolysis products concentration at the end of the experiments. The organic compounds present in solution were extracted with dichloromethane at pH 2 (adjusted with H2SO4) and analyzed with the GC/MS according
to USEPA 8270D method. The COD (chemical oxygen demand) determination was carried out using oxidation with potassium dichromate in sulfuric acid and heating for 2 h at 150 °C according to Hanna method using a spectrophotometer model HI 83099.
The current eficiencies for phenol and chlorophenol oxidations were based on the COD measurements, according to equation 1:1,2,11,28
(1)
where, (COD)t and (COD)t+∆t are the COD (mg O2 L
-1) at
time t and t + ∆t (s), respectively. I is the current (A), F the
Faraday constant (96487 C mol-1), V the solution volume
(L) and 8 is the gram equivalent of oxygen.
The energy consumption (EC) for the removal of 103 g
of COD was determined through equation 2:14,29
(2)
where, t is the electrolysis time (h), U is the cell applied potential (V), I is the current (A), V the solution volume (L) and ∆COD the COD difference (mg L-1).
The microstructure of the electrode surface was analyzed by scanning electron microscopy (SEM), the equipment is a 6460 model JEOL Electron Microscope coupled to an energy dispersive X-ray spectrometer (EDS).
Results and Discussion
Voltammetry
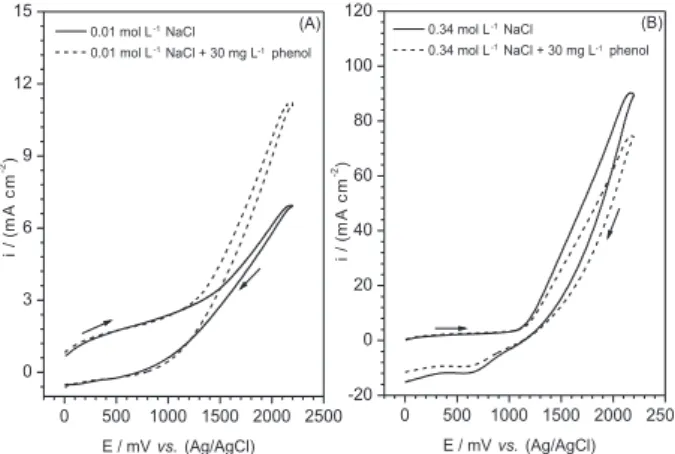
The voltammetric behavior of the Ti/RuO2 electrode in
solutions with different NaCl concentrations in the absence and presence of 30 mg L-1 of phenol is presented in Figure 2.
It can be observed that the voltammogram shapes depend on the NaCl concentration. In Figure 2A, an increase on the current density in the potential range of 1250 and 2200 mV (0.01 mol L-1) was observed for low NaCl concentrations
indicating phenol oxidation. Conversely, a decrease on current density in the same potential range was observed for high NaCl concentrations (0.34 mol L-1). This behavior
can be attributed to chlorophenols formed via reaction of organic intermediate products with the hypochlorite ions generated on the anode. The chlorophenols tend to adsorb on the anode surface blocking it and partially cause a decrease on the current density. For the lower NaCl concentration, the low chlorophenols formation rate did not favor the buildup of adsorbed products, which block the anode surface.6,30-32
Several researchers5,12,24,25,33-36 observed that the
decrease of the electrode eficiency due to organic matter adsorption depends on the electrolysis conditions, such as phenol concentration, supporting electrolyte type, electrode material, electrode potential and time. According to Zareie etal.,30 although high NaCl concentrations favor
the formation of adsorbed intermediate products on the anode surface, the hypochlorite and chlorine ions act on the destruction of this blocking layer under longer times. This avoids the buildup of these compounds on the anode surface with the consequent electrode deactivation and decrease of the oxidation eficiency. Evidences of the
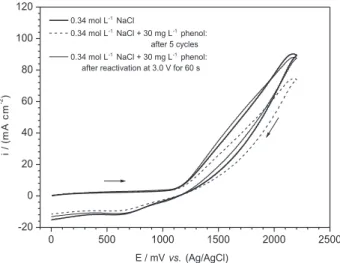
destruction of the adsorbed blocking layer are presented on the voltammograms in Figure 3, which indicate a current density decrease due to the formation of a blocking layer after five cycles. After a reactivating treatment at 3.0 V during 60 s, the anode surface recovered its initial properties. This statement was achieved since the voltammogram obtained after reactivation is very similar to the one in the presence of NaCl only. The recovery of the catalytic properties of the electrode is due to the oxidation of the organic matter (blocking layer on the anode surface) by the oxidizing agents generated during NaCl solution electrolysis (Cl2 and/or OCl–). The anodic generation of
gases, as oxygen, can help the mechanical removal of the layer from the electrode surface.1,34,35
Batch cell electrolysis
The inluences of anodic area and electrolysis time for batch tests in a 190 mL cell on phenol removal are presented in Figure 4. In Figure 4A, phenol removal continuously increased with the anodic area increase until 27 cm2. Higher
anodic areas did not signiicantly increase phenol removal. Larger anodic areas are more dificult to be completely covered by intermediate blocking layers and also tend to increase the hypochlorite generation rate (for a ixed current density) acting on the indirect phenol oxidation.2,37 In this
case, the direct oxidation mechanism for phenol seems to be less important for this electrode type.16 The effect of
the electrolysis time on phenol removal for two different anodic areas is presented in Figure 4B. The larger area is responsible for the fastest phenol degradation. In the beginning of the test with the anodic area of 27 cm2, the
phenol removal rate was very slow, probably due to the
formation of organochloride compounds that block the electrode surface. For the larger anodic area, this effect becomes less important. After 15 min of electrolysis, 85% of the phenol was degraded for a 107 cm2 anodic area, while
only 5% was degraded with an anodic area of 27 cm2. For
periods of time longer than 30 min, the effect of area was less relevant. This behavior indicates in the second half of the electrolysis phenol is mostly oxidized by the indirect mechanism, i.e. through the action of hypochlorite, since
the inal phenol concentrations are low and basically the same for both anodic areas.
The inluences of current density and electrolysis time on the phenol removal are presented in Figure 5. It can be observed in Figure 5A that in the irst 10 min of electrolysis only a low phenol removal was attained, probably due to the formation of organic intermediate compounds adsorbed on the electrode surface. From 10 to 20 min, as the hypochlorite concentration increased due to the electrolysis, the phenol removal rate increased substantially. Then, with most of the phenol already oxidized, its removal rate decreased because phenol concentration was lower and
Figure 3. Cyclic voltammograms on a Ti/RuO2 anode of a 0.34 mol L-1 NaCl in the absence and presence of 30 mg L-1 phenol after ive cycles and anodic reactivation at 3.0 V for 60 s. Anodic area: 4.5 cm2, temperature: 25 oC and ν = 100 mV s-1.
Figure 4. The inluences of the (A) anodic area and (B) electrolysis time using anodic areas of 27 and 107 cm2 on the phenol removal. Solution: 100 mg L-1 phenol, 0.34 mol L-1 NaCl, i: 10 mA cm-2, temperature: 25 oC.
the effect of the hypochlorite excess, used in the indirect oxidation mechanism, less noticeable. The phenol removals after 15 min of electrolysis with current densities of 20 and 40 mA cm-2 were 70 and 80%, respectively. For a current
density of 10 mA cm-2 with an anodic area of 107 cm2
(Figure 5B), a 99.99% phenol removal was achieved after 15 min. This indicates that for a given current density the anodic area seems to be an important parameter for the phenol oxidation, since it provides a higher rate for the generation of oxidizing agents (mainly hypochlorite) in solution favoring the direct oxidation, and being more dificult to be blocked due to its larger area.
Flow-by cell electrolysis
The inluences of supporting electrolytes (NaCl or Na2SO4) on the phenol removal as a function of electrolysis
time with the low-by electrolytic cell are presented in Figure 6. Phenol concentration was much lower in the presence of NaCl than in the presence of Na2SO4. For a Na2SO4 supporting electrolyte, around 30% of the phenol
was oxidized to intermediate products after 5 min of electrolysis. It has been reported16,17 that the intermediate
products of phenol oxidation in sulfate media are benzoquinone and maleic acid, which tend to degrade to CO2 and H2O. By the other side, under similar experimental conditions (except for a sodium chloride environment) more than 99% of the phenol was oxidized after 5 min of electrolysis. The intermediate products of phenol oxidation in chloride media are basically chlorophenols.22,37-39 It
can be also observed in Figure 6 that the solution still presented a high phenol concentration after 360 min of electrolysis in the presence of sulfate, i.e. around 6 mg L-1.
While it was necessary only 30 min to achieve almost total
phenol degradation in the presence of NaCl as supporting electrolyte. This behavior can be attributed to the presence of chloride ions in solution which are oxidized to OCl– and
Cl2 depending on the pH and act in the indirect oxidation of phenol as oxidizing agents.22,37,39
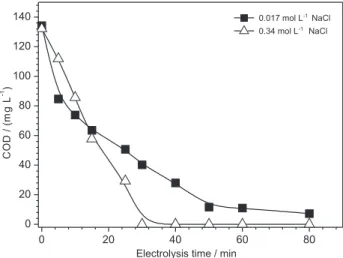
The inluence of electrolysis time on the COD removal for different NaCl concentrations is presented in Figure 7. It can be observed that in both cases COD dropped with time. However, an almost complete COD removal for the higher NaCl concentration (0.34 mol L-1) was attained after
30 min. While the drop for the lower concentration was considerably smoother, reaching 90% only after 60 min of electrolysis. The faster COD removal obtained for the higher NaCl concentration can be attributed to the larger oxidizing agent (OCl¯) generation rate during electrolysis.11,22,40,41 This
feature can be an advantage for chlorophenols degradation, despite the inevitable chlorophenols formation during the electrolysis in the presence of chloride ions since they are also destroyed under longer electrolysis times.22,24,28,30,42,43
This behavior is evidenced in Figure 8, which presents the chlorophenols concentration drop with both NaCl concentration (Figure 8A) and time (Figure 8B). Starting with an initial concentration of 100 mg L-1 phenol in
0.34 mol L-1 NaCl solution, almost all phenol (98.6%)
was converted to chlorophenols after 5 min (Figure 8B). However, after 30 min the chlorophenols concentration was close to zero corresponding to a 99.99% removal. The residual chlorophenols concentrations were higher for lower NaCl concentrations and the same electrolysis time (30 min), as expected. The rapid formation of chlorophenols is an indication that the current density drop observed previously in Figure 2B can be attributed to the adsorption of chlorophenols on the electrode surface.
Figure 6. Inluences of chloride and sulfate on the phenol removal. Solution: 100 mg L-1 phenol, anode: Ti/RuO
2, anodic area: 107 cm2, temperature: 25 oC, i = 10 mA cm-2, V = 400 mL, low rate: 0.23 mL s-1.
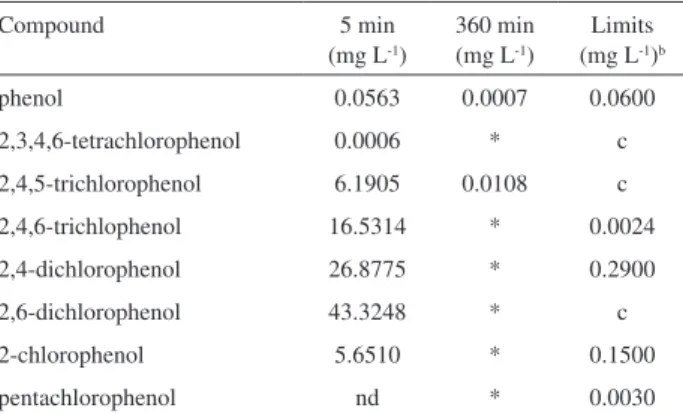
The organic compounds concentration detected after 5 and 360 min of electrolysis, along with their respective limits established by the National Brazilian Environmental Council (CONAMA)44 for Class 1 saltwater are presented
in Table 1. It can be observed that most of the phenol was converted to different chlorophenols in the irst 5 min, being almost totally destroyed at the end of the electrolysis (360 min). The absence of other oxidation by-products except for the chlorophenols indicates the conversion of phenols to CO2 and water. This happened besides eventually low molecular weight intermediate aliphatic compounds, such as carboxylic acids, which were not quantiied due to their low hazardousness potential.
The inluences of electrolysis time on the speciic energy consumption and current eficiency for COD (which can be associated to the presence of phenol and other organic
compounds) removal in a 0.34 mol L-1 NaCl solution
with 100 mg L-1 phenol are shown in Figures 9A and 9B,
respectively. In Figure 9A, the energy consumption presents an increasing trend, which is interrupted between 10 and 40 min, probably due the predominance of the indirect oxidation mechanism, i.e. through the action of OCl–, in this
time interval. After this period, the cell current produced more OCl– that is not used in the oxidation anymore, due
to the low organic concentration in solution leading to an increase in the energy consumption. An analogous, but opposite behavior is observed for current eficiency, as presented in Figure 9B. An elevated current eficiency in the beginning of the electrolysis was achieved due to the oxidation of phenol and its by-products.11,17 After 20 min
the eficiency dropped continuously due to the decrease of the total organic compounds concentration in solution, since they were almost completely removed after 30 min, as shown previously in Figure 8B. Another possible cause for the low current eficiency and high energy consumption throughout the electrolysis is the oxygen evolution reaction which occurs along with OCl– generation. The generated
oxygen does not play a signiicant role on the phenols oxidation, as shown previously in Figure 6.
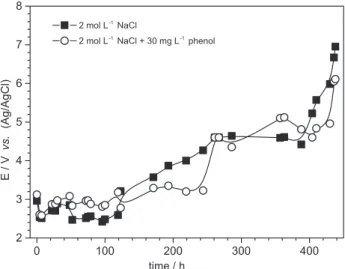
The durability of the anodes is an important parameter for the application of an electrolytic process, especially in corrosive environments like concentrated chloride solutions. The results of accelerated life tests for the Ti/RuO2 anode as function of time under high salinity
(2 mol L-1 NaCl) and current density (800 mA cm-2) in the
absence and presence of 30 mg L-1 phenol are presented
in Figure 10. It can be observed only a small change in the behavior of the electrodes in the media studied. The anode potential in the beginning of the test was around 3.0 V in both cases; however, a dramatic increase on the electrode
Figure 8. The inluences of (A) chloride concentration and (B) electrolysis time on the chlorophenols degradation. Solution: 100 mg L-1 phenol, anodic area: 107 cm2, temperature: 25 oC, i = 10 mA cm-2, V = 400 mL, low rate: 0.23 mL s-1.
Table 1. Organic compounds identiied by GC/MS after 5 and 360 min of electrolysis and the respective limits established by CONAMAa for class 1 saltwater. Solution: 100 mg L-1 phenol and 0.34 mol L-1 NaCl; anodic area: 107 cm2; temperature: 25 °C; i = 10 mA cm-2; V = 400 mL; low rate: 0.23 mL s-1
Compound 5 min
(mg L-1)
360 min (mg L-1)
Limits (mg L-1)b
phenol 0.0563 0.0007 0.0600
2,3,4,6-tetrachlorophenol 0.0006 * c
2,4,5-trichlorophenol 6.1905 0.0108 c 2,4,6-trichlophenol 16.5314 * 0.0024 2,4-dichlorophenol 26.8775 * 0.2900
2,6-dichlorophenol 43.3248 * c
2-chlorophenol 5.6510 * 0.1500
pentachlorophenol nd * 0.0030
*Below detection limit; nd: not detected; aNational Brazilian Environmental Council (CONAMA);43bLimit for class 1 saltwater; c: Limit not established by CONAMA for class 1 saltwater.
potential (6 and 7 V after ca. 430 h of electrolysis in the
presence and absence of phenol, respectively) in the end of the test was observed indicating the starting of a corrosion process, especially in the absence of phenol.
SEM micrographs and EDS spectra of the Ti/RuO2
anodes before and after accelerated degradation testing under the conditions mentioned in Figure 10 are presented in Figure 11. The morphology of the electrode before the test is shown in Figure 11A. In Figure 11B, a moderate exfoliation was observed in the absence of phenol. However the detail in Figure 11B suggests that other RuO2 layers
on the titanium electrode practically remain intact. The exfoliation was probably due to the higher gas (chlorine and oxygen) generation on the anode surface,26,45 according
to the voltammogram presented in Figure 1. Another possibility should be the corrosion of RuO2 in the presence of hypochlorite in alkaline environment.45 Furthermore, it
Figure 10. Accelerated life tests of Ti/RuO2 anode in the absence (anodic area: 3.9 cm2) and presence (anodic area: 3.3 cm2) of phenol. Conditions: NaCl: 2 mol L-1, phenol: 30 mg L-1, i = 800 mA cm-2, temperature: 25 oC.
should be considered that some phenolic compounds act as corrosion inhibitors extending the anode life according to Figure 11C.46
The voltammetric performance of the Ti/RuO2 anode (5.6 cm2) for an electrolysis of a 0.34 mol L-1 NaCl solution
with 30 mg L-1 of phenol, before and after the accelerated
life test, in presence of phenol, is shown in Figure 12. A similar performance for the phenol degradation was observed, indicating that the anode did not lose its electrocatalytic properties, despite its previous use during 436 h under severe salinity and current density conditions. This suggests that this material presents good performance and resistance to oxidation of organic matter in chloride medium.
Conclusions
Results indicated that the Ti/RuO2 can be used for
the oxidation of phenol and chlorophenols. After 30 min of electrolysis in the presence of 0.34 mol L-1 NaCl and
100 mg L-1 phenol, 99.99% of the latter was removed from
the solution. Otherwise, when chloride was substituted by sulfate, only 15% of the COD was removed under the same experimental conditions. The presence of chlorine and/or hypochlorite in solution lead to the formation of chlorophenols, but also acted in their subsequent degradation through an indirect mechanism.
The standard limit established by the National Brazilian Environmental Council for phenol releasing in the environment was achieved after 30 min of electrolysis of a solution containing 0.34 mol L-1 NaCl and 100 mg L-1
phenol with a current density of 10 mA cm-2. After 360 min,
under the same conditions most of the chlorophenols were destroyed.
Figure 12. Cyclic voltammograms on a Ti/RuO2 anode before and after accelerated life tests. Solution: 30 mg L-1 phenol and 0.34 mol L-1 NaCl; anodic area: 1.0 cm2, ν = 100 mV s-1, temperature: 25 oC.
Voltammetric tests indicated that the anode did not lose its electrocatalytic properties, despite its previous use during 436 h under severe salinity and current density conditions.
Acknowledgements
The authors are grateful to Conselho Nacional de Desenvolvimento Cientíico e Tecnológico (CNPq) and Fundação de Amparo à Pesquisa do Estado do Rio de Janeiro (FAPERJ) for the inancial support.
References
1. Iniesta, J.; Gonzalez-Garcia, J.; Expósito, E.; Montiel, V.; Aldaz, A.; Water Res. 2001, 35, 3291.
2. Li, M.; Feng, C.; Hu, W.; Zhang, Z.; Sugiura, N.; J. Hazard. Mater. 2009, 162, 455.
3. Yang, X.; Zou, R.; Huo, F.; Cai, D.; Xiao, D.; J. Hazard. Mater.
2009, 164, 367.
4. Awad, Y. M.; Abuzaid, N. S.; Sep. Purif. Technol. 2000, 18, 227. 5. Yavuz, Y.; Koparal, A. S.; J. Hazard. Mater. 2006, 136, 296.
6. Coteiro, R. D.; De Andrade, A. R.; J. Appl. Electrochem. 2007,
37, 691.
7. Montilla, F.; Michaud, P. A.; Morallón, E.; Vázquez, J. L.;
Electrochim. Acta 2002, 47, 3509.
8. Ma, H.; Zhang, X.; Ma, Q.; Wang, B.; J. Hazard. Mater. 2009,
165, 475.
9. Laine, D. F.; Cheng, I. F.; Microchem. J. 2007, 85, 183. 10. Borras, C.; Berzoy, C.; Mostany, J.; Herrera, J. C.; Scharifker,
B. R; Appl. Catal. B-Environm. 2007, 72, 98.
11. Comninellis, C.; Pulgarin, C.; J.Appl. Electrochem. 1993, 23,
108.
12. Panizza, M.; Bocca, C.; Cerisola, G.; Water Res. 2000, 34, 2601.
13. Malpass, G. R. P.; Miwa, D. W.; Machado, S. A. S.; Olivi, P.; Motheo, A. J.; J. Hazard. Mater. 2006, 137, 565.
14. Abdelwahad O.; Amin, N. K.; El-ashtoukhy, E. S. Z.; J. Hazard. Mater. 2009, 163, 711.
15. Bejankiwar, R.; Lalman, J. A.; Seth, R.; Biswas, N.; Water Res.
2005, 39, 4715.
16. Li, X.; Cui, Y.; Feng, Y.; Xie, Z. M.; Gu, J. D.; Water Res. 2005,
39, 1972.
17. Feng, Y.; Li, X.; Water Res. 2003, 37, 2399.
18. Fierro, S.; Ouattara, L.; Calderon, E. H.; Passas-Lagos, E.;
Electrochim. Acta 2009, 54, 2053.
19. Comninellis, C.; In Environmental Oriented Electrochemistry;
Sequeira, C. A. C., ed., Elsevier: Amsterdam, 1994, pp. 77. 20. Fóti, G.; Gandini, D.; Comninellis, C.; Perret, A.; Haenni, W.;
Electrochem. Solid St. 1999, 2, 228.
22. Chen, G.; Sep. Purif. Technol. 2004, 38, 11.
23. Lin, S. H.; Shyu, C. T.; Sun, M. C.; Water Res. 1998, 32, 1059.
24. Korbahti, B. K.; Tonyolac, A.; Water Res. 2003, 37, 1505. 25. Korbahti, B. K.; Tanyolac, A.; Chem. Eng. J. 2009, 148, 444.
26. Pourbaix, M.; Atlas of Electrochemical Equilibrium in Aqueous Solutions, 2nd ed., Pergamon: New York, 1966.
27. Amlathe, S.; Upadhyay, S.; Gupta, V. K.; Analyst 1987, 112, 1463.
28. Polcaro, A. M.; Palmas, S.; Renoldi, F.; Mascia, M.; J. Appl. Electrochem. 1999, 29, 147.
29. Andrade, L. S.; Rocha-Filho, R. C.; Bocchi, N.; J. Hazard. Mater. 2008, 153, 252.
30. Zareie, M. H.; Korbahti, B. K.; Tanyolac, A.; J. Hazard. Mater.
2001, 87, 199.
31. Rodgers, J. D.; Jedral, W.; Bunce, N. J.; Environ. Sci. Technol.
1999, 33, 1453.
32. Ferreira, M.; Varela, H.; Torresi, R. M.; Tremiliosi-Filho, G.;
Electrochim. Acta 2006, 52. 434.
33. Pletcher, D.; Wash, F. C.; Industrial Electrochemistry, 2nd ed.,
Chapman and Hall: London, 1982.
34. Tahar, N. B.; Abdelhédi, R.; Savall, A.; J. Appl. Electrochem.
2009, 39, 663.
35. Gattrell, M.; Kirk, D. W.; J. Electrochem. Soc. 1993, 140, 903. 36. Al-Maznai, H.; Conway, B. E.; J. Serbian Chem. Soc. 2001,
66, 765.
37. Aquino Neto, S.; De Andrade, A. R.; Electrochim. Acta 2009,
54, 2039.
38. Chatzisymeon, E.; Dimou, A.; Mantzavinos, D.; Katsaounis, A.; J. Hazard. Mater. 2009, 167, 268.
39. Costa, C. R.; Olivi, P.; Electrochim. Acta 2009, 54, 2046. 40. Rao, N. N.; Rohit, M.; Nitin, G.; Paramesivaran, P. N.; Astik,
J. K.; Chemosphere 2009, 76, 1206.
41. Yoshihara, S.; Murugananthan, M.; Electrochim. Acta 2009, 54, 2031.
42. Busca, G.; Berardinelli, S.; Resini, C.; Arrighi, L.; J. Hazard. Mater. 2008, 160, 265.
43. Patel, U. D.; Suresh, S.; Sep. Purif. Technol. 2008, 61, 115.
44. Directory 357 from the National Brazilian Environmental Council, Federal Oficial Journal, available: www.mma.gov. br/port/conama/legiabre.cfm?codlege=459 accessed on March 18, 2005 and in August 2010.
45. Gemelli, E.; Corrosão de Materiais Metálicos e sua Caracterização, 1a. ed.; LTC: Rio de Janeiro, Brasil, 2001.
46. Aksüt, A. A.; Önal, A. N.; Corros. Sci. 1997, 39, 761.
Submitted: October 11, 2010