Article
Printed in Brazil - ©2012 Sociedade Brasileira de Química0103 - 5053 $6.00+0.00
A
*e-mail: [email protected]
Chemometric Tools in Chemical Fractionation Data of Soil Samples from
Five Antarctic Research Stations
Marcelo B. B. Guerra,a Paula F. Rosa,a Carlos E. G. R. Schaefer,b,c
Roberto F. M. Michel,b,c,d Ivan C. Almeidab,c and Edenir R. Pereira-Filho*,a
aGrupo de Análise Instrumental Aplicada, Departamento de Química, Universidade Federal de São Carlos,
Rod. Washington Luiz, km 235, CP 676, 13565-905 São Carlos-SP, Brazil
bScott Polar Research Institute (SPRI), University of Cambridge, Lensfield Road CB2 IER,
Cambridge, United Kingdom
cDepartamento de Ciências do Solo, Universidade Federal de Viçosa,
Av. Peter Henry Rolfs, s/n, 36570-000 Viçosa-MG, Brazil
dFundação Estadual do Meio Ambiente (FEAM), Prédio Minas, Cidade Administrativa do
Estado de Minas Gerais, 31630-900 Belo Horizonte-MG, Brazil
Este estudo foi centrado na avaliação química de amostras de solos provenientes de diversas estações de pesquisa na Antártica. Amostras de solos de referência foram coletadas em locais com mínimo impacto antrópico, distantes das estações de pesquisa. Locais selecionados nas vizinhanças das estações Frei Montalva e Escudero (Chile), Grande Muralha (China), Bellingshausen (Rússia) e Artigas (Uruguai) foram os pontos a priori supostamente antropizados deste estudo. O procedimento
de extração sequencial (SEP) baseado no protocolo proposto pelo BCR (Community Bureau of Reference) foi aplicado para a determinação de Cu, Mn e Zn. Com o auxílio dos métodos PCA (análise de componentes principais) e PARAFAC (análise de fatores paralelos) foram extraídas informações significativas a partir dos dados brutos obtidos com SEP. As amostras de solos afetadas pelas estações de pesquisa estão associadas com elevadas concentrações de metais pesados (especialmente Cu e Zn, dentre os elementos investigados, nas frações mais lábeis de SEP aplicado). Este indício de contaminação está relacionado com o uso de óleo diesel para geração de energia pelas estações antárticas.
The aim of this study was to carry out a broad chemical investigation of selected soil samples from Antarctica, near different Antarctic scientific stations. Soil samples collected in background reference sites, with minimal human impact, far away from the stations were used as control samples. Anthropogenic places at the vicinity of the following stations Frei Montalva and Escudero (Chile), Great Wall (China), Bellingshausen (Russia) and Artigas (Uruguay) were studied as a priori
human impacted sites. The sequential extraction procedure (SEP) based on the BCR (Community Bureau of Reference) protocol was applied for Cu, Mn and Zn determination. With the help of PCA (principal component analysis) and PARAFAC (parallel factor analysis) methods, meaningful information was extracted from the raw data obtained from SEP procedure. Soil samples affected by the scientific stations are associated with higher heavy metal contents (especially Cu and Zn, between the investigated metals, in the most labile fractions of the SEP applied). This pollution signal is associated with diesel use for the energy generation by the Antarctic stations.
Keywords: Antarctica, heavy metals, PCA, PARAFAC, sequential extraction procedure
Introduction
The first Antarctic exploring expeditions in the
18th century were the initial landmarks of the human
presence in that continent, recognized before as the unique untouched region in the world. Environmental impacts derived from hunting of whales, penguins, seals and other animals led to great disturbance in the Antarctic continent.1 At the beginning of the 20th century, the
Antarctica.2 The cumulative impacts caused by massive
hunting as well as those related to construction and operation of research stations attracted attention for anthropogenic pollution in the Antarctic region.1
After the enactment of the Protocol on Environmental Protection to the Antarctica (Madrid Protocol), valid from 1998, restrictive rules were imposed to the signatory countries prohibiting any natural resource exploitation, hence contributing to the Antarctic ecosystem preservation.3
Assessment of anthropogenic impacts on the Antarctic territory is an important requirement of the Madrid Protocol.3 Nowadays, with more than 50 stations installed
in Antarctica,2 the attempts aiming at human impact
assessment are of great relevance. Several studies have revealed elevated total toxic element (commonly named heavy metals) concentrations in environmental matrices from sites affected by Antarctic scientific stations. The most studied environmental matrices in Antarctica are lichens,4-6
mosses,7-9 sediments,10-12 soils13-15 and many other different
samples.16,17 Nevertheless, there are few studies dealing
with metal speciation or fractionation in soil and sediment samples from Antarctica.18-20 In this context, soil analyses by
sequential extraction procedures (SEPs) appeared as a good way to provide information about how strong potentially
toxic metals are bounded in that soil matrix.21 These
analytical procedures enable to infer about key features in the soil equilibrium such as mobility and bioavailability of metallic elements. In SEPs, the strength and reactivity of reagents typically increase along the stages, so the first ones are less aggressive (water, acetic acid, neutral salts, etc.). Thus, metals extracted in these preliminary fractions are weakly bounded on the matrix, which means potential environmental hazardous by their higher mobility. A peculiar characteristic of SEPs is the great amount of data generated by them. In this case, there are some statistical
strategies for data interpretation in a consistent way, being good options the use of chemometric tools such as PCA (principal component analysis) and/or PARAFAC (parallel factor analysis).22-25
The aim of this study was the use of PCA and PARAFAC methods for data treatment derived from Cu, Mn and Zn determination in soil samples in the fractions of a sequential extraction procedure. Soil samples were collected in places under strong anthropogenic impact, near five Antarctic research stations. The regions comprise intensively impacted sites located at the Fildes Peninsula, Maritime Antarctica, around five research stations: Chileans (Escudero and Eduardo Frei Montalva), Chinese (Great Wall), Russian (Bellingshausen) and Uruguayan (Artigas). From our knowledge, this is the first attempt to report results about chemical data interpretation from soil fractionation with chemometric tools related to soil samples from areas under anthropogenic impact in Antarctica.
Experimental
Soil sampling and preliminary treatments
Soil samples (0-10 cm depth for sites around the stations and 20-30 cm depth for sites far away from the stations) were collected using stainless steel apparatus. After sampling a representative amount of material (around 2 kg), the collected sample was stored in a clean plastic bag. Twenty five soil samples were collected, being twenty around the scientific stations and five far from those. All samples were kept under refrigeration prior to laboratory treatment. Table 1 and Figure S1 (in the Supplementary Information (SI) section) show a detailed description of the sampling sites collected around the scientific stations.
Table 1. Detailed description of the sampling sites around the scientific stations
Sampling pointsa Scientific station/country Observations
GRW 1 - GRW 4 Great Wall/China all sampling points were affected by the station diesel tanks
ESC 1 Escudero and immediately bellow the station diesel tanks
ESC 2 and ESC 3 Frei Montalva/Chile about 25 m far from the station diesel tanks
ESC 4 near the waste burning site
ESC 5 near the station entrance
BEL 1 Bellingshausen/Russia near the station storage shed
BEL 2 in the middle of the station building area
BEL 3 - BEL 5 affected by the station diesel tanks
ART 1 Artigas/Uruguay slightly affected by the station
ART 2 - ART 5 affected by the station diesel tanks
ART 6 in the middle of the station building area
Reagents and solutions
Reagents of analytical grade quality were used for solution preparation. Sub-boiling distilled acids (HCl and
HNO3) were prepared in a quartz distiller apparatus
(Marconi, Piracicaba-SP, Brazil). These purified acids were used for aqua regia extraction solution preparation. Glassware and flasks used in this study were cleaned with soap, thoroughly rinsed with distilled water and immersed in HNO3 (10% v v-1) overnight. After that, all material was
carefully rinsed with deionized water and left to dry in a laminar fume hood to avoid dust accumulation. Analytical calibration curves for Cu, Mn and Zn were prepared after successive dilutions of the standard stock solutions
(1000 mg L-1). For all elements, the linear calibration
range was from 0.10 to 1.00 mg L-1 comprehending
6 multielemental standards.
Aqua regia extraction for Cu, Mn and Zn pseudototal determination
Aqua regia extraction was performed for Cu, Mn and Zn determination in the soil samples following the German
norm DIN 38414-S7.26 Dried soil samples (0.3000 g, in
triplicate) were weighed and transferred to digestor block tubes. In each tube, 3 mL of aqua regia were added. A pre-digestion step was conducted leaving the mixture in a fume hood at room temperature overnight. The extraction was done during 3 h at 120 ºC under reflux. After reaching the room temperature, the extracts were transferred to decontaminated tubes and the solutions were made up to 10 mL using deionized water.
Application of the modified BCR sequential extraction procedure
Modified BCR (Community Bureau of Reference) sequential extraction procedure was applied for Cu, Mn and Zn determination in all collected soil samples. This SEP procedure was done following Ščančar et al.27 Dried
soil samples (0.5000 g, in triplicate) were weighed and transferred to 15 mL centrifuge tubes and 10 mL of CH3COOH (0.11 mol L-1, pH = 2.8) were added (acid soluble
fraction, F1). The extraction was accomplished under agitation in a horizontal shaker end-over-end (Barnsteady, Iowa, USA) overnight. In the second phase (reducible fraction, F2) of SEP, 10 mL of NH2OH·HCl (0.5 mol L-1,
pH = 1.5) were added into the tubes. Agitation was performed at the same conditions of the previous step. In the third step (oxidizable fraction, F3) of SEP, 1 mL of H2O2 (30% m/m, pH = 2) and 9 mL of CH3COONH4 (1 mol L-1, pH = 2) were
used. The first steps (F1, F2 and F3) were conducted under shaking at the same conditions during 10 h. Finally, in the last step (residual fraction, F4), an extraction using aqua regia was done on the solid residues from the third step. This aqua regia extraction was performed using the conditions described in the previous section.
After each step, the supernatant was separated by centrifugation (3000 rpm for 10 min) and quantitatively transferred to decontaminated flasks. More detailed information about the experimental conditions can be visualized in Guerra et al.14
Quantitative determination of Cu, Mn and Zn in the extracts
Cu, Mn and Zn were determined in the extracts using FAAS (flame atomic absorption spectrometry) technique in the fast sequential mode (FS-FAAS, Varian, Mulgrave, Australia). In all determinations, an air/acetylene
(13.5 L min-1/2.0 L min-1) flame was used reaching an
approximate temperature of 2200 °C. The sample aspiration
rate was 7 mL min-1 and the monitored wavelengths were
324.7 (Cu), 279.5 (Mn) and 213.9 nm (Zn). A deuterium lamp was used for signal background correction. For the analytical measurements, it was spent 1 s for pre-read delay time, and 3 s of reading (3 replicates of 1 s) for each element and 33 nm s-1 as wavelength scan speed in the fast
sequential mode.
Software and calculations
For PCA application, a data matrix composed by 25 rows (number of samples) and 11 columns (variables under study) was autoscaled in order to equalize the importance of all variables. The Pirouette 4.0 (Infometrix, Bothell, USA) was used to perform this calculation.
For PARAFAC modeling, the data set was organized in five arrays (one for each sampling site): the first one (control points) was composed by 3 metals (percentages of Cu, Mn and Zn), 5 samples and 4 fractions (3 × 5 × 4), the second one (containing the 6 samples from Artigas) was a 3 × 6 × 4 array, and the third one (samples from Bellingshausen) was an array 3 × 5 × 4. The samples from the Chilean stations were organized in just one array (3 × 5 × 4) and the last array was composed by samples from the Chinese station (3 × 4 × 4). These five arrays were used to calculate five PARAFAC models and the routines were freely downloaded
from Prof. Rasmus Bro website.28 No pre-processing was
Results and Discussion
Accuracy evaluation of the aqua regia and SEP assay
The accuracy of the aqua regia extraction and spectrometric determination of Cu, Mn and Zn was evaluated by using a certified reference material, BCR 146 R (Sewage Sludge from Industrial Origin). Good recoveries were obtained for Cu (94%), Mn (98%) and Zn (94%).
The accuracy of the SEP procedure was checked as proposed by Tessier et al.,29 by comparison between the
pseudototal Cu, Mn and Zn concentrations and the sum of the element concentrations in all fractions of SEP. The ratio among these values varied from 0.35 to 1.53 (average of 0.79), and for Cu and Mn, the values from one sample was excluded after the application of a Q test. Both results
are in good agreement with regression coefficient (r) values varying from 0.90 to 0.99, (Figure 1). In addition,
an F test was performed to compare the mean of square
for regression (MSR) and residue (MSr), and significant differences between these parameters were observed for the analytes studied: the ratio between the calculated and tabulated F values ranged from 6 for Mn to 21 for Cu.
PCA and PARAFAC analysis of chemical data
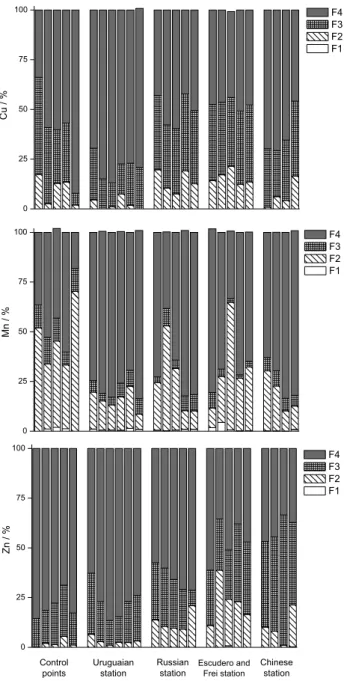
All data generated by the SEP applied were organized in graph bar and can be seen in Figure 2.
As shown in the plot of Figure 2, some trends can be highlighted as: (i) in a general way, for all sites studied,
the fraction F4 (residual, black columns) has the main contribution for the total metal concentration varying from 18 to 92%. This fraction has mainly primary and secondary minerals that confine metals into their crystalline structures. This pool of trace metals is not easily leached under prevailing conditions in the environment,24 and (ii) on the
other hand, the first fraction (F1, acid soluble fraction) has the smallest percentage of metals (0.29% in average). This fraction is related to metals in their ionic forms, weakly associated on the soil matrix, being readily available to be released.23 Nevertheless, achievement of more conclusions
about the raw data obtained from the SEP is hampered by the high amount of information and samples. Then, by using PCA, more associations between variables and samples might be outlined, as can be observed in the scores and loading plots presented in Figure 3.
The score plot of PCA (Figure 3a) shows a clear differentiation between the sampling sites in relation to the distribution of Cu, Mn and Zn along the stages of SEP. Two distinct groups had been formed along the PC 1 axis being the samples collected far from the stations (control
samples) and those collected around Artigas station presenting similar characteristics (see Figure 3a, negative values in the PC 1). On the other hand, the samples collected around the Chilean (Escudero and Frei Montalva), Chinese (Great Wall) and Russian (Bellingshausen) stations have similar chemical profiles (see Figure 3a, positive values at PC 1). The main reason for this separation can be detected by inspection at the loadings plot of PCA (Figure 3b).
The loading graphic shows that control soil samples and Artigas samples have strong contribution of Cu and Zn in the last fraction (F4) of the SEP applied (see Figure 3b, negative values of PC 1 axis). For the samples collected around Great Wall, Bellingshausen, Escudero and Frei Montalva stations, the opposite trend was observed. These samples have a high contribution of Cu and Zn in the more labile fractions (i.e., from F1 to F3 fraction) of the SEP applied, as can be observed in Figure 3b (see the positive values of PC 1). These observations are consistent with the data presented in Figure 2 (graph bar of SEP results). Looking in Figure 2, it is clear that soil samples
from the vicinity of Russian (Bellingshausen), Chilean (Escudero and Frei) and Chinese (Great Wall) stations have lower percentage of Cu and Zn (in average) in the last fraction (F4) of SEP. By this way, it was expected that those samples had higher levels of Cu and Zn in the more labile fractions (F1, F2 and F3) when compared with the samples from Artigas and control sites.
The information obtained from PARAFAC modeling (Figure 4, loading plot) presents important insights about the chemical characteristics of the sampling sites. Valuable information can be obtained from the loadings of the factor 1 and mode 3 (fractions) of the PARAFAC model.
Verifying at the fraction 2 of PARAFAC model (see F2 in Figure 4), it was observed the same trend found after PCA treatment, in which there is an apparent gradation from the most clear and undisturbed sites (Artigas and control
Figure 2. Distribution of Cu, Mn and Zn along the stages (F1: acid soluble fraction, F2: reducible fraction, F3: oxidizable fraction and F4: residual fraction) of the SEP applied.
Table 2. Diesel consumption and emission of metals from burning by stations located in King George Island31
Scientific station/country Diesel consumption / (L per year) Cu emission / (kg per year) Zn emission / (kg per year)
Jubany/Argentina 240,000 0.24 1.2
Bellingshausen/Russia 250,000 0.25 1.25
Frei Montalva/Chile 1,000,000 1.00 5.00
Ferraz/Brazil 320,000 0.32 1.6
Great Wall/Chinaa 250,000 0.25 1.3
Arctowski/Poland 100,000 0.1 0.5
Artigas/Uruguai 150,000 0.15 0.75
King Sejong/South Korea 273,000 0.27 1.4
aEstimated consumption.
Figure 4. Loadings for factor 1 of the PARAFAC modeling (fraction
mode) applied to the SEP results.
samples) through the most impacted ones (Great Wall, Bellingshausen and the Chilean stations). Diesel burning (necessary for energy generation) can be attributed as an important source of Cu and Zn in these impacted sites.
According to Wang et al.,30 emission of anthropogenic
elements by diesel burning is much lower than for crustal elements, but the potential hazardous of the former for the environment is strongly worse. Table 2 shows an inventory related to the diesel consumption and Cu and Zn emission by fuel burning of the principal scientific stations located at King George Island.31
Looking at Table 2, it is clear that diesel burning is an important source of Cu and Zn to the environment studied since diesel burning at Frei station is able to emit around 1 kg and 5 kg per year of Cu and Zn, respectively. Other
stations of Fildes Peninsula (Bellingshausen and Great Wall) are important emitters of these elements from fuel burning. As expected, the degree of pollution by Artigas base is the lowest between the stations under evaluation. Again, it should be noted the strong predictive capacity of the PARAFAC modeling related to the F2 fraction of the SEP applied (Figure 4). Based on the PARAFAC plot,
the crescent order of pollution (related to higher levels of metals at the F2 fraction) is the following:
Control sites < Artigas < Bellingshausen = Great Wall < Frei and Escudero, which closely match with the diesel consumption by these stations (see Table 2).
Conclusions
The chemometric tools PCA and PARAFAC were adequate means to extract useful information from data obtained by sequential extraction procedure application. The soil samples collected at vicinity of the scientific stations are clearly impacted by heavy metals deposition (especially Cu and Zn, between the metals investigated). One of the main sources of Cu and Zn deposition is related to diesel-generator burning by the scientific stations of the area.
Supplementary Information
Supplementary information (Figure S1) is available free of charge at http://jbcs.sbq.org.br as a PDF file.
Acknowledgements
The authors are grateful to Fundação de Amparo a Pesquisa do Estado de São Paulo (FAPESP, processes 2007/04515-4, 2008/08260-3 and 2009/09481-6), Conselho Nacional de Desenvolvimento Científico e Tecnológico (CNPq-INCT da Criosfera-Terrantar Group), Coordenação de Aperfeiçoamento de Pessoal de Nível Superior (Capes, Senior sabbatical leave for Carlos Schaefer) and FEAM (MG) for financial support and the Brazilian Navy and Brazilian Air Force for logistical cooperation.
References
2. Tin, T.; Fleming, Z. L.; Hughes, K. A.; Ainley, D. G.; Convey, P.; Moreno, C. A.; Pfeifer, S.; Snape, I.; Antarct. Sci.2009, 21, 3. 3. Reporting Obligations Database (ROD), http://rod.eionet.
europa.eu/instruments/576 accessed in January 2012. 4. Poblet, A.; Andrade, S.; Scagliola, M.; Vodopivez, C.; Curtosi, A.;
Pucci, A.; Marcovecchio, J.; Sci. Total Environ.1997, 207, 187. 5. Guerra, M. B. B.; Amarasiriwardena, D.; Schaefer, C. E. G. R.; Pereira, C. D.; Spielmann, A. A.; Nóbrega, J. A.; Pereira-Filho, E. R.; J. Anal. At. Spectrom.2011, 26, 2238.
6. Olech, M.; Kwiatek, W. M.; Dutkiewicz, E. M.; X-ray Spectrom.
1998, 27, 232.
7. Bargagli, R.; Sanchez-Hernandez, J. C.; Martella, L.; Monaci, F.; Polar Biol.1998, 19, 316.
8. Bargagli, R.; Agnorelli, C.; Borghini, F.; Monaci, F.; Environ. Sci. Technol.2005, 39, 8150.
9. Osyczka, P.; Dutkiewicz, E. M.; Olech, M.; Pol. J. Ecol.2007,
55, 39.
10. Guerra, R.; Fetter, E.; Ceschim, L. M. M.; Martins, C.C.; Mar. Pollut. Bull.2011, 62, 2571.
11. Ribeiro, A. P.; Figueira, R. C. L.; Martins, C. C.; Silva, C. R. A.; França, E. J.; Bícego, M. C.; Mahiques, M. M.; Montone, R. C.; Mar. Pollut. Bull.2011, 62, 192.
12. Gasparon, M.; Matschullat, J.; Appl. Geochem.2006, 21, 1593. 13. Santos, I. R.; Silva-Filho, E. V.; Schaefer, C. E. G. R.;
Albuquerque-Filho, M. R.; Campos, L. S.; Mar. Pollut. Bull.
2005, 50, 185.
14. Guerra, M. B. B.; Schaefer, C. E. G. R.; Michel, R. F. M.; Rosa, P. F.; Pereira-Filho, E. R.; Br. J. Anal. Chem.2011, 03, 148. 15. Guerra, M. B. B.; Schaefer, C. E. G. R.; Rosa, P. F.; Simas, F. N. B.;
Pereira, T. T. C.; Pereira-Filho, E. R.; Water Air Soil Pollut.
2011, 222, 91.
16. Negri, A.; Burns, K.; Boyle, S.; Brinkman, D.; Webster, N.; Environ. Pollut.2006, 143, 456.
17. Santos, I. R.; Silva-Filho, E. V.; Schaefer, C.; Sella, S. M.; Silva, C. A.; Gomes, V.; Passos, M. J. A. C. R.; Ngan, P. V.; Environ. Pollut.2006, 140, 304.
18. Bronwyn, L. L.; Seen, A. J.; Palmer, A. S.; Snape, I.; Chemosphere2007, 67, 1967.
19. Malandrino, M.; Abollino, O.; Buoso, S.; Casalino, C. E.; Gasparon, M.; Giacomino, A.; La Goia, C.; Mentasti, E.; Microchem. J.2009, 92, 21.
20. Oliveira, L. F.; Canevari, N. T.; Guerra, M. B. B.; Pereira, F. M. V.; Schaefer, C. E. G. R.; Pereira-Filho, E. R.; Microchem. J. accepted for publication, DOI 10.1016/j.microc.2012.03.007. 21. Sahuquillo, A.; Rigol, A.; Rauret, G.; TrAC: Trends Anal. Chem.
2003, 22, 152.
22. Gemperline, P.; Practical Guide to Chemometrics, 2nd ed.;
Taylor & Francis: Boca Raton, FL, 2006. 23. Bro, R.; Chemom. Intell. Lab. Syst.1997, 38, 149.
24. Pardo, R.; Vega, M.; Debán, L.; Cazurro, C.; Carretero, C.; Anal. Chim. Acta2008, 606, 26.
25. Álvarez, M. B.; Garrido, M.; Lista, A. G.; Band, B. S. F; Anal. Chim. Acta 2008, 620, 34.
26. DIN 38 414 Part 7: Digestion using Aqua Regia for the Subsequent Determination of the Acid-Soluble Portion of Metals
(S7), German Standard Methods for the Examination of Water, Waste water and Sludge, Sludge and Sediment (Group S), Berlin, 1983.
27. Ščančar, J.; Milačič, R.; Stražar, M.; Burica, O.; Sci. Total Environ.2000, 250, 9.
28. http://www.models.kvl.dk/algorithms accessed in April 2012. 29. Tessier, A.; Campbell, P. G. C.; Bisson, M.; Anal. Chem.1979,
51, 844.
30. Wang, Y. F.; Huang, K. L.; Li, C. T.; Mi, H. H.; Luo, J. H.; Tsai, P.; J. Atmos. Environ.2003, 37, 4637.
31. Mishra, V. K.; Kim, K. H.; Hong, S.; Lee, K.; Atmos. Environ.
2004, 38, 4069.
Submitted: February 15, 2012
Published online: June 29, 2012
Supplementary Information
0103 - 5053 $6.00+0.00S
I
*e-mail: [email protected]
Chemometric Tools in Chemical Fractionation Data of Soil Samples from
Five Antarctic Research Stations
Marcelo B. B. Guerra,a Paula F. Rosa,a Carlos E. G. R. Schaefer,b,c
Roberto F. M. Michel,b,c,d Ivan C. Almeidab,c and Edenir R. Pereira-Filho*,a
aGrupo de Análise Instrumental Aplicada, Departamento de Química, Universidade Federal de São Carlos,
Rod. Washington Luiz, km 235, CP 676, 13565-905 São Carlos-SP, Brazil
bScott Polar Research Institute (SPRI), University of Cambridge, Lensfield Road CB2 IER,
Cambridge, United Kingdom
cDepartamento de Ciências do Solo, Universidade Federal de Viçosa,
Av. Peter Henry Rolfs, s/n, 36570-000 Viçosa-MG, Brazil
dFundação Estadual do Meio Ambiente (FEAM), Prédio Minas, Cidade Administrativa do
Estado de Minas Gerais, 31630-900 Belo Horizonte-MG, Brazil