Article
*e-mail: [email protected]
Characterization of Salt Efflorescence using Target Factor Analysis.
Development of the Method
Lidija Čukovska,a Orhideja Grupče,b Biljana Minčeva-Šukarovab and Igor Kuzmanovski*,b
aNational Conservation Center, Central Laboratory, Evlija Čelebija, b.b., 1001 Skopje, Republic of Macedonia
bInsitute of Chemistry, Faculty of Natural Sciences and Mathematics, Ss Cyril & Methodius University,
Arhimedova 5, PO Box 162, 1001 Skopje, Republic of Macedonia
Usando-se análise fatorial TFA (target factor analysis), tentamos desenvolver um método
simples e prático para determinar a composição de sais na eflorescência de pinturas de parede, conveniente para o uso no trabalho diário de restauradores. O desenvolvimento do modelo TFA para determinação qualitativa da composição de depósitos de sais nas pinturas de parede é baseado no uso de um banco de dados de espectros de infravermelho das substâncias encontradas na eflorescência. Para isto, vinte espectros de infravermelho de substâncias encontradas comercialmente foram registrados, formando o banco de dados. A análise fatorial (TFA) foi então aplicada para determinar a composição qualitativa dos sais. O procedimento foi testado inicialmente em diferentes misturas artificiais dos sais, binárias e ternárias, mimetizando a eflorescência encontrada nas pinturas de paredes. Como TFA mostrou bons resultados nas misturas preparadas, o mesmo procedimento foi aplicado com sucesso na determinação da composição qualitativa de amostras de sais coletados de duas igrejas na República da Macedônia. Os resultados obtidos confirmaram que o procedimento proposto é adequado para estes tipos de análises.
An attempt is made, using target factor analysis (TFA), to develop simple and practical approach in determining the composition of the salts in efflorescence of the wall paintings, convenient for use in daily work of conservators. The development of the TFA model for determination of qualitative composition of salts deposits on the wall paintings is based on the use of infrared spectra database of substances found in the efflorescence. For this purpose, a total number of twentyinfrared spectra of commercially available substances were recorded, setting the database. The target factor analysis was then applied in order to determine the qualitative composition of the salts. The procedure was first tested on different artificial, binary and ternary mixtures of salts, mimicking the efflorescence found in the wall paintings. Since the TFA showed good results on the prepared mixtures, the same procedure was successfully applied in determining the qualitative composition of salt samples collected from two churches in Republic of Macedonia. The obtained results confirmed that the proposed procedure is suitable for these types of analyses.
Keywords: salt efflorescence, infrared spectroscopy, target factor analysis, qualitative analysis
Introduction
Efflorescence occurs as white crystalline or powdery, often fuzzy deposit found on the surface of materials. Efflorescence emerges when water-soluble compounds, which are at least partly derived from the substrate materials, migrate through the substrate to the surface where they react with compounds in the environment or change their state of hydration to form visible clusters.1-5
This effect causes damage and deterioration of the art objects and can have serious consequences on the wall paintings in the churches. Conservation treatment of these objects is highly dependent on well-established knowledge of the salts present in the efflorescence.6-9 On the other hand, identified salts could indicate the origin of the efflorescence as well as the degree of degradation processes.
of different salts often give complex infrared spectra that cannot be easily differentiate and interpreted. It requires knowledge of an expert in the field of infrared spectroscopy for appropriate interpretation of these results. Instead empirical assignment of the IR bands according to their wavenumbers and intensities, and, in order to try to minimize the role of the human factor, an attempt was made to apply target factor analysis (TFA) in determining the composition of the efflorescence samples.5
The efflorescence samples collected during last conservation works performed in 2006 in two churches in Republic of Macedonia (Sv. Bogorodica Perivlepta in Ohrid and Sv. Bogodorica in Lesok) were used here to check the feasibility of the proposed method.
Experimental
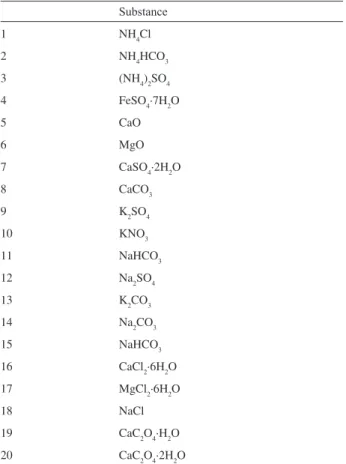
Commercially available p.a. grade salts were used as standards (Table 1). The spectra of the standards (20 different salts), the spectra of the prepared mixtures as well as the spectra of the analyzed samples were recorded using technique of KBr pellets. For each pellet, 1 mg of a sample and 250 mg of KBr (spectroscopy grade) were used. The binary and ternary mixtures were prepared, with different,
but exactly known mass fractions of the components. The samples for analysis of efflorescence collected from the churches were prepared the same way as above mentioned. All infrared spectra were recorded at room temperature in the 4000–370 cm-1 region on a FTIR Perkin-Elmer System 2000 spectrometer (with 32 scans and resolution of 4 cm-1). If the maximum value of the absorbance in the recorded spectrum exceeded one, the mass of the sample in the KBr pellet was proportionally reduced in order to achieve the desired maximum value of absorbance. The data processing was carried out using programs for target factor analysis10,11 developed in Mathcad 12.0.12
The efflorescence samples, collected in Sv. Bogorodica Perivlepta in Ohrid, were taken fromthe northern wall of the nave of the church, where efflorescence was the most pronounced. The collected samples from the Sv. Bogorodica in Lesok, were taken from northern wall of the nave. In both cases the samples were collected from the area that covers about 4–6 m2.
Data analysis procedure
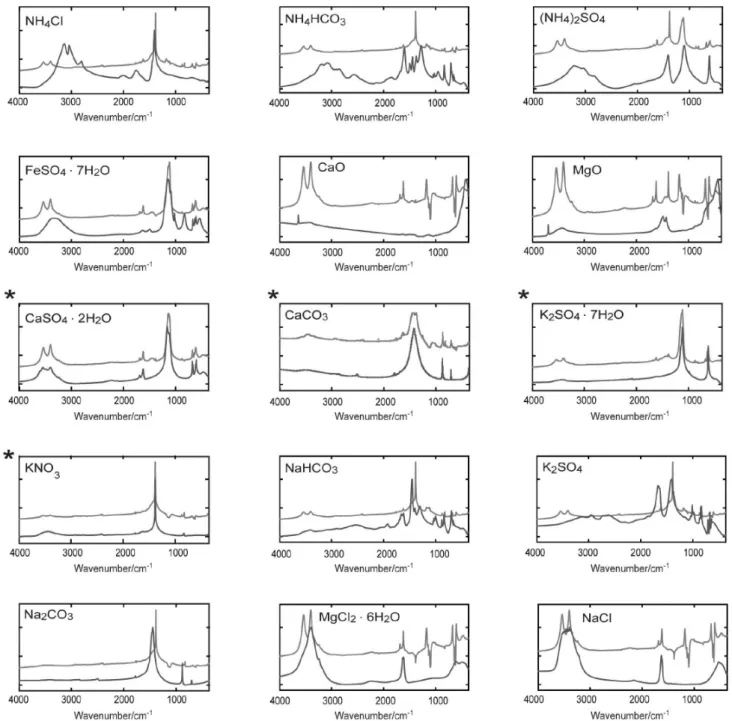
The development of the TFA model for prediction of qualitative composition of salts present in wall paintings requires the use of infrared spectra database of substances regularly found in the efflorescence. For this purpose infrared spectra of commercially available and/or synthesized pure inorganic salts, commonly found in efflorescence (in total 20) were recorded, setting the necessary database.
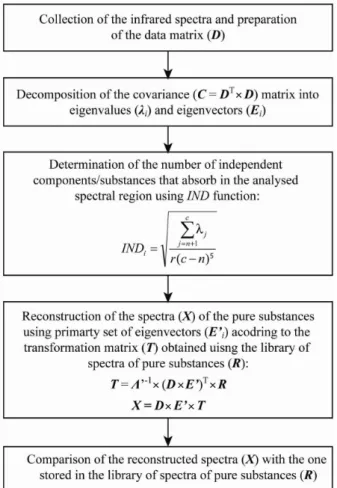
A detailed description of the TFA in chemistry is given in the literature.13 Here, only the basics will be briefly summarized. The procedure consists of several steps. Schematic representation of the procedure is given in Figure 1. The first step of the procedure is the setting of the data matrix D (with dimensions: r × c) and is pre-multiplied with
its transpose to obtain the covariance matrix C (c × c):
C = DT × D (1)
The next step is the decomposition of the covariance matrix into its eigenvalues (these will be labeled as li) and eigenvectors (E). The column i of the matrix E corresponds to i-th eigenvector.
When the target factor analysis is applied to spectroscopic data, the data matrix consisting of the variables (wavenumbers or wavelengths) defining the spectra is first multiplied by a matrix E’ (c × p) consisting of
only primary eigenvectors to obtain the matrix A (r × p):
A = D × E’ (2)
Table 1. List of salts used as standard (stored in the used database)
Substance
1 NH4Cl
2 NH4HCO3
3 (NH4)2SO4
4 FeSO4·7H2O
5 CaO
6 MgO
7 CaSO4·2H2O
8 CaCO3
9 K2SO4
10 KNO3
11 NaHCO3
12 Na2SO4
13 K2CO3
14 Na2CO3
15 NaHCO3
16 CaCl2·6H2O
17 MgCl2·6H2O
18 NaCl
19 CaC2O4·H2O
The columns of A define the abstract eigenspectra. The
obtained eigenspectra are then converted into real ones using the transformation matrix which is calculated using the following expression:
T = L’-1×AT×R
(3)
In this equation T (p × s) is the transformation matrix, Λ’-1 (p × p) is the inverse diagonal matrix of the primary
eigenvalues (l’i). The matrix R (r × s) is the matrix of a
prearranged library of spectra. Once the transformation matrix is calculated, it is then used to transform the matrix consisting of abstract eigenspectra into real spectra. Thus, a matrix consisting of the reconstructed spectra X (r × s)
is given by the equation:
X = A × T (4)
In the last phase, the reconstructed spectra are visually compared with those in the matrix R consisting of the
prearranged spectra of standards.
Very important step in the use of factor analysis is to determine the number of independent components (in this
case the substances present in the mixtures). In more formal, mathematical sense, we could say that, this is a process of finding the eigenvalues and eigenvectors that belong to the primary set. The search for the number of eigenvalues/ eigenvectors that belong to a primary set was performed using factor indicator function (IND). The minimum of
this function (in the absence of nonlinearities in the data) points out to the number of chemical species present in the samples. This function is defined as follows:
(5)
where lj are the eigenvalues resulting from the decomposition of the covariance matrix C, n represents the number
eigenvalues used for calculation of IND, c is the number
of columns in the data matrix D, r is the number of rows
in the data matrix.
Results and Discussion
After creating the IR spectra database of inorganic salts commonly found in efflorescence, the procedure was tested using different, artificially prepared, binary and ternary mixtures of salts (Table 2), mimicking the efflorescence found in the wall paintings.3-6 The TFA was applied to a data matrix, consisting of the recorded spectra of the mixtures (binary and ternary) in the 4000–370 cm-1 region.
The values for the IND function for these mixtures are
shown in Table 3. In all the cases, the respective minima of the IND are at the expected number of components
(n = 2 for binary and n = 3 for ternary mixtures). The TFA
procedure resulted in perfect match with the number of components in the prepared mixtures. It should be noted that tested mixtures were artificially made, by mechanical mixing of the substances.
Since the results obtained during the application of TFA on the artificial mixtures showed excellent match and were encouraging, the feasibility of the procedure was tested on salt efflorescence samples collected during
Figure 1. Simple schematic representation of the main steps of the target
factor analysis.
Table 2. Artificial mixtures used for testing TFA approach
Mixture no. Constituents of the mixtures 1 CaCO3; K2SO4·7H2O
2 CaSO4·2H2O; MgCl2·6H2O 3 KNO3; K2SO4·7H2O
the last conservation works performed in two churches: Sv. Bogorodica Perivlepta church in Ohrid and from Sv. Bogorodica in Lesok.
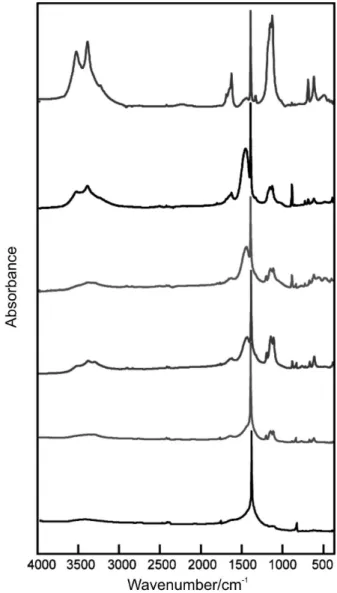
It is important to emphasise that this procedure requires collecting a number of samples from each site in order to obtain a representative sample. It means that 6–8 samples should be taken for each measurement. This could not be considered as a disadvantage of the method, since the thorough examination of the efflorescence is crucial for the appropriate treatment of the wall paintings. During the sampling, the important part was also to estimate the optimal area from which the samples should be collected. At the beginning representative samples were collected from the area of about 30 cm2. The recorded spectra of these samples did not show variability in the concentrations of the constituents of the salts in efflorescence (Figure 2). But, since the method requires that the concentrations of the constituents should vary in the samples, after several trials, we found that the optimal area, from which the efflorescence samples should be taken, for these two churches, covers about 0.6–0.8 m2. Collecting samples for similar analysis of salts in efflorescence from other objects will also require defining the optimal area from which the samples should be collected.
In Figure 3, six infrared spectra of the samples taken from the northern wall of the nave from Sv Bogorodica Perivlepta church are presented. The differences in the appearance of the recorded spectra suggest the presence of two or maybe three components. The infrared spectra for six of the collected samples from the lower part of the northern wall of the nave of the church Sv. Bogorodica in Lesok are presented in Figure 4.
The data matrices composed of infrared spectra of all the samples taken from both churches were processed as presented in the data analysis procedure section of this manuscript (Figure 1). The number of components (determined by IND function) present in the samples
taken from Sv. Bogorodica Perivlepta is three (Table 4). The reconstructed real spectra were compared with the one stored in the database using apparent error in targets (AET):
Figure 2. Infrared spectra from the salt efflorescence samples taken
from Sv. Bogorodica church in Lesok from the area that covers about 30 cm2.
Figure 3. Infrared spectra of the efflorescence samples taken from Sv.
Bogorodica Perivlepta church, Ohrid, Republic of Macedonia.
Table 3. Values for the IND function for the analyzed mixtures
Mixture no. Values for the IND function for the analyzed mixtures
1 2 3 4 5
1 0.0039 0.0007 0.0010 0.0036
2 0.0046 0.0015 0.0035 0.0048
3 0.0767 0.0106 0.0292 0.0497
4 0.0044 0.0019 0.0023 0.0053
Table 4. Values for the IND function for the discussed samples of efflorescence taken from the walls of the analyzed churches
Values for the IND function for the analyzed efflorescence samples
1 2 3 4 5
St. Bogorodica Perivlepta, Ohrid 0.002826 0.002681 0.002332 0.003311 0.014463
St. Bogorodica, Lesok 0.004636 0.003477 0.001524 0.007165 0.010510
Figure 4. Infrared spectra of the efflorescence samples taken from Sv. Bogorodica church, Lesok, Republic of Macedonia.
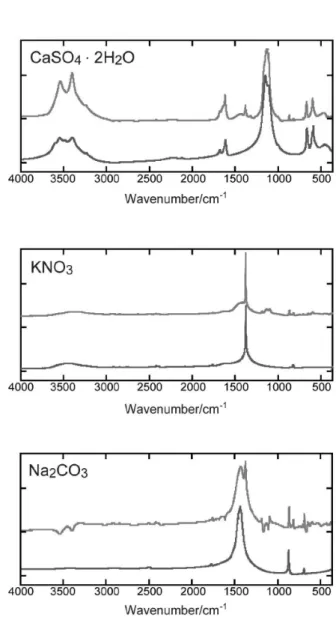
Figure 5. Comparison of the reconstructed spectra (upper spectra) with the spectra of the standards (lower spectra) stored in the database for the efflorescence samples taken from Sv. Bogorodica Perivlepta, church in Ohrid.
(6)
In the previous equation xkj is an element of X and rkj is
an element of R. The smallest calculated values of AETj are
an indication of good agreement between the reconstructed spectra and the spectra stored in the database.
After this direct visual comparison of the target transformed spectra with the best matching spectra of the standards stored in the database of the IR spectra is performed (Figure 5). The results show that the efflorescence from wall paintings in Sv Bogorodica Perivlepta church in Ohrid consists of three major components: CaSO4·2H2O, Na2CO3 and KNO3, which is in agreement with the result for the efflorescence composition obtained with the classic methods.
When this method is applied, one should bear in mind that in the case of non-linearity of the collected spectra, there is a possibility that the predicted number of the independent components (by the IND function),
will not always match the exact number of compounds in the infrared spectra. Advantage of this method is that it allows simple visual comparison of the target transformed spectra with the spectra of the database, helping to identify the substances present in the mixtures. This is the case with the samples taken from Sv. Bogorodica in Lesok. In this case IND function pointed out that the
Conclusions
The results presented in this paper demonstrated that TFA allows simple approach in determining the composition of the salts in efflorescence through comparison of the infrared spectra of the pure salts (stored in the database) with the ones reconstructed by TFA.
If any uncertainty occurs in assessing the number of components in the mixtures, the visual comparison of the reconstructed spectra of efflorescence salts and the spectra
of the pure substances stored in the database, could help in determination of the exact number of chemical components in the analyzed samples.
Although, the use of this method does not eliminate the need of basic knowledge in the field of infrared spectroscopy, the use of TFA could be useful for acquiring correct information for the composition of the analyzed samples. According to our experience the procedure is especially helpful in cases where there is certain overlap of the bands in the infrared spectra.
Acknowledgment
The financial support of the Ministry of Education and Science of Republic of Macedonia is gratefully acknowledged.
References
1. Grozdanov, C.; XIV Century Wall Paintings in Ohrid, Faculty of Philosophy, University of Belgrade, Belgrade, 1980. 2. Vesic N.; MSc Dissertation, National Technical University of
Athens, Athens, 2001.
3. Arnold A.; Zehnder, K; First International Symposium on the
Conservation of Monuments, Brescia, Grafo, 1990.
4. Zehnder, K.; Arnold, A.; J. Cryst. Growth1989, 97, 513. 5. Woolfitt, C.; Soluble Salts in Masonry, http://www.
buildingconservation.com/articles/salts/salts.htm, accessed in August 2008.
6. Ordonez, E.; Twilley, J.; Anal. Chem. 1997, 69, A416. 7. Charola, A. E.; J. Am. Inst. Conserv.2000, 39,327.
8. Wüsta, R. A. J.; Schlüchter, C.; J. Archaeol. Sci.2000, 27, 1161.
9. Mora, P.; Mora, L.; Philippot, P.; Conservation of Wall Paintings, Butterworths: London, 1984.
10. Kuzmanovski, I.; Trpkovska, M.; Šoptrajanov, B.; Stefov, V.;
Vib. Spectrosc. 1999, 19, 249.
11. Kuzmanovski, I.; Proceedings,XVIII Congress of Chemists and
Technologists of Macedonia, Ohrid, Macedonia, 2004.
12. MATHCAD 12.0, MathSoft, 1986-2004.
13. Malinowski, E. R.; Factor Analysis in Chemistry, 2nd ed., Wiley:
New York, 1991.
Received: February 20, 2008