Work Project undertaken as part of the requirements for the Award of a Masters Degree in Finance from NOVA – School of Business and Economics
Oi Merger with Portugal Telecom
A Strategic Partnership
Mauro Miguel Rodrigues Martins (# 591)
A Project carried out as part of the Finance major under the supervision of:
Professor Paulo Pinho
Date
2
Abstract page
Oi merger with Portugal Telecom: A Strategic Partnership
This work seeks to explain and quantify the synergies resultant from the merger between Portugal Telecom and Oi. The main question we analyze throughout our analysis was whether the merger could bring some advantages that wouldn’t be achieved through the previous industrial alliance and to whom would the merger be more beneficial. Our conclusion was that since it will be impossible to replicate the Meo brand, the synergies should resume to faster cost cutting gains and interest payment savings through a capital increase which will be used to repay debt, besides enjoying a larger scale, accounting for minimal synergies.
3
Contents
Company Overview: Portugal Telecom ... 4
Portugal Businesses & Financial Performance ... 5
Residential Business ... 5
Fixed line (fixed phone) ... 5
Pay-Tv ... 7
Fixed Broadband (Internet) ... 9
Personal Business ... 10
Enterprise Business ... 12
Oi and the Brazilian market ... 13
Oi Businesses Segments and Operational fragilities ... 14
Residential Business ... 15
Personal Business ... 17
Enterprise Business ... 19
Strategy Issue: Is MEO brand replicable in Brazil? ... 19
Valuation Methodology & Cost of Capital ... 21
The deal structure ... 22
Synergies and M&A environment ... 24
References ... 29
4 Company Overview: Portugal Telecom
Portugal Telecom (PT) is a multinational telecommunications company and currently the largest one operating in Portugal. PT offers a broad number of different services in the telecommunications segment, namely fixed, mobile, multimedia, data and corporate solutions. The geographical area covered by PT is mainly focused in three core areas: Portugal, Brazil and Africa. PT has a total client base of over 100 million customers, which represent total operational revenue of 6599 billion euros in 2012.
Recently, the main source of revenues has shifted from domestic operations to the Brazilian market1, being that these two markets represent 94.9% of PT’s revenues.
The Brazilian market has been the main focus of PT investments, with a huge consolidation effort between OI and Contax. There have been some major events related to PT’s presence in the Brazilian market. Up to 2010, PT had a major stake2 in the
Brazilian telecommunications company Vivo, which ended up being sold to Telefonica. But understanding the importance of this market, PT ended up reinvesting in Brazil, acquiring respectively a 25.6% stake in OI, which had not only the largest presence in Brazil but also similar business operations.
PT is a relatively new publicly traded company, having started as a fully controlled government company which underwent a privatization process3. Currently the main shareholders are the Espírito Santo Group (10.12%), RS Holding (10.05%), Telemar
1
With a stake of 53.3% of the total revenues 2
29.71%
3 The first privatization phase took place in 1994, passing 27.26% of the capital to the private sector. The last
5
Norte Leste S.A. (10%) and Caixa Geral de Depósitos Group (6.31%).
Portugal Businesses & Financial Performance
For simplifying reporting, in 2011 PT has categorized its operations by costumer type, segmenting them in four big groups: Residential, Personal, Enterprise and Other.
The Residential segment encompasses fixed phone & broadband services and pay-TV, which are sold under the brand MEO4. The Residential segment per turn is related to mobile services for non-corporate clients, being managed under the brand TMN. Finally, the Enterprise segment is destined to all corporate clients, covering all the previously mentioned services.
As will be analyzed in the next section, the weights of each of the segments have experienced changes over-time, mostly due to business model changes than due to the macroeconomic environment. The macroeconomic environment is characterized by unemployment increasing rates associated with negative GDP growth, a recession that has caused especially big impact in Portugal.
Residential Business
Fixed line (fixed phone)
The first component we will analysis is also the oldest one. Fixed line services have been one of the core businesses of Portugal Telecom since its inception, and its main business for a long time. Still, the times have taken their toll into fixed phones services, and their 39.6% share in revenues has greatly decreasing. Furthermore, the revenues from fixed line
4
6
retail in Portugal have decrease by nearly 46% since the year 2004 till 2010, together with the time spent using the service, which amounts to 25.6% for the same period. We can identify a number of factors that explain this fact. Firstly, we can identify the profound cultural changes that happened in this period, more specifically the substitution of fixed phone for mobile. The penetration rates for fixed phone have been decreasing
progressively in the last years, trend that is visible not only in Portugal but in the whole European Union, which illustrates the fact that this component is getting out of fashion. Secondly, it is interesting to note that the decrease in the traffic is considerably lower than the one in revenues, which brings the issue of competition increase. This market is now centered in bundled offers, having the different players evolved to duo, triple and recently quad-play, selling correspondently packages of fixed phone, fixed/mobile broadband, pay-tv and mobile phone. These packages offer considerable price advantages compared to the sum of the individual services for the consumers, which in part explains the deeper
decrease in revenues compared to minutes spent on the phone.
As far as competition goes, PT has been losing market share to the alternative providers, with especial highlight for Zon56, which since its spin-off has conducted an aggressive price strategy, offering overall better conditions than PT.
Finally, we can also relate the event of the European, and Portuguese especially, crisis to the decrease in revenues for this component. On one hand, contrarily to bundle offers, the sole fixed line service follows a policy of pay-per-use, instead of a fixed monthly cost,
5
The low values of 2007 are due to the fact that ZON had just become an individual company, resultant from the spin-off that occurred in 2007, when PT Multimédia left the PT Group, and renamed the company for ZON.
6 Note that the market share correspondent to the years 2012 and onwards for Zon is correspondent to the
7
which allow the users to adjust the usage accordingly to their needs. On the other hand, the fact that fixed phone is included in the bundled offers generates resilience to budget
adjustments, resilience which will be greater to the degree of fixed phone revenues breakdown (sole service vs. bundled) and the resilience of bundled offers themselves.
Pay-Tv
Pay-tv services are the anchor of the residential business segment, being the most
profitable division of this segment. Furthermore, ever since the launch of the MEO brand, this division has shown a positive growth rate (far superior than other business segments), and gradually led the residential segment to be the most important source of income. As mentioned before, there have taken place deep cultural changes, mainly on how this
service is perceived. From a luxury product, it became a somehow “ordinary” product,
having reached a penetration rate of nearly 50% in Portugal. Portugal has very strict regulation in TV broadcasting, currently allowing only four channels to broadcast for free (free-to-air channels). Moreover, there is strict regulation against exclusive content for these channels, which allows for pay-tv service providers to explore a wide market. In other point, pay-tv has been (and correctly) the main area of innovation and diversification of PT. PT has not only investing in its fiber network, thus providing top-notch image quality, but also in a series of value-add features, such as customizable content7, premium channels8, pay-per-view, games, music and other features9.
Still, future perspectives point out for a deceleration in residential TV driven growth.
7
MEO allows for the creation of one’s own channel. 8
Benfica TV for example.
9 Temporary channels related to famous TV programs ( Secret Story for example) and possibility to save
8
PT penetration rates already surpass 75% of primary households, which are in line with European ones. Still, although the net additions might suffer considerably, the revenues trends are mostly expected to show resilience. To begin with, PT implemented a price increase of 3% in the beginning of the current year which is being accompanied by a politic of cost cuts that has been undertaken since 2011, which partially offset considerable effects in both the revenues and EBITDA. Secondly, given the majority of additions were done through bundled offers, the latter’ typically involve a contract of at
least two years which is usually extended for two extra years, strategy that has proven to be very efficient in locking the client base. Additionally, the basic service is paid in fixed terms, which doesn’t allow major fluctuations in the revenues for this segment,
being that most fluctuations derive from related value-add services.
In terms of future perspectives of necessary investment, the outlook seems to be stable since PT cable network is already best-in-class and able to support the future and latest technology developments in terms of both speed and image quality. Also, exclusive content wise, PT seems to be well provided. In other point, the competitive environment seems to be increasing. Cabovisao (the second largest cable operator in Portugal) has renewed its shareholder structure, being now fully controlled by Altice10 and presenting itself as an increasingly dangerous competitor. Vodafone also announced an increase in their investment in fiber network and finally Zon and Sonaecom have showed intentions to reduce their overall prices comparatively to the other players.
Finally, the Quad Play market may suffer some changes. Although PT doesn’t seem to
10 Altice is a multinational cable and telecommunications company with presence in six countries,.
9
be aggressive in this sector, changes in the competitors’ offers may require some further attention, especially now that Zon Optimus has introduced Zona4i.
Fixed Broadband (Internet)
Fixed Broadband is the last subdivision of the residential segment, and even though not being the main source of revenues, it might be the most important one.
Fixed Broadband is probably the sector that suffered most business model changes. Internet is now almost considered a basic need and indispensable for both working and learning. Still, the Portuguese penetration rate for this service it’s still far from the European average, which presupposes growth opportunities. On the other side, there are several providers for this service and mobile broadband is becoming more and more popular. Alongside the pay-tv service, the cable network is also top-notch, thus notorious investments are not expectable. Furthermore, the competition changes mentioned in the pay-tv are also applicable for the fixed broadband11, which means that further differentiation in the products will be the key in the balance of market share. Most likely, market share will be gained through bundled offers (as most of the net additions have been lately). As I mentioned previously, fixed broadband is of utmost importance and that is not as a standalone segment but rather as a determinant component of bundled offers. To begin with, internet speed and quality have been assuming a lot of relevance in terms of being a factor of decision when deciding which kind of bundled offer to take12. Additionally, the penetration rates for fixed broadband are still low compared to the European average, and as such, between the components of
11 Since all the mentioned players are at least triple-play. 12
10
the residential business segment, fixed broadband might be the one with the biggest growth potential, having considerable spillover effects if sold through bundled offers.
Personal Business
Personal Business, represented by the subsidiary TMN, was until 2011 the second main source of revenues for Portuguese operations. Still, from 2011 onwards (including the estimates for the near-medium term) this segment is experiencing a downward trend. Some major factors are behind this tendency, being the main ones: (1) payment mechanisms for this service, (2) tribal plans, (3) small growth potential and (4) Mobile Termination Rates (MTRs) cuts.
To begin with, the majority of plans in Portugal work in a pre-paid basis13, which allows for an ex-ante control of expenditures and quicker adjustments for both price and macroeconomic changes. Additionally, besides the basic plan, the revenues from this segment derive from a per call charge (fairly easy to control). Related to this issue and a relatively big concern in this segment was the surge of tribal plans14, originally launched by Optimus through the plan Tag, which was quickly followed by the other operators and consequently forced TMN to also develop such a plan (Moche) in order to keep market share. Currently there are several tribal plans available15 and it is most likely a permanent fashion in this segment. This kind of plans have at least two major consequences: free communication services between members, which directly involve a loss of revenues and the fact that members enjoy many advantages by adhering to these
13
That is, the payment is done ex-ante the actual use of the service. 14
Tribal plans are pre-paid plans that are characterized by free communication services (such as voice calls, video calls, SMS, MMS, etc.) between members of the plan and/or related plans.
15
11
plans, being that when a community is formed, there is a strong inertia for the members to change to other operator, thus creating barriers that prevent major changes in the client base. The third factor is related to the small growth potential for this segment. The penetration rates for this segment are already very high and on par with the European ones and due to the inertia of changing operators, the gain of market share from competitors is an unconvincing scenario. On the other hand, the mobile broadband is gaining popularity, and the trend is uphill since the new generation of smartphones is increasingly more oriented for applications directly connected to the internet.
The quad-play bundled offers also present challenges for this segment since these products bring to the table yet another development to the tribal plans, free telecommunications for other operators. Even if we just consider the scenario where this plans will only be available through bundled offers, there is still a huge margin for revenues cannibalization, since clients that had subscribed to a triple play product and have TMN as the preferred operator will most likely upgrade to one of these products. On the other side, by shifting the payment method to a fixed method, the revenues should become a bit more resilient to economic downturns. Nevertheless, the revenues are most likely to suffer from a potential development of this market since: (1) the implied resilience should not compensate for the sales cannibalization and (2) it is very unlikely that the market share balance will be disrupted since the main competitors are also able to offer similar products, consequently limiting future net.
12
risks of this analysis, as a development from any of the competitors may require an answer from PT.
Finally, regulatory changes have also put some strain in the revenues flows. ANACOM has been active imposing gradually price limits on MTRs since 2011, with immediate impact in the revenues since the charged price is lower.
Enterprise Business
This last segment is the most important, revenue generation wise, for the Portuguese operations, amounting to 896 million euros in 2012 which corresponds to approximately 33.2% of the operating revenues for that year.
The financial performance of this sector has been especially affected by the macroeconomic environment since it is tied up to corporate performance. In response to the recession, both public administration and big corporations have undertaken cost cutting policies and minimized future investments, thus decreasing both current as well as potential future ones. Tied to this issue is the fact that the enterprise segment is highly dependent on voice products, being that the same represented 53.6% of the revenues from the segment. On the other hand, PT has started to put extra effort in counterbalancing this trend, by shifting the focus of this segment to non-voice products, positively achieving a weight of 50.3% in the revenues respectively in 2012.Moreover,
the high quality of PT’s product is an important determinant for the maintenance of the
segment revenues, not only in the sense of maintaining the current clients but also by acquiring new ones.
13
macroeconomic environment but due to PT’s superior technology and strategy to shift the core of revenue generating components to less floating ones (i.e. non-voice products), it was able to counterbalance the effects of the macroeconomic environment. Nonetheless, we expect the revenues to experience a negative growth of 17.4% till 2015, slightly recovering in the next two years, achieving a value of 762 million euros in 2017, which implies a shift in the main source of revenues, being that the enterprise segment for the last year represents only 31.8% of the total operating revenues.
Oi and the Brazilian market
Oi is the largest telecommunication services provider in Brazil, with national presence and the only fully integrated16 company. In sequence of the strategic partnership with PT that took place in 2011, Oi adopted the same reporting system, thus segmenting their revenues by clients. Oi enjoys a rather large client base, with over 74 million clients, which represented over 11 billion euros in operational revenues by 2012. Still, if we compare Oi revenue breakdown to PT (Portuguese operations), we can see some major differences. The main source of revenues for Oi is the Residential Segment, with nearly 36%, followed by personal (32%) and Enterprise (30%).
Oi is characterized by having a fairly complex shareholder structure with many shareholders and a difficult definition of actual ownership since many shareholders have control over Oi trough stakes in other companies17, and presenting two distinct types of
16
Oi is a Triple-play company, also providing mobile products.
17 PT for example owns a total stake of 25.6% through Telemar Participações, Bratel Brasil, AG Telecom and
14
stock: normal stock and preferred stock18.
The Brazilian market presents also some major dissimilarities from the Portuguese. To start with, the Brazilian market is experiencing a booming phase, characterized by high levels of GDP growth (over 5%) and employment growth till 2011. In the recent years, Brazil has showed a growth deceleration highly due to infrastructure bottlenecks that discouraged investment. To counter this problem, the Brazilian government started with concessions to the private sector and has such it is expected that Brazil keeps a steady growth in the next years (close to 2.5%19). Furthermore, Brazil has kept a strong exchange rate policy which has also stimulated financial performance.
Oi Businesses Segments and Operational fragilities
Despite the size of Oi and the entrance of PT into the capital structure, Oi still presents several and considerable operational fragilities. To start with, Oi has not been able to capture revenues at the same pace of its competitors, which combined with a poor management20 resulted in poor EBITDA margins compared to its peers. By 2011, PT entered the management (and capital) structure of Oi, and the consequent guidance has started to show its effects with efficiency gains reflected in the growing operational margins, trend that we expect to persist for the forecasted period.
Oi has also been suffering in its main revenue source, the residential segment, which is mainly due the fact that Oi’s cable network is especially outdated and doesn’t have the
18
No voting rights. 19
World Economic Outlook
20Aggravated by the fact that the CEO had left in 2011 after 1,5 years in command, causing panic among the
15
capacity to deliver products with the same quality as its main competitors. Consequently, Oi is by far the Telecom operator more complained about, both on absolute and per subscriber basis, which sets many doubts on its ability to conserve its client base. Still, even being aware of these fragilities, the CAPEX levels of Oi are far too low for its needs, especially when we consider that the delivery channels are of utmost importance in the telecom industry. Additionally, we forecast that the CAPEX levels should remain relatively flat in the forecasted period, partly because Oi hasn’t
show yet a real intent in upgrading their cable network, but rather improve its pay-tv products, which don’t involve high levels of CAPEX.
Finally, due to the expansion that this sector has been experiencing, the regulators of this market are (and are expected to be) very active. Subsequently, we can identify three major points where ANATEL21will have a big impact: (1) improvement of the services’ quality, (2) pressure to reduce prices and (3) network disaggregation.
Residential Business
As mentioned previously, the residential business is the one that generates more revenues. Nevertheless, this segment has been losing ground at an impressive rate22 (CAGR of -7%), which is greatly derived by the heavy weight of fixed line services (66% in 2013), whereas fixed broadband (29.2%) and pay-tv (4.8%) assume half the weight of fixed line alone. As explained for the fixed line section of PT domestic operations, fixed line is losing its relevance mostly due to the fixed-to-mobile substitution phenomenon, and this trend is worldwide pointing out for its persistence.
21 Brazilian Telecom Regulator 22
16
Fixed Broadband performance has also been far from outstanding, despite the fact that net additions in subscribers were positive. This business suffers most from the old cable network23 as it cannot deliver higher internet speeds, thus losing ground as clients start to demand higher velocities, visible by the increase in the average connection speed, which went from 1.7Mbps in 2010 to 2.4Mbps in the third quarter of 2013. Furthermore, accesses with speeds over 2mbps almost doubled since 2012, with >12Mbps gaining expression. Bottom line, this market is booming, also due to the low penetration rates (10.5% in 2013), but the low quality of Oi’s cable network is a major peril to capture future subscribers (and keep the current).
Pay-tv services, although the low expression in revenues, have been the one business in this segment that has actually performed well, highly due to the presence of PT into Oi management. Oi TV24, while a small player, has consistently gained market share (from 2.8% in 2011 to 5.2% in 2013¾), and more than doubled its client base. These developments are in line with the company objectives to develop these products, especially due to their importance in the bundled offers as explained before. Still, once again the quality of the cable network is highly impeditive to fully grasp the potential of this market, as high quality products cannot be delivered25.
The competitive environment in this segment has also been fierce and harmful for Oi. With the exception of Pay-tv services, Oi has lost market share in both fixed line and fixed broadband (despite positive net additions on the latter). Furthermore, this issue
23
Oi cable network is able to deliver speeds in the order of 2.6Mbps 24
The subsidiary of Oi that operates the pay-tv business.
25 According to PT it is required line speeds of at least 8Mbps for standard definition IPTV and 12Mbps for
17
takes a bigger dimension as most of market share has been netted by GVT. GVT operates in the same region as Oi and has done massive investments, successfully increasing its market share in more than 50% in all 3 businesses, and gradually becoming a strong player in the market.
Regulatory developments may also have some impact on this segment. As mentioned before, ANATEL has been pressuring in order to increase the services’ quality, penalizing the ones that don’t fulfill some milestones. Consequently, the high complaint rate of Oi is a matter of importance, as they might be forced to invest to improve the situation. On the other hand, ANATEL has also shown intent to promote network disaggregation, i.e., force players with considerable market share to lease their cable network by a fixed rate, thus decreasing barriers to enter the market. This last regulation plays two ways: if in one hand lower barriers may promote further competition, in the other, considering the low quality of Oi’s cable network, depending in the leasing rate it
might be highly benefic for Oi, as they wouldn’t have to incur in the massive investment
to upgrade their cable network.
All in all, we expect the revenues for this sector to grow, mostly through completely new subscribers, but at lower rates than its full potential due to the many structural problems Oi presents. Additionally, these issues if unattended will pose serious difficulties when the market becomes mature, as currently and in the near-medium turn, it is possible to increase revenues through higher penetration rates.
Personal Business
18
revenues of 32% in 2012. In spite of the growing market for telecommunication’s services, the personal segment is already a mature market with a penetration rate of over 136% in October 2013 (from 131% for the same month last year). Additionally, in resemblance of the Portuguese market, it is heavily skewed towards pre-paid plans, which in the macroeconomic environment of Brazil, don’t represent necessarily a
weakness. The competitive environment is also more restricted when compared to the other segments, with only four big players26 in the market, being that Oi has a total market share of 18.56%. Furthermore, the market shares of all players have been relatively flat since 2010 and it is not expectable that they float considerably in the future.
Since the market is mature, net additions are limited, thus revenue growth potential is essentially derived from (1) traffic volume, (2) mobile data and (3) MTRs. For the first point it is expected, although temporarily, that the events27 that will take in Brazil in the near-medium term, to drive positively the revenues. Mobile Broadband per turn, although an increasing business, suffers from the fact that the client base of Oi ranks among the poorest, conjunctly with the fact that technology prices in Brazil are very high, which points that no major gains should derive from this point. Finally, ANATEL has imposed a decrease in MTRs of 25% in 2014, with a chance of further cuts as mobile tariffs in Brazil are considered very expensive. Bottom line, even though in the short-term the increase in traffic volume may offset partially the MTRs cuts, it is expected that this segment suffers considerably from the decrease in prices.
26 Vivo, TIM, Claro and Oi.
27
19 Enterprise Business
The enterprise segment encompasses the remaining 12% of Oi’s clients and 30% of revenues. In resemblance to Oi residential business, it is heavily skewed towards fixed line, 61% of clients, being that mobile and broadband represent respectively 32% and 7%, with pay-tv having no expression. The client base has experienced a positive growth in 2012, 14.3%, especially resultant from the increase in mobile accesses (31.8%). This segment was identified by Oi as one of the main focus, being the shift in the revenue breakdown one of the main objectives, decreasing the exposure to fixed line. It is expectable for this segment to generate positive revenues growth, especially due to the fact that it is tied to corporate performance as explained before. Nonetheless, it suffers from the above mentioned issues for all the businesses that it involves and consequently the increase in revenues should be modest.
Strategy Issue: Is MEO brand replicable in Brazil?
As discussed before in a previous section, MEO brand is the biggest flag of PT products, in which PT bets to carry most of technology developments and market differentiation. MEO was so innovative that in a short period captured over 30% of the pay TV market share and achieved penetration rates of over 60% within the retail subscribers of PT, changing the main source of revenues to pay-tv services over broadband.
But, as expected, such a “revolution” came at a price. MEO brand differs not only by the
20
products, PT has undertaken considerable investments, mainly to upgrade its cable network to fiber, which had a considerable impact in the EBITDA margins.
Furthermore, the Brazilian market is substantially different from the Portuguese. The first noteworthy difference is that the number of free channels is considerably higher in Brazil. Additionally, the regulation in the matter of content is far less severe. The number of free channels varies from zone to zone, but seldom are offered less than five free channels. Moreover, less content exclusivity constraints entail more competition to offer more attractive products, which leads to a smaller niche market for diversification. Secondly, the penetration rates for pay-tv services were already high at the inception of MEO brand, which reflects significant cultural differences on how are perceived these products. Pay-tv services are gaining momentum in Brazil with the penetration having more than doubled since 2007, but this growth is being absorbed mostly by satellite operators (70%), and being that both Oi pay-tv services and the MEO products are
offered through cable, these developments aren’t exactly amazingly propitious.
In terms of cable network PT has currently offers the products through fiber
(best-in-class and reaching over 45% of PT’s households) and ADSL2+. Oi in the other hand has
a rather old cable network and although having undertaken some investments in this sense, its fiber network barely covers 10% of its households. Consequently, Oi is incapable of replicating the high quality products by which the MEO brand is characterized, as its current network delivery capacity is far short from the minimum requirements28 to deliver quality TV transmissions.
In addition, the expected initial impact of a possible replication of MEO in Brazil is
28
21
highly unlikely to reach the same values as in Portugal, which can be explained by the fact that not only Oi already disposes of some bundled offers and its access to content is at par with its competitors, plus the previously mentioned issues.
Summing up, if we take into account all the restraints it is extremely unlikely that Oi will be able to replicate MEO, at least in the short-medium term and dependent on considerable investments, and even in the possibility of being able, the value-add potential is considerable smaller. Still, although the scenario of replicating the MEO brand is mostly “out-of-the-table”, Oi can still greatly benefit from the “know-how” of
PT and accordingly improve its content offers in both terms of attractiveness and quality, as well as value-add services such as customizable content, pay-per-view, between others, which may represent potential upsides in revenues without involving significant extra costs.
Valuation Methodology & Cost of Capital
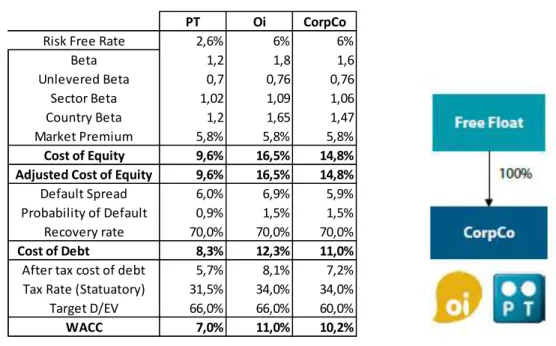
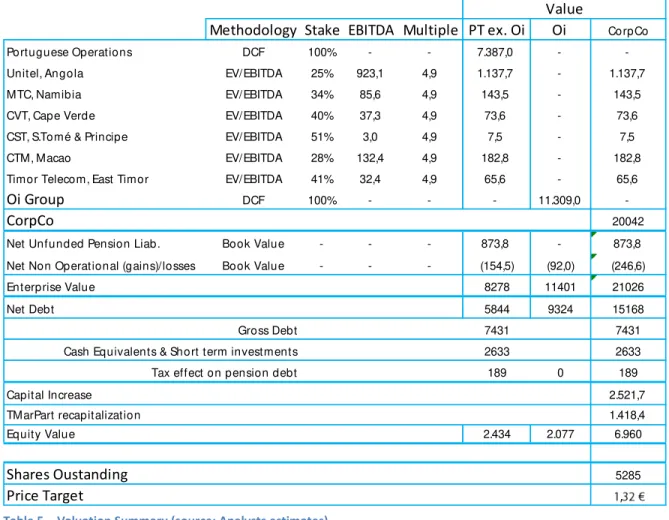
In order to value the company resultant from PT and Oi merger, CorpCo, we have used the sum of the parts (SoP) methodology. The techniques employed for this methodology were a mix considering the specifications of each unit, but for the main segments, that is PT and Oi and consequently CorpCo, we have employed the Discounted Cash Flows (DCF) methodology.. A summary of the results can be found into Exhibit 1.
22
from the Portuguese risk free rate, and for CorpCo we assumed the same risk free rate of Oi since the new company will be headquartered in Brazil. The beta calculations were done by taking the unlevered betas29 and country betas for both Oi and PT, and after re-levering them we achieved a value of 1.8 and 1.2 respectively. For CorpCo we did a weighted average of Oi and PT for both betas (country and unlevered) based on the Enterprise value of each one, achieving a value of 1.6. The risk premium was calculated trough Damodaran, achieving a value of 5.8%.
For the cost of debt we used the default spread and recovery rates for similar companies and probably of default taken from Moody’s data tables, achieving a cost of debt of 5.7% for PT, 8.1% for Oi and 7.2% for CorpCo.
Finally we considered a target Debt-to-Capital of 66% for Oi and PT and 60% for CorpCo, in order to account for the unlevering objective defined for the new company.
The deal structure
The merger between Portugal Telecom and Oi is a natural evolution of the strategic partnership established in 2010 between the two companies and is scheduled to be completed in the second half of 2014. This project is underlying in three main objectives that are expected to generate synergies for both companies, being the (1) Simplification of the shareholder structure trough the integration of both companies into a single entity, (2) fastening of operational gains and (3) Unleverage of the financial structure.
As explained previously in this report, even post the industrial alliance in 2010, the shareholder structure of Oi remained complex (although less), but this new corporate
29
23
action will highly simplify it, being that the transition will involve the unification of PT SGPS, TPart, AG Tel., LF Tel. and Oi S.A. into one single entity, as shown in Exhibit 2, and it will be listed into NYSE Euronext and NYSE.
PT and Oi shareholders will exchange their shares by a fixed swap ratio, namely 0.633 for PT and 1 for ON shares and 0.9211 for PN shares for Oi30.
Additionally, PT will exchange its assets, estimated in 2.2911€ per share, for CorpCo shares at the same price of the capital increase31. The capital increase uncertainty raises several problems. To start with, the price for it is not yet established, and so the new shares to be issued are not yet determined, and consequently the share price for CorpCo is highly dependent on the assumptions done for the capital increase’ price. Moreover, the deal still waits for the shareholder approval and they have showed the intent of blocking the deal, if the stake to be held for both companies isn’t between certain
intervals. PT shareholders are very likely to disapprove if the stake to be held in CorpCo is anything less than 36.6% and Oi shareholders if PT stake is anything more than 39.6%. Hence, the capital increase price and the exchange rate, since both shares are expressed in different currencies, are crucial for the success of this merger.
We estimated that if the capital increase takes place at the current price for ON shares32, 3.87BRL, and the target increase of 8b BRL is achieved, assuming the current exchange rate Euro/BRL of 3.1725, PT shareholders (ex.Oi) would account for 38.34% of CorpCo shares and Oi’s current shareholders would account for 22.55%, although the final
30
Oi has two distinct types of shares, ON, which is a Common Share granting voting rights, and PN that is a Preferred.
31 The deal involves a capital increase with a target of 8billion BRL. 32
24
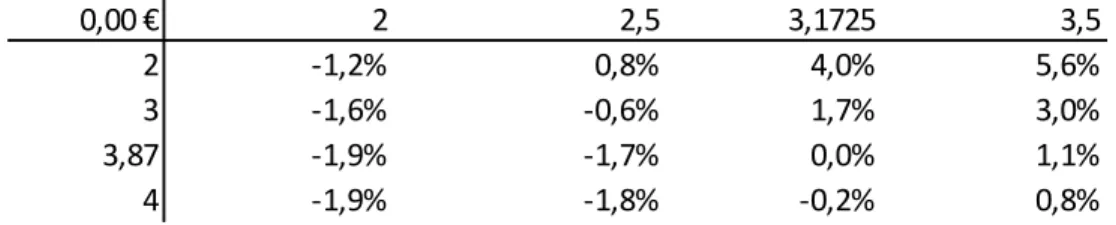
structure will be highly different since Oi shareholders have the right of preference in the new shares. Additionally, 2 out of the 8 billion capital increase will be financed by the shareholders of TPart and BTG Pactual33, accounting for a stake of 7.82%. Exhibit 3 summarizes the outcome of our estimates. Also, we have run some sensitivity analysis to see how strong was the likelihood of the deal (Exhibit 4) and we find out that changes in price are less likely to have an impact than changes in the exchange rate. We find this a risk for the transaction, as the exchange rate is at an elevated historical value, but if we consider the Brazilian exchange rate policy, major fluctuations are unlikely.
The second main point behind the merger is to fasten up the operational efficiency of Oi. The expectation is that the higher presence of PT in the decision making will fasten up especially cost reductions, being that revenues are expected to grow at a slower pace than cost reduction. Additionally, as the CEO said in a conference call, the CAPEX levels for Portugal are expected to be cut and contained, while in Brazil the expectations is inverse, CAPEX levels should increase in order to pursue growth opportunities. Finally, the third objective is to reduce the leverage of the financial structure. The capital increase and the focus on deleveraging are expected to strengthen the cash flows and increase the financial stability. Moreover, the capital increase will be partially used to repay the most expensive debt, being that the company will then have less interest expenses while also take advantage of its size to pay less for future debt.
Synergies and M&A environment
The merger between the two companies comes at a time when the Brazilian market is
33 BTG Pactual entered the shareholder structure of Oi in order to enable the merger after the veto of the
25
ongoing rapid consolidation through M&A activity in order to capture the highest market share before the market starts to stagnate and reaches maturity. Still, although the strive for consolidation, synergies evidence seems to be lacking. Vivo merger with Telesp and Brasil Telecom acquisition by Telemar reflect this reality. On the other hand, these corporate actions involved a significant increase in scale, thus confirming that the biggest motivation for consolidation is in fact to capture market share while the market is booming. Our analysis took this into account, and as such we tried to remain highly conservative while projecting the outcome of the merger in order to reach a valuation that is not too stretched.
Saying this, our valuation tries to answer to two fundamental questions:
What advantages does the merger bring that couldn’t be achieved through the
previous industrial alliance?
To whom is the merger most beneficial?
26
reductions in Oi will be most likely achieved through a better allocation of resources34 since Oi is expanding in scale and staff reduction don’t make much sense in this reality. On the other division of EBITDA, revenues, we do not expect that this merger brings much to the table. To begin with, there are several constraints to increase the revenues growth, including the lack of capacity to replicate the MEO brand as explained before, and contrarily to cost reductions, which can be implemented faster, there are few or none benefits that the merger could bring to the table that couldn’t be achieved through the
industrial alliance. Nonetheless, we estimate a modest increase in the revenues growth rates (of 15%) to reflect the best practices that may be implemented with PT management having a higher relevance in the decision making process.
One of the major differences resultant from this merger will be the CAPEX levels. As a single entity, Oi and PT are expected to direct more effort into improving their position in Brazil (for all the above mentioned reasons), and the pressure to upgrade their network takes a big relevance as it would undermine considerably their ability to compete with their peers. As such, we expect the CAPEX levels to increase substantially, with the particularity that PT CAPEX levels should be contained in order to direct more capital to Brazil. Consequently, we have estimated that operational cash flows gains should amount to roughly 1.105 billion euros NPV in 2017, although there were significant OPEX savings. Moreover, considering the nature of these investments, it is expected that they long to materialize, thus its main impact resides in the fact that CorpCo terminal growth rate is higher than what would be the average of the two sole
27
companies.
The valuation was also done under the assumption that the merger will have no real impact in the Portuguese operations. We assumed this taking in account that the whole objective of this merger is to increase the value of the Brazilian operations, and since PT is already a cost-effective company operating in a mature market, no changes should occur from the strategy pursued under the industrial alliance. The summary of the outcome can be found in Exhibit 6.
The valuation of the combined entity, CorpCo, yielded an enterprise value (EV) of 21.026 billion euros, which compared to the sum of the individual companies, Oi
(11401€b) and PT (8278€b), translates into total synergies of 1.346 billion euros NPV.
The valuation was done using terminal growth rates of 0% for PT, 0.5% for Oi and 0.5% for CorpCo, in order to translate the realities of each company under a conservative approach. We also run sensitivity analysis for these variables, and estimate that the total synergies should fluctuate between 10.5b € and -6.3b €, being the average value for synergies of roughly 2b € (above our analysis).
The synergies will materialize right off in 2014, although only achieving noteworthy values in 2016 (by the time the cost reductions are completed), although most of them reside in the continuing value.
On the other hand, these synergies are mostly a consequence from the projected capital increase that will be used to repay debt and improve cash flows, which if we exclude the recapitalization of Oi’s holdings, will net to roughly 1.1 billion euros, meaning that the
effective synergies are minimal.
28
comparables, we find that there may be concealed synergies and room for greater upsides. Our analysis yield a pro-forma EV/EBITDA multiple of 4.39 (Exhibit 7), which is slightly lesser than similar deals in Brazil, i.e., Vivo and TIM, with multiples of 4.6 and 4.5 respectively. The gap gets even wider when we compare with other deals, with a median multiple of 5.51. On the other hand, the gap gets smaller if we compare EV/Sales multiple of CorpCo, 1.54, to the one of its peers (deal wise), 1.86, leading to the conclusion that CorpCo is expected to be more efficient than its peers.
Finally, and to answer the last question, we estimated the target price resultant from the merger, accordingly to the assumptions that were previously explained. Our valuation reached an equity value of 6.960 billion euros, or 1.32€ per share. Taking into account the swap ratios and the dividend equivalent (in the case of PT shareholders), the merger would result into PT shareholders having practically no upside (0.0046%) and Oi shareholders having an upside of roughly 8%, meaning that Oi shares are currently undervalued.
To conclude, we run some sensitivity analysis to determine how the upsides would vary in consequence of changes in either the exchange rate or price of the capital increase (Exhibit 8). We reached the conclusion that the transaction should be completed with a total share amount between 8.4billion shares and 3.7billion shares (Exhibit 9), with correspondent prices of 0.82€ and 1.89€ per share. Furthermore, we run a similar
29 References
A) Books
DePamphilis, Donald M. 2010. Mergers, Acquisitions, and Other Restructuring Activities. Los Angeles: Elsevier
Tim Koller, Marc Goedhart and David Wessels. 2010. Valuation: measuring and managing the value of companies.Hoboken: John Wiley & Sons, Inc.
David Frykman and Jakob Tolleryd. 2003. Corporate Valuation: An Easy Guide to Measuring Value. Great Britain: Pearson Education
B) Datasets (accessed September – December 2013) Bloomberg
Portugal Telecom. 2013. Portugal Telecom. www.telecom.pt
Oi S.A. 2013. Oi. ri.oi.com.br/
ANATEL. 2013. ANATEL. http://www.anatel.gov.br/
ANACOM. 2013. ANACOM.http://www.anacom.pt/
TELECO. 2013. TELECO. http://www.teleco.com.br/
World Economic Outlook Databases. 2013. International Monetary Fund.
http://www.imf.org
Data. 2013. Damodaran Online. http://people.stern.nyu.edu/
Telecommunications Statistic Data. 2013. INE. http://www.ine.pt/
Corporate Default and Recovery Rates, 1920-2010. 2013. Moody’s.
https://www.moodys.com/
C) Articles (accessed September – December 2013)
Prince, Jeffrey. 2013. “The Dynamic Effects of Triple Play Bundlingin Telecommunications” Winter 2012 http://www.twcresearchprogram.com/
30
Advanced Merger Model – Quick Reference Common Formulas & Model Setup. 2013. BreakingIntoWallStreet. https://breakingintowallstreet.com/
Brito, Ana. 2013. “Estratégia da PT Oi para Portugal será compensar perda de receita com corte de custos e de investimento.”. Público. http://www.publico.pt/
D) Equity Research and Reports on Oi an PT (accessed September – December 2013) Oliveira, Pedro. 2013. Portugal Telecom equity research. BPI
Delgado, Alexandra. 2013. Telecoms. Millenium Investment Banking
Andre Baggio and Marcelo Santos. 2013. Latin America Equity Research. J.P. Morgan Andre Baggio, Daniel Morris and Marcelo Santos. 2013. Europe Equity Research. J.P. Morgan
Baecque, Karim de. 2013. Europe Equity Research. J.P. Morgan
31 Appendices
Exhibit 1) Exhibit 2)
PT Oi CorpCo
2,6% 6% 6%
1,2 1,8 1,6
0,7 0,76 0,76
1,02 1,09 1,06
1,2 1,65 1,47
5,8% 5,8% 5,8%
9,6% 16,5% 14,8%
9,6% 16,5% 14,8%
6,0% 6,9% 5,9%
0,9% 1,5% 1,5%
70,0% 70,0% 70,0%
Cost of Debt 8,3% 12,3% 11,0%
5,7% 8,1% 7,2%
31,5% 34,0% 34,0% 66,0% 66,0% 60,0%
7,0% 11,0% 10,2%
Country Beta
Cost of Equity Market Premium
Unlevered Beta
WACC Beta Risk Free Rate
Sector Beta
Tax Rate (Statuatory) Target D/EV Adjusted Cost of Equity
Default Spread Probability of Default
Recovery rate
After tax cost of debt
Table 1 -WACC summary table (source: analyst estimates) Figure 1 - Oi Structure after Transaction (source: Company reports)
32 Shares Outstanding Sw ap Ratios Total
ON 599 1,00 599
PN 1198 0,921 1103,5
1702,6
807 0,633 510,7
1191,8
BRL Euros
3,87 1,220
8000 2522 Total shares
2067,2 2067,2 3769,7
Shares Breakdow n Oustanding Stake
1192 22,55%
2026 38,34%
1654 31,29%
413 7,82%
5285,2 1 0 0 %
The new Shareholder Structure - Pre Capital Increase
New shares from capital increase Capital Increase in cash
CorpCo Total
CorpCo from PT shareholders
CorpCo from Oi shareholders
Capital Increase Price
Shares Resultant from Capital Increase PT Shareholders
Total Oi Shareholes Oi Shares to be Converted
TPart and BTG Pactual
Table 2 - The new Shareholder structure - Pre Capital Increase (source: Analysts estimates)
Exhibit 4)
0,4 2 3 3,87 4 5 6 7
2,4 34,5% 34,0% 33,7% 33,7% 33,4% 33,1% 32,9%
2,9 38,1% 37,3% 36,8% 36,7% 36,2% 35,7% 35,4%
3 38,7% 37,9% 37,4% 37,3% 36,7% 36,2% 35,8%
3,1725 39,9% 39,0% 38,3% 38,2% 37,6% 37,1% 36,6%
3,5 41,9% 40,9% 40,1% 40,0% 39,3% 38,6% 38,1%
Table 3 - PT stake after transaction w/ Changes in Price and exchange rate (source: Analysts estimates)
Exhibit 5)
EBITDA Margins 2013 2014 2015 2016 2017
PT 44,40% 44,40% 44,90% 45,40% 45,01%
Oi 34,47% 31,50% 32,07% 32,24% 32,50%
CorpCo 37,28% 41,06% 42,90% 44,60% 45,40%
Portugal 44,40% 44,12% 44,50% 45,01% 45,01%
Brazil 35,54% 40,35% 42,53% 44,51% 45,49%
33
Exhibit 6)
Exhibit 7)
Vivo TIM Peers
EV/ EBITDA 4,6 4,5 5,51
EV/ Sales 1,86
4,39 1,54
Comparables Multiples CorpCo
Table 6 - Transaction Multiples Comparison (source: Analysts estimates)
Exhibit 8)
Methodology Stake EBITDA Multiple PT ex. Oi Oi
Portuguese Operations DCF 100% - - 7.387,0 -
Unitel, Angola EV/EBITDA 25% 923,1 4,9 1.137,7 -
MTC, Namibia EV/EBITDA 34% 85,6 4,9 143,5 -
CVT, Cape Verde EV/EBITDA 40% 37,3 4,9 73,6 -
CST, S.Tomé & Principe EV/EBITDA 51% 3,0 4,9 7,5 -
CTM, Macao EV/EBITDA 28% 132,4 4,9 182,8 -
Timor Telecom, East Timor EV/EBITDA 41% 32,4 4,9 65,6 -
Oi Group DCF 100% - - - 11.309,0
CorpCo
Net Unfunded Pension Liab. Book Value - - - 873,8 -
Net Non Operational (gains)/losses Book Value - - - (154,5) (92,0)
Enterprise Value 8278 11401
Net Debt 5844 9324
7431 2633
189 0
Capital Increase TMarPart recapitalization
Equity Value 2.434 2.077
Shares Oustanding Price Target
Cash Equivalents & Short term investments Tax effect on pension debt
Gross Debt 7431
2633 189 20042 873,8 (246,6) 73,6 7,5 182,8 65,6 - Value CorpCo - 1.137,7 143,5 5285 21026 15168 2.521,7 1.418,4 6.960
34
0,00 € 2 2,5 3,1725 3,5
2 -1,2% 0,8% 4,0% 5,6%
3 -1,6% -0,6% 1,7% 3,0%
3,87 -1,9% -1,7% 0,0% 1,1%
4 -1,9% -1,8% -0,2% 0,8%
Table 7 - PT upside w/ changes in exchange rate & Price (source: Analysts estimates)
8,0% 2 2,5 3,1725 3,5
2 -42,2% -38,4% -33,9% -32,0%
3 -22,1% -16,5% -9,8% -6,8%
3,87 -7,7% -0,6% 8,0% 11,8%
4 -5,7% 1,6% 10,4% 14,3%
Table 8 - Oi (ON) upside w/ changes in exchange rate & Price (source: Analysts estimates)
7,8% 2 2,5 3,1725 3,5
2 -42,3% -38,5% -34,0% -32,1%
3 -22,3% -16,6% -9,9% -6,9%
3,87 -7,8% -0,7% 7,8% 11,6%
4 -5,9% 1,4% 10,2% 14,1%
Table 9 - Oi (PN) upside w/ changes in exchange rate & Price (source: Analysts estimates)
Exhibit 9)
5285,2 2 3 3,87 4 5 6 7
2,4 7920,9 5848,1 4916,2 4811,7 4189,9 3775,3 3479,2
2,9 8383,0 6156,2 5155,0 5042,8 4374,7 3929,4 3611,3
3 8475,5 6217,8 5202,8 5089,0 4411,7 3960,2 3637,7
3,1725 8634,9 6324,1 5285,2 5168,7 4475,5 4013,3 3683,2
3,5 8937,6 6525,9 5441,6 5320,1 4596,6 4114,2 3769,7
35 Other Appendices
Fixed Line Penetration rates 2002 2003 2004 2005 2006 2007 2008 2009
Germany 65,3% 65,9% 66,2% 66,5% 66,0% 64,5% 62,1% 59,3%
Sweden 62,6% 61,7% 63,1% 62,2% 60,9% 60,1% 58,1% 55,7%
France 57,0% 56,3% 55,6% 55,2% 55,6% 56,4% 56,6% 56,9%
United Kingdom 58,5% 57,9% 57,7% 56,5% 55,9% 54,9% 54,3% 52,2%
Greece 57,2% 57,2% 57,5% 57,0% 55,7% 49,2% 47,2% 47,0%
Ireland 50,1% 48,6% 49,1% 49,0% 51,0% 51,9% 49,6% 46,1%
Denmark 68,9% 67,1% 64,6% 61,8% 57,0% 51,9% 45,6% 37,7%
Spain 42,8% 42,4% 42,2% 45,2% 45,6% 45,8% 46,3% 45,3%
Netherlands 49,9% 48,5% 48,4% 46,6% 45,5% 45,0% 44,3% 44,1%
Belgium 48,0% 47,3% 46,3% 46,0% 45,1% 46,0% 44,7% 43,5%
Portugal 42,0% 41,1% 40,4% 40,1% 40,0% 39,5% 38,5% 39,7%
Italy 47,1% 45,9% 44,5% 42,7% 45,6% 37,8% 37,0% 36,2%
UE 27 45,5% 44,6% 44,0% 43,3% 42,5% 41,6% 41,1% 40,1%
Source: UIT, INE, ICP-ANACOM Unit: Accesses per 100 inhabitants
Annex 1 -Fixed Line Penetration Rates
2004 2005 2006 2007 2008 2009 2010
Subscribers/Households 32% 33% 34% 35% 40% 44% 49%
Fonte/Source: ICP-ANACOM
Annex 2 - Penetration Rates Pay-Tv
2004 2005 2006 2007 2008 2009 2010
Netherlands 53,0 61,0 66,0 67,0 73,0 76,0
Sweden 52,0 57,0 61,0 58,0 69,0 73,0 76,0
Denmark 53,0 57,0 65,0 66,0 71,0 72,0 76,0
United Kingdom 29,0 34,0 39,0 48,0 53,0 60,0 66,0
France 26,0 41,0 47,0 50,0 62,0
Germany 30,0 34,0 40,0 46,0 51,0 55,0 60,0
Italy 24,0 27,0 29,0 31,0 35,0 40,0 46,0
Spain 18,0 21,0 25,0 30,0 34,0 39,0 44,0
Poland 12,0 17,0 22,0 27,0 32,0 39,0 42,0
Czech Republic 10,0 10,0 24,0 30,0 34,0 38,0
Portugal 16,0 19,0 22,0 27,0 29,0 33,0 38,0
Greece 9,0 11,0 13,0 19,0 23,0 27,0 31,0
EU 27 22,6 29,6 33,4 38,3 43,0 47,9 52,4
Fonte/Source: ICP-ANACOM
36
2008 2009 2010 2011 2012 1T13 2T13
PT Group 68,5% 63,6% 60,2% 58,4% 57,2% 57,1% 56,9%
PT Comunicações 67,9% 62,8% 59,3% 57,4% 57,1% 57,1% 56,9%
PT Prime 0,4% 0,6% 0,8% 1,0%
TMN 0,2% 0,1% 0,1% 0,1% 0,1% 0,1% 0,1%
ZON 4,3% 10,6% 14,8% 17,4% 19,7% 20,1% 20,3%
Optimus/Sonaecom 14,1% 14,3% 12,9% 12,5% 11,7% 11,4% 11,4%
Alternative Providers 13,1% 11,6% 12,1% 11,7% 11,4% 11,3% 11,4%
Cabovisão 6,4% 5,7% 5,8% 5,7% 5,4% 5,3% 5,1%
Vodafone 2,9% 3,8% 4,2% 4,4% 4,7% 4,8% 5,0%
ONITELECOM 1,2% 1,0% 1,0% 0,8% 0,7% 0,7% 0,7%
Colt Telecom 0,1% 0,1% 0,1% 0,2% 0,2% 0,2% 0,2%
AR Telecom 0,8% 0,8% 0,7% 0,2% 0,1% 0,1% 0,1%
Other 1,6% 0,1% 0,3% 0,4% 0,2% 0,2% 0,2%
Annex 4 - Market Share Fixed Line
37
Thousands 2008 2009 2010 2011 2012
Oi 3.822 4.211 4.354 4.936 5.696
Net 2.217 2.882 3.524 4.193 5.402
Telefônica/Vivo 2.555 2.636 3.317 3.631 3.733
GVT 455 669 1.095 1.663 2.157
CTBC 213 203 239 276 327
Embratel - - - 426 225
Others 748 779 1.270 1.216 1.436
Total 10.010 11.380 13.799 16.342 18.976
Annex 6 - Market Share Fixed Broadband Brazil
Thousands 1T12 2T12 3T12 4T12 1T13 2T13 3T13
Net 216 453 258 283 281 34 283
GVT 136 142 200 16 67 98 193
Oi 213 183 224 140 159 56 48
Telefônica/Vivo 54 32 37 -21 20 84 46
CTBC 35 15 2 8 1 29 6
Embratel -13 -1 -146 -42 1 1 -39
TIM 1 -1 2 -6 12 10 9
Others 22 122 152 -73 197 222 88
Total 665 945 729 305 739 534 634
Annex 7 - Net Additions Fixed Broadband
2010 2011 2012 1T13 2T13 3T13
NET/Embratel 54,60% 54,90% 52,50% 52,30% 52,90% 53,00%
SKY 26,10% 29,80% 31,20% 31,30% 30,40% 30,20%
Telefônica 6,50% 5,40% 3,70% 3,30% 3,00% 3,20%
Oi TV 4,10% 2,80% 4,60% 5,00% 5,30% 5,20%
GVT - 0,30% 2,60% 2,90% 3,10% 3,40% CTBC 0,80% 0,70% 0,70% 0,70% 0,70% 0,70% ViaCabo 0,90% 0,80% 0,90% 0,90% 0,90% 0,90%
Sercomtel 0,30% 0,20% 0,10% 0,10% 0,10% 0,10%
Others 6,60% 5,10% 3,60% 3,50% 3,40% 3,30%
Total 9.769 12.744 16.189 16.809 16.974 17.407
NET 43,10% 37,00% 33,10% 32,80% 33,10% 33,00%
EMBRATEL 11,60% 17,90% 19,40% 19,50% 19,80% 20,00%
38
2010 2011 2012
Oi 47,6% 44,1% 42,2%
Telefônica 26,9% 25,5% 23,9%
Embratel 16,8% 19,5% 21,7%
GVT 5,0% 6,9% 8,1%
CTBC 1,7% 1,7% 1,8%
TIM 1,0% 1,2% 1,5%
Others 1,1% 1,0% 0,8%
Annex 9 - Fixed Line Market Share
Portuguese Operations 2012 2013 2014 2015 2016 2017
EBIT 519,6 449,2 436,4 448,2 504,4 529,5
Adjusted Taxes 129,9 141,5 137,5 141,2 158,9 166,8
389,7 307,7 298,9 307,0 345,5 362,7
Capital Expenditures 555,5 489,1 432,8 353,5 348,8 352,4
Changes in Net Working Capital 182,2 20 20 20 20 20,0
Depreciation & Amortization 681,2 660,2 630,1 610,1 572,1 549,2
(56,5) 151,0 177,3 236,7 203,4 176,9
333,2 458,7 476,2 543,7 548,9 539,6
Discount Factor 1,0 0,9 0,9 0,8 0,7
Discounted Cash Flow 458,7 440,2 464,6 433,6 394,1
Oi group 2012 2013 2014 2015 2016 2017
EBIT 1.763,0 1.502,3 1.615,1 1.541,2 1.486,4 1.488,5
Adjusted Taxes 599,4 510,8 549,1 524,0 505,4 506,1
1.163,6 991,5 1.066,0 1.017,2 981,0 982,4
Capital Expenditures 2.435,3 2.226,0 2.226,0 2.782,5 2.121,8 2.121,8
Changes in Net Working Capital 1.348,6 247,1 1,0 2,0 1,0 -
Depreciation & Amortization 1.808,6 2.133,6 2.133,6 2.297,6 2.456,1 2.454,0
(1.975,2) (339,5) (93,4) (486,9) 333,4 332,2
-811,6 652,1 972,6 530,3 1.314,4 1.314,7
Discount Factor - 1,0 0,9 0,8 0,7 0,7
Discounted Cash Flow - 652,1 876,6 430,8 962,4 867,6
Free Cash Flow
Cash Flows
Noplat
Investing Cash Flow Free Cash Flow
Noplat
Investing Cash Flow
39
CorpCo 2013 2014 2015 2016 2017
EBIT 1.951,6 2.471,1 2.571,6 2.687,2 2.814,6
Adjusted Taxes 663,5 840,2 874,4 913,7 957,0
1.288,0 1.631,0 1.697,3 1.773,6 1.857,6 Capital Expenditures 2.715,2 2.843,7 3.466,8 2.854,0 2.915,2
Changes in Net Working Capital 267,1 21,0 22,0 21,0 20,0
Depreciation & Amortization 2.793,8 2.763,7 2.907,7 3.134,5 3.234,2
(188,5) (100,9) (581,1) 259,6 299,0
1.099,6 1.530,0 1.116,2 2.033,2 2.156,6
Discount Factor 1,0 0,9 0,8 0,7 0,7
Discounted Cash Flow 1.099,6 1.387,9 918,4 1.517,4 1.460,0
Cash Flows
Noplat
Investing Cash Flow Free Cash Flow
Annex 11 - Cash Flow CorpCo
EV
PT 5.195,8 0,68 7.387,0 PT 0,0%
Oi 7.519,6 0,59 11.309,0 Oi 0,5%
CorpCo 13.658,9 0,61 20.042,1 CorpCo 0,5%
Terminal Growth Rate Discount factor
Continuing Value
Annex 12 - EV and Continuing Value
2013 2014 2015 2016 2017 Continuing Value
Synergies (11,2) 71,0 23,0 121,5 198,4 943,5
Accumulated (11,2) 59,8 82,8 204,3 402,6 1.346,1
40 PT EV
7.387,0 0% 0,5% 1% 1,5%
6% 8.262,5 8.847,5 9.549,6 10.407,6 7% 7.387,0 7.814,0 8.312,0 8.900,4 8% 6.744,6 7.072,5 7.447,2 7.879,5 9% 6.238,7 6.498,2 6.790,2 7.121,1
Oi EV
11.309,0 0% 0,5% 1% 1,5%
9% 12.477,6 13.034,7 13.661,4 14.371,6 10% 11.608,8 12.061,5 12.564,5 13.126,7 11% 10.930,0 11.309,0 11.726,2 12.187,4 12% 10.305,5 10.622,9 10.969,0 11.348,1
CorpCo EV
20.042,1 0% 0,5% 1% 1,5%
8% 22.937,1 24.129,0 25.491,2 27.062,9 9% 21.097,8 22.041,3 23.102,7 24.305,6 10% 19.310,8 20.042,1 20.852,5 21.755,6 11% 18.422,4 19.058,8 19.758,8 20.532,4
Max Median Minimum
Synergies 10.518,6 2.020,2 -6.356,8