THIS REPORT WAS PREPARED BY FRANCISCO MARTINS, A MASTERS IN FINANCE STUDENT OF THE NOVA SCHOOL OF BUSINESS AND ECONOMICS, EXCLUSIVELY FOR ACADEMIC PURPOSES. THIS REPORT WAS SUPERVISED BY ROSÁRIO ANDRÉ WHO REVIEWED THE
VALUATION METHODOLOGY AND THE FINANCIAL MODEL. (SEE DISCLOSURES AND DISCLAIMERS AT END OF DOCUMENT)
See more information at WWW.NOVASBE.PT Page 1/38
M
ASTERS IN
F
INANCE
E
QUITY
R
ESEARCH
We recommend buying Portugal Telecom given our FY12 price target of 4.87€ per share, corresponding to an overall upside potential of 21% compared to current price levels.
Despite a hazy economic climate (-3% GDP growth in 2012), domestic operations in the residential segment have shown to be extremely resilient and we expect this to continue moving forward, with PT being only moderately harmed. The massive investment in fibber rollout, about 320M€, should not yield significant results in the short term, but once the economy is back on track, PT’s superior network should become an important differentiation factor, all the while the market continues to evolve to a bundled-offer dominated market.
Domestic mobile will stop growing for now as a result of the economic downturn, the rise of tribal plans and adverse regulation. Domestic enterprise is the most affected segment, as a natural result of the economic cycle and of austerity measures. Oi’s turnaround plan, in a climate of economic growth (2% GDP growth in 2012), will yield significant improvements in terms of efficiency, revenues and governance, despite stiff competition and the required high levels of investment.
Leverage (80% D/EV in market values) will remain high, but will fall slightly through lower dividends, lower CAPEX, use of excess cash and divestment of international non-core assets. Company description
Portugal Telecom is the leading telecommunications operator in Portugal, with presence in the fixed line, broadband, pay TV, mobile and corporate segments. It is also present in the growing Brazilian market, through a stake in Oi and a minor one in Contax, in addition to several other countries in Africa and Asia.
PORTUGAL
TELECOM
C
OMPANY
R
EPORT
TELECOM
17
NOVEMBER2011
S
TUDENT
:
FRANCISCO
MARTINS
[email protected]
It Keeps Holding On
A History of Survival in a Hostile Environment
Recommendation: BUY
Price Target FY12: 4.87 €
Price (as of 7-Jan-13) 3.87 €
Reuters: Bloomberg
52-week range (€) 3.00-4.44
Market Cap (€m) 3,470,40
Outstanding Shares (m) 896.51
Source: Bloomberg
Source: Bloomberg
(Values in € millions) 2011 2012E 2013E Revenues 6.146 6.747 6.479
EBITDA 2.188 2.335 2.2213
EBIT 744 811 709
Net Profit 423 405 446
EPS 0.47 0.45 0.50
EV/Sales 0.52 0.48 0.50
EV/EBITDA 1.47 1.37 1.45
Net Debt/EV 77% 64% 63%
ROIC 9.2% 7.6%
Source: Analyst Estimates, Company Reports -4%
-3% -2% -1% 0% 1% 2% 3% 4%
PORTUGAL TELECOM COMPANY REPORT
PAGE 2/38
Table of Contents
COMPANY OVERVIEW ... 3
VALUATION METHODOLOGY ... 4
PORTUGAL BUSINESS ... 5
THE RESIDENTIAL BUSINESS – A CASE OF RESILIENCE ... 6
THE PERSONAL BUSINESS – UN AVOIDABLE DOWNTURN ... 14
ENTERPRISE – WHERE IT HURTS THE MOST ... 17
COST MARGINS AND INVESTMENTS ... 18
OI BUSINESS ...20
OI TURNAROUND PLAN – A STEP IN THE RIGHT DIRECTION ... 20
THE RESIDENTIAL BUSINESS – A ROCK-BOTTOM START ... 22
PERSONAL BUSINESS: A SLOW MOVE ... 24
ENTERPRISE ... 25
FINANCIAL STRUCTURE AND COST OF CAPITAL ...26
AN ATYPICAL CAPITAL STRUCTURE ... 26
THE COST OF CAPITAL ... 27
SCENARIO ANALYSIS ...28
PORTUGAL LEAVES THE EURO ... 28
M&A ACTIVITY IN PORTUGAL ... 30
FINAL VALUATION CONSIDERATIONS ...31
APPENDIX I
–
FINANCIAL STATEMENTS ...33
APPENDIX II
–
MACROECONOMIC FORECASTS ...36
APPENDIX III
–
INTERNATIONAL COMPARABLES ...36
APPENDIX III
–
IMPACT OF LEVERAGE ON CREDIT RATING ...37
DISCLOSURES AND DISCLAIMER ...38
PORTUGAL TELECOM COMPANY REPORT
PAGE 3/38
Company Overview
Portugal Telecom (PT) is the largest Portuguese telecommunications company currently operating. Although its main source of value creation is still its domestic operations – PT Comunicações and TMN – through which the company provides services in fixed phone, fixed broadband, Pay TV, mobile phone and mobile data, PT has been diversifying its operations, currently owing stakes in Brazil, as well as various countries in Africa and Asia1. This geographical dispersion comes as a result of one of the key strategic milestones of the company, which is to have at least 2/3 of its revenues coming from international assets. The Brazilian market, in particular, has been paid great attention to. Up until 2010, PT held a 29.71% stake in Vivo, a Brazilian communications company, which has since then been sold to Telefonica. PT has however reinvested in the Brazilian market by acquiring a 25.6% stake in Oi, a communications company whose business segments are very much in line with those of PT’s own domestic operations.2
Once a Portuguese state-owned company (its last privatization was completed in 20003), the company is currently owned by a number of minority, mostly institutional shareholders, the main ones being: RS Holding4 (10.05% of total capital), Grupo Espírito Santo (10.04%), Grupo Telemar Norte Leste S.A.
(10.00%), Grupo Caixa Geral de Depósitos (6.42%), Grupo Norges Bank (4.96%) and UBS AG (4.69%). Moving forward, we do not forecast major changes in these positions. As far as Ongoing Strategy Investments is concerned, it has repeatedly stated their interest in remaining one of PT’s main shareholders5
;
Telemar Norte Leste S.A. has just acquired it stake as part of the strategic agreement between PT and Oi, and we find no reasons suggesting Norges Bank,
Grupo Espírito Santo and UBS AG to have intentions to divest. Doubts could arise concerning the future intents of Caixa Geral de Depósitos since the group is being pressured to divest; while so far there have been no movements in this direction, we remain sceptical over the group’s ability to finance further capital increases, should PT need them.
1A summary of these international stakes is presented in the next section, “Valuation Methodology”. 2
PT has also acquired a 44.4% stake at Contax, a Brazilian corporate solutions company. 3
In July 2011, with the removal of the golden shares that effectively allowed the Portuguese government to still intervene in the company by vetting its strategic decisions, all the direct influence of the Portuguese State was officially terminated, despite the fact that an indirect stake (through Caixa Geral de Depósitos, a state-owned bank) is still present. 4
RS Holding is property of Ongoing Strategy Investments. This is a Portuguese company with investments in communications, TMT, financial services, energy, infrastructures, real estate and services. On the communications side,
the company detains, beside its 10.05% stake in PT, a 3.29% stake in Zon, PT’s main competitor. This is not a unique
situation, seeing as how Grupo Espírito Santo also holds a stake in Zon.
5“This was our strategy since the beginning. We wanted to become one of the largest shareholders from PT. This is a
company with a lot of liquidity and a very attractive balance sheet. It is the kind of company from which you want to be an investor” – Nuno Vasconcelos, President of the Group, in a statement issued to Bloomberg at 03/06/2012.
Dispersed Ownership Structure
51% 39%
11%
Portugal
Brasil
Other International Assets Graph 1 - Enterprise Value Per Geography
PORTUGAL TELECOM COMPANY REPORT
PAGE 4/38
Valuation Methodology
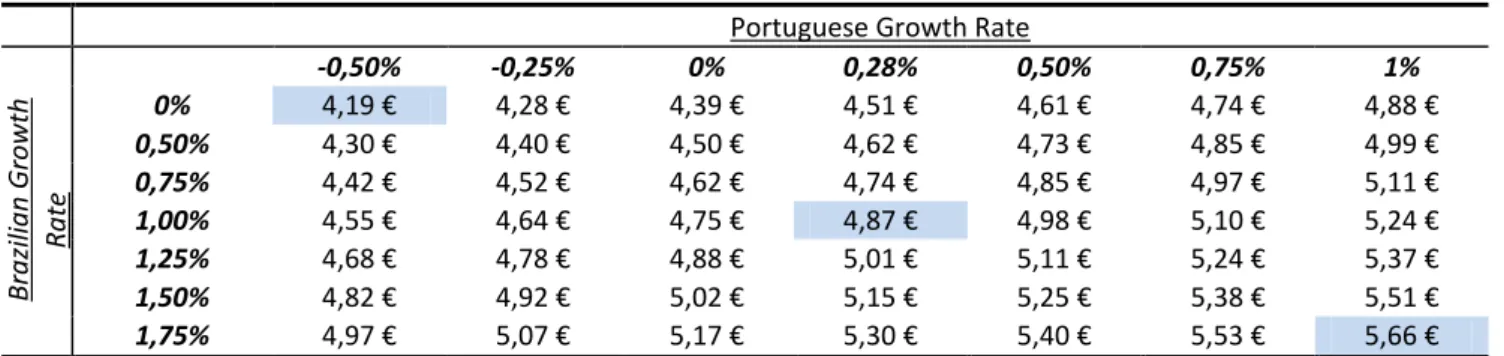
In order to value PT, we have employed a sum of parts (SOP) methodology, with various valuation techniques being utilized to account for each segment, on a relevance to availability of information basis. For the two main segments, which are the domestic operations and the stake at Oi, we have used Discounted Cash Flow (DCF) models; to value the interest in Contax, we took the company’s market value; for the company’s international assets in Africa and Asia, we have used EV/EBITDA multiples of similar companies in those geographies6; for the residual, non-operational assets of the company, the book value was used, with adjustments made when deemed fit. We have reached a price target of 4.87€, implying an upside potential of 21%. Below is a summary of our valuation7: Table 1 - Summary of Company Valuation
Method Stake Value to PT Base Scenario
Value to PT Portugal Leaves Euro
Value to PT - Zon&Sonaecom
Merger
Weighted Value
p = 50% p = 5% p = 45%
Portuguese Operations DCF 100% 7.526 2.944 7.269
Oi DCF 26% 5.084 5.084 5.084
Contax Market Cap 44% 292 292 292
Unitel, Angola EV/EBITDA 25% 1.023 1.023 1.023
MTC, Namíbia EV/EBITDA 34% 152 152 152
CVT. Cabo Verde EV/EBITDA 40% 91 91 91
CST., S. Tomé e Princípe EV/EBITDA 51% 8 8 8
CTM, Macau EV/EBITDA 28% 218 218 218
Timor Telecom, Timor-Leste EV/EBITDA 41% 58 58 58
Net Unfunded Pension Liabilities
Book Value -
-990 -990 -990
Non Operational Assets Book Value8 - 48 19 48
Enterprise Value - - 13.510 8.899 13.254
Debt Market Value - -12.768 -10.215 -12.768
Excess Cash Book Value - 3.843 3.843 3.843
Equity Value - - 4.585 2.528 4.329 4.367
# Outstanding Shares (Million)
- -
897 897 897 897
Price Target (end of 2012) - - 5,11 € 2,82 € 4,83 € 4,87 €
Current Price - - 3,87 € 3,87 € 3,87 € 3,87 €
Implied Upside Potential - - 24% -37% 20% 21%
6
Although a case could be made for an evaluation of Unitel on the basis of a DCF model, both due to its relative
importance in PT’s portfolio and due to its long term growth potential, the lack of available information would make this
task excessively reliant on analysts’ assumptions, which is why we have decided to utilize a multiples’ approach. 7
This valuation includes scenario analysis, which will be explained later in this report.
8The value of “Páginas Amarelas” business was not considered, as we believe the business is worth next to nothing
nowadays, making its book value a poor proxy for its actual worth. SOP Methodology
Portugal and Oi evaluated through DCFs
PORTUGAL TELECOM COMPANY REPORT
PAGE 5/38
Portugal Business
As stated, and despite its ever growing degree of international diversification, PT’s major source of value is still coming from its Portuguese communications operations, where its revenues are being generated essentially from four types of clients (as seen in the graph): residential (wireline products), personal (mobile products), enterprise (wireline and mobile) and wholesale (wireline and mobile). In the last few years, these markets have been shifting, to a larger or smaller extent, due to a number of trends whose effects do not seem to have ceased yet. Even though not all of these trends are connected to macroeconomic developments, and despite the resilience that we believe the communications sector has conquered throughout the years, some of what happens in the sector is still inevitably connected, in some scale, with the Portuguese economy. As such, it is important to understand what these foreseeable economic conditions are, at least for the near future.
As known, the Euro Area is currently tacking what has become known as the sovereign debt crisis. One of the most evident effects of this crisis are the recessionary measures that Governments have been implementing as a way to reduce their sovereign debt – this holds true especially for problematic countries, such as Greece, Ireland, Portugal and Spain. In Portugal, so far, these measures have involved a higher tax rate, a lower budget for government-subsidized institutions, and even a generalized cut in the public employees’ nominal wages. As a result, consumption has had a massive slowdown which, in turn, has had negative implications on companies’ results, ultimately conducting to a sustained increase in the unemployment rate, as seen in the graph. A snowball effect was then in place and, eventually, the income available for families became lower and the savings rate increased, meaning that consumption took yet another beating, as depicted in the graph. This is the effect that interests us, because when consumption is affected, so are companies, including PT.
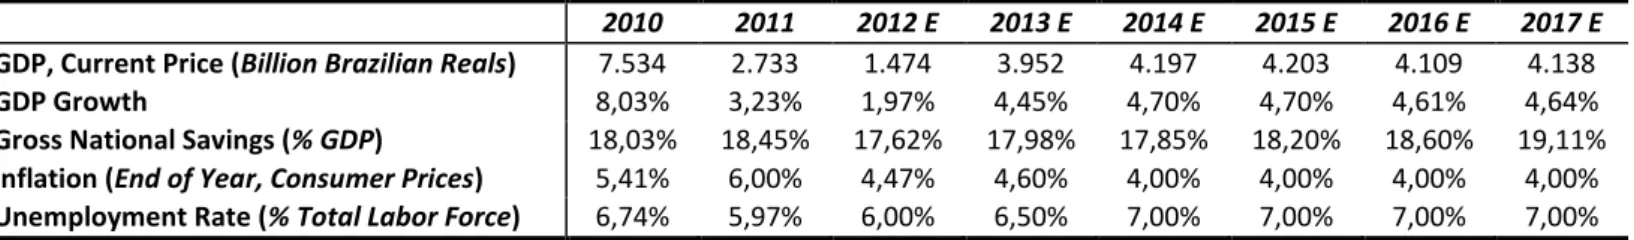
Looking at the GDP growth, shown on the left, we see that this contractionary behaviour is expect to last until at least 2013, with 2014 returning only to barely positive levels. This suggests that 2012-2014 will be the toughest ones for PT to endure as far as its domestic revenues are concerned9. For a more comprehensive analysis of the impact of these macroeconomic conditions, as well as other relevant trends on each of the company’s domestic businesses, we will dwell into each of these markets individually in the next section.
9
A more thorough macroeconomic picture for the next 5 years is presented in the Appendix, although the conclusions taken from the observation of the GDP growth alone still hold.
-3,25% -2,25% -1,25% -0,25% 0,75% 1,75%
2010 2011 2012 E
2013 E
2014 E
2015 E
2016 E
2017 E
Graph 5 - GDP Growth
Source: IMF
24%
27% 34%
16%
Residential Personal
Enteprise Wholesale Graph 2 - Domestic Business Revenues Segmentation
Source: Company Reports
Graph 3 - Unemployment Rate
00% 02% 04% 06% 08% 10% 12% 14% 16% 18%
Source: OECD
40.000 40.500 41.000 41.500 42.000 42.500 43.000 43.500 44.000
Graph 4 - Private Consumption
PORTUGAL TELECOM COMPANY REPORT
PAGE 6/38 2,0%
2,2% 2,4% 2,6% 2,8% 3,0% 3,2% 3,4%
Graph 6 - Communications Weight on Portuguese Available Income
Source: INE
The Residential Business
–
A Case of Resilience
Fixed Broadband and Pay TV
–
Some Impressive Wins
If there are markets whose perceived essentialness has changed drastically over the last 15 years, they are certainly the Pay TV and the Fixed Broadband. Initially perceived as high-end, luxurious products, the most recent behaviours of these markets, particularly in Portugal, suggest that these are now amongst the top priority sectors for a typical consumer. One way to observe this is by looking at the evolution of available income allocation during the last 15 years. As the table below and the graph on the left both illustrate, not only were communications the sector with the highest relative increase in terms of importance (32%), but it has also had one of the most relevant increases in absolute terms (0.7%), only behind housing and gas (likely related with the disproportionate increase in oil prices in the last four years) and other goods and services (a very broad group). Table 2 - Portuguese Available Income Distribution
1996 1998 2000 2002 2004 2006 2008 2010 Δ % Change
Food and Non Alcoholic Drinks 18,2% 17,4% 16,6% 17,1% 16,9% 16,4% 16,6% 16,4% -1,8% -10%
Alchool, Tobaco and Narcotics 3,8% 3,7% 3,5% 3,6% 3,6% 3,5% 2,9% 3,3% -0,6% -15%
Clothing 6,8% 6,5% 6,3% 6,5% 6,2% 6,0% 5,7% 5,8% -0,9% -14%
Housing, water, electricity, gas and other fuels 13,5% 13,3% 13,0% 13,5% 14,3% 14,3% 14,5% 15,6% 2,1% 16%
Home accessories, household equipment and
routine household maintenance 7,1% 7,1% 7,0% 6,9% 6,5% 6,4% 6,2% 6,0% -1,1% -16%
Health Care 4,6% 4,6% 4,6% 4,8% 5,0% 5,0% 5,4% 5,7% 1,1% 25%
Transportation 14,8% 15,8% 16,4% 14,8% 14,3% 14,4% 14,0% 13,7% -1,1% -7%
Communications 2,3% 2,4% 2,6% 3,2% 3,3% 3,2% 3,0% 3,0% 0,7% 32%
Recreation and Culture 8,0% 8,1% 8,3% 7,9% 7,6% 7,5% 7,2% 7,0% -1,0% -12%
Education 1,0% 1,0% 1,0% 1,1% 1,1% 1,2% 1,2% 1,3% 0,3% 29%
Restaurants and Hotes 10,8% 10,7% 10,8% 11,1% 11,0% 11,0% 10,6% 11,1% 0,4% 3%
Other Goods and Services 9,1% 9,4% 9,7% 9,6% 10,2% 11,1% 12,7% 11,0% 1,9% 21%
Moreover, even though there has been a slight decrease in the last few years, we believe this is due to declines in the voice sector (as will be developed later on), seeing as how, despite the fact that economic conditions have been worsening, the overall revenues in Portugal from fixed broadband and pay TV have actually increased, as shown in the graph on the left.
We believe this developed resilience comes from a combination of two factors. One is the ever-growing perception of usefulness and necessity associated with these services that is related with the socio-cultural changes that have altered the way we communicate with one another, both in a personal and professional context, and the way we seek entertainment in the technological world. The other one is the tariff system in place, which does not make it easy to adjust the amount on a monthly basis, as the billing is typically fixed, regardless of the actual usage rate.
Source: INE
Units: Million Euros for Revenues and Percentage for GDP Growth
Source: Analyst Estimates, Bloomberg
-4% -3% -2% -1% 0% 1% 2%
0 200 400 600 800 1000 1200 1400
2008 2009 2010 2011
Fixed Broadband Revenues
Pay TV Revenues
GDP Growth
PORTUGAL TELECOM COMPANY REPORT
PAGE 7/38 Going forward, we expect the same resilience pattern to hold for the most part, meaning that even despite the negative economic outlook we are forecasting increases in the penetration rate for both services. Apart from the overall sector resilience, we base this expectation on two important trends. The first one is the continued expected rise of bundled offers – we will dwell on this factor later on. The second one is the evolving demographics of the Portuguese population. Currently, Portugal is one of the oldest skewing OECD countries, as the first graph on the left shows. This is relevant because we are talking about a sector in which young people have a higher usage of these services (as shown in the second graph), which means that, in time, as these younger people become households themselves, penetration will tend to go up.
Moreover, if we look at the Portuguese fixed broadband penetration rate10 of 39% as of 2011 in context, we see that there is still plenty of room to grow, as the rate is considerably lower than the average OECD rate of 49%11 - the third graph on the left depicts a comparison with some of these countries. In fact, Portugal is only the 27th out of 34 OECD countries, which points towards a continued growth in the near future. As such, we forecast a 3% CAGR until 2015 and a 6% from 2015 until 2017 when economic conditions start looking up (still below the 8% verified from 2007-2011). From there onwards, we assume Portugal to be more or less aligned with its peers, so it should grow at a stable 1.5% per year, the rate at which the sector is expected to grow in OECD countries as a whole1213. As for Pay TV, the gap with the remaining OECD countries is minimal (52% for Portugal and 53% average and median for the OECD countries), and overall, we believe the acceleration in growth that this sector has witnessed in the last five years (around an 8% CAGR14) is slowing down. We assume the same growth rate expected for OECD moving forward, of 1%, meaning that Portugal should continue to be around the average OECD penetration rate1516. These forecasts can be seen in the last graph on the left and in the first graph on the next page. Nevertheless, we expect some ARPU contraction in the next few years. This is because, despite our previous argument regarding the fixed nature of tariffs paid, we still believe that there is room for some flexibility, particularly in what concerns the adoption of high-end products (premium pay TV channels, such as Sport TV, or higher internet speeds), which can be cut down in periods of greater recession. As such, although we expect customers to seek internet with higher
10
Penetration rate for wireline services defined as being # Users/ # Conventional Dwellings, unless stated otherwise. 11
Median is 49% and mode is 46%, also for 2011, for all OECD countries. 12
OECD Communications Outlook 2011 Report
13Implicitly, we are thus assuming a penetration rate of about 60% in 20 years’ time. 14
We believe the analogue switch-off, a single occurrence factor in the past explains part of this peaks in growth. 15
OECD Communications Outlook 2011 Report
16Implicitly, we are thus assuming a penetration rate of about 62% in 20 years’ time.
25% 30%
75% 70%
-20% 30% 80%
Portugal OECD Countries
% Population >30y
% Population <30y Graph 8 – 2010 Population Age
Source: OECD
0% 10% 20% 30% 40% 50% 60% 70% 80%
Graph 10 – 2011 Fixed Broadband Penetration Rate Across Countries
Source: OECD
39% 40% 41% 42% 45% 48% 48%
0% 20% 40% 60%
2011 2012 E 2013 E 2014 E 2015 E 2016 E 2017 E
Portugal Fixed Broadband Penetration
OECD Fixed Broadband Penetration
Graph 10 - Fixed Broadband Penetration
Source: Analyst Estimates, OECD
0 50 100
16-24 25-34 35-44 45-54 55-64 64-74
Graph 9 – 2011 Broadband Penetration
Source: INE, Anacom | Units:
PORTUGAL TELECOM COMPANY REPORT
PAGE 8/38 speed and TV with better quality in the medium term, we believe macro conditions will slow this down, leading to a downwards adjustment in the ARPU in the short-run for the whole sector. We do however expect to start seeing upticks in the ARPU in 2015, when economic conditions are better and consumers are ready to start taking advantage of the high-end products from PT. We also note that, as seen in the second graph on the left below, PT has generally followed Europe’s pace when it comes to the behaviour of the ARPU: it fell the exact same 13% as the median of European countries, close to Italy 15%) and France (-13%) and actually lower than Spain (-21%) although higher than countries like the UK (-4%) or Germany (-8%)17. We expect the same pattern to hold moving forward. The table below summarizes our predictions:
Table 3 - Fixed Broadband and Pay TV ARPUs18
2011 2012 E 2013 E 2014 E 2015 E 2016 E 2017 E
Fixed Broadband ARPU 38,7 € 37,6 € 36,5 € 35,5 € 36,5 € 37,6 € 38,7 € Pay TV ARPU 29,7 € 28,6 € 27,5 € 26,5 € 27,9 € 29,4 € 31,0 €
Finally, one must look at competition, which we regard as the hardest aspect to predict, due to the similar offers of the two main players, PT and Zon. Even though PT’s service may have been superior in the past, Zon has made significant progresses in the quality of its product, that is now quite similar to PT’s in terms of TV experience (image and sound quality of software, content available) and internet service (speed, number of failures per connections, network reach). Furthermore, as depicted in the graph on the left19, both companies have reached similar levels of satisfaction: as of the end of 2011, across the three wireline products, PT has a complaint rate of 0.14% whereas Zon’s is 0.19%, a minimal difference20
. Additionally, there are no major price differences between both: even though PT’s ARPU is 25% lower21 than Zon’s, this difference is mostly related with the discounts that PT gives to new clients during their first years of usage and not so much with fundamentally different pricing strategies, which is why we believe that in the long-run, both ARPUs will converge.
17
These values refer to blended ARPUs from the wireline business, including fixed line. However, we are confident that our conclusions still hold, seeing how all countries have experienced declines in the fixed line business. The percentages presented refer to the change between the second quarter of 2010 and the third quarter of 2012.
18
ARPU defined as Yearly Revenues/#End of Year Users. In this case, it includes only single-play offers, meaning that all users and revenues associated with bundled offers are not being considered.
19
Complaints Rate defined as being # Complains during the Year/ # Users during the Year 20
Although it is not possible to present data for the complaints rate for previous periods, Anacom mentions how Zon used to have a substantially higher number of complaints, especially coming from its fixed broadband business. 21
Calculation based on the bundled offers ARPUs, as they are the most directly comparable ones. Source: Analyst Estimates,
Company Reports
51% 52% 52% 52% 53% 53% 53%
0% 10% 20% 30% 40% 50% 60%
2011 2012 E2013 E2014 E2015 E2016 E2017 E
Portugal Pay TV Penetration
OECD Pay TV Penetration
Graph 11 - Pay TV Penetration
Source: Analyst Estimates, OECD Statistics
0,00% 0,05% 0,10% 0,15% 0,20% 0,25% 0,30%
Fixed Line Fixed Broadband
Pay TV
PT Zon
Graph 13 - Complaints Rate Comparison
Source: Anacom, Analyst Estimates
0 2 4 6 8 10 12 14 16 18 20
2010 Q2
2010 Q3
2010 Q4
2011 Q1
2011 Q2
2011 Q3
2011 Q4
2012 Q1
2012 Q2
2012 Q3 Portugal European Median
Graph 12 - ARPU Evolution
PORTUGAL TELECOM COMPANY REPORT
PAGE 9/38 Yet, in regards to Pay TV, we still think there is some differentiation. We expect PT to keep up the strong commercial awareness from the Meo brand22, thus leading to positive growth in its market share. Moreover, with the launch of Video on Demand (VoD) channels and special interactivity features tied with popular TV programs (Secret Story, Biggest Looser, Idols), as well as exclusive channels (Benfica TV), Meo has achieved some differentiation23. We also expect a long-term boost coming from the massive investment PT has made in fibber rollout, a superior technology than the cable technology used by Zon, as seen in the graph on the left, but we believe that the macro environment will put off the adoption of these24, leading to low impact in the short term. We thus expect market shares to remain relatively flat25, with fluctuations explained mostly by the rise of bundled offers26, which will favour Zon and PT at the expense of smaller players, such as Cabovisão, who lack these developed bundled offers. We will explain this later. All in all, we expect a slowdown in PT’s intense increase in fixed broadband and, especially, Pay TV market share, the latter of which during the last two years grew by more than 15% per year27. We thus forecast an average increase in Pay TV market share of about 3.5% per year and of about 0.65% in fixed broadband. This would mean PT would eventually reach 44% and 51% in pay TV and fixed broadband respectively, by 2016. From then onwards, we believe further increases will have to come almost exclusively from new additions to the market, so we do not expect further major changes in the market distribution
22Meo is one of the most well promoted brands in Portugal. It has won multiple “Media Effectiveness Awards” (results
based awards that look at recall, sales or other types of return that meet a previously set goal) on various years.
Additionally, the most watched ever advertising in TV in Portugal, with 3.2 million viewers and 85% share is from Meo. 23
Zon is also investing heavily on these interactive features so there is a risk that this small differentiation is soon gone. 24
According to a study carried out by Anacom, the higher the social class and the level of income, the higher the probability of adopting the FTTH technology. This shows that FTTH is, indeed, regarded as a high-end product. 25
Even though these were not constant in the past (especially in Pay TV), we believe this was due to major differences in the products, which do not exist nowadays, at least on a low-to-medium end products.
26
We also believe that, given the fact that PT’s market share in fixed broadband is now almost half of the market, there is a chance regulation will make it more difficult for PT to achieve further increases.
27
When looking at this number, we have to consider that 70% of this increase (55% for fixed broadband) came from clients that were already in the market (smaller operators mostly), an effect that cannot be maintained forever.
0% 20% 40% 60% 80% 100%
2007 2008 2009 2010 2011 2012 E 2013 E 2014 E 2015 E 2016 E 2017 E
PT Comunicações Grupo Zon/TV Cabo Cabovisão
Vodafone Optimus/Sonaecom Others 0%
20% 40% 60% 80% 100%
2007 2008 2009 2010 2011 2012 E 2013 E 2014 E 2015 E 2016 E 2017 E
PT Comunicações Grupo Zon/TV Cabo
Cabovisão Vodafone
Optimus/Sonaecom Others
Graph 15 - Fixed Broadband and Pay TV Market Shares
Source: Anacom, Analyst Estimates Graph 14 - Technhology Comparison
0 10.000 20.000 30.000 40.000 50.000 60.000 70.000 80.000 90.000 100.000
Average download speed
Average upload speed
DSL Cable FTTH
PORTUGAL TELECOM COMPANY REPORT
PAGE 10/38
Fixed Line
–
A Slowdown in Decline
The third component of the residential business is the fixed line. Unlike the previous two segments, which have been in unmistakable expansion, the fixed line segment has been contracting, as the graph on the left displays, mostly due to the fixed-mobile substitution effect. One way to observe this effect is by looking at the evolution of the number of calls made each quarter in Portugal, as depicted in the second graph on the left. In addition, unlike the previous two segments, this is a segment in which consumers can also easily control the amount that is spent, which means that the ARPU is, by definition, less resilient to economic downturns. Perhaps the most blatant illustration of this decline is the fact that, from 2010 to 2011 alone, sector revenues have fallen by a hefty 22%.
Nevertheless, there are positive trends in this market, making us expect a deceleration in the sector decline. Despite the enormous revenue declines, the number of users on the market has remained remarkably flat (4% decrease) even when economic conditions worsened, between 2010 and 2011, all the while Europe fell, in average terms, by an immense 24.4%28. This unforeseen resilience makes us confident that the number of users has found its ceiling for now and that continued decreases in the sector will come almost exclusively from losses on the ARPU level, which we expect to continue bleeding heavily until 2015, with some deceleration and even a slight recovery afterwards, as depicted in the third graph on the left. Ironically, we believe it is the aforementioned flexibility in the amount spent that is responsible both for bringing down the ARPU and, at the same time, for retaining a stable number of users, as it enables consumers to adjust their expenditures. However, even accounting for this, we would expect a steeper decline in penetration were it not for the expected rise of bundled offers, which we believe to be part of the reason why the number of users has remained so steady29.
As for competition dynamics, we believe Zon will make significant progresses on the fixed line business, precisely due to the rise of the bundled type of clients, so we are forecasting a decrease, albeit a soft one, in PT’s market share.30
In short, we expect a slowdown in the decline that fixed line revenues have experienced, even if most of the positive effects will come from bundled packages and not so much from single play offers anymore.
28
Anacom 29
PRINCE, Jeffrey, The Dynamic Effects of Triple Play Bundling in Telecommunications, Research Program on Digital Telecommunications. According to this study, bundling the prior year increases the likelihood of continuing to subscribe fixed line services from that company by 3.5%. We will dwell on the bundled offers effects in greater depth later. 30We expect Zon’s rise to be done mostly at the expense of smaller players, who lack sophisticated bundled offers. Graph 16 - Portugal Fixed Line Revenues
0 200 400 600 800 1.000 1.200
2007 2008 2009 2010 2011
Units: Million Euros| Source: Anacom
Graph 17 - # Calls in Portugal
0 5.000 10.000 15.000 20.000 25.000 30.000 35.000 40.000 1 T 0 4 4 T 0 4 3 T 0 5 2 T 0 6 1 T 0 7 4 T 0 7 3 T 0 8 2 T 0 9 1 T 1 0 4 T 1 0 3 T 1 1
Fixed Line # Calls Mobile # Calls
Units: Thousands of Calls| Source: Anacom
22,2 19,1
16,3
14,0 15,1 16,2 17,5 0 5 10 15 20 25 2011 2012 E 2013 E 2014 E 2015 E 2016 E 2017 E Graph 18 –PT’s Fixed Line ARPU
PORTUGAL TELECOM COMPANY REPORT
PAGE 11/38
The Rise of Bundled Offers
Bundled offers, the importance of which we have been mentioning throughout the report, is, in our opinion, the most important trend currently in play in the residential market. As explained by BEREC31, bundled offers have been increasing in popularity due to its attractiveness for both consumers and companies. The former, in addition to the usual perception of paying an amount that is smaller than the sum of parts they would pay otherwise32, also benefits from the receipt of a single bill from a single provider33. Companies, on the other hand, reduce their churn rate34 and have the chance to develop a stable, constant customer base, the services of whom they can attempt to gradually upgrade to more expensive products through a better marketing focus35. At the same time, costs (e.g. marketing and distribution) are diminished – economies of scale are created36 – and firms have the opportunity to engage in price differentiation strategies among different categories of customers, as offers tend to become personalized to each customer.
As of the end of 2011, there were 630 thousand and 1.5 million residential subscribers of, respectively, double play and triple play offers in Portugal; together, these amount to over one third of the total residential market in Portugal. Even more relevant, this is a number that has been on an exponential rise in the last few years, as showcased by the graph on the left. Due to the advantages stated above for both consumers and corporations, we firmly believe this is a tendency that will be continued, albeit with two caveats. The first caveat is that we expect some degree of natural bundled offer “cannibalization”, in the sense that double play offers will tend to be upgraded to triple play offers, which might distort the overall number we look at. The second caveat, and in our opinion the most important one, is that we believe this shift in the offer mix will
31
Body of European Regulators for Electronic Communications 32
According to a study presented by Anacom and conducted by E-Communications Household Survey, as of the first quarter of 2011, the perception of Portuguese households is that save about 34% by subscribing to multiple play offers (33% European Average). This value is higher than the year before value, which was 20%, suggesting an increase in the perceived advantages of bundled offers.
33
2010 E-Communications Household Survey indicates that 34% of Portuguese customers (41% European average) has decided to engage in buddle offers due to the advantages related with the payment of a single bill, thus suggesting that multiple play offers would create value for some customers even if the prices offered were not perceived as lower. 34
PRINCE, Jeffrey, The Dynamic Effects of Triple Play Bundling in Telecommunications, Research Program on Digital Telecommunications. This study shows that triple play bundling on communications indeed reduces churn rate across all three services. According to this study, bundling the prior year increases the likelihood of continuing to subscribe the services by 3.5%, 1.8% and 2.2%, for fixed line, fixed broadband and Pay TV, respectively.
35
According to a study presented by Anacom and conducted by E-Communications Household Survey, as of the first quarter of 2011, 16% of individual services contracted through bundles (the same as the European average) would not have been contracted otherwise, thus showing once again the added strength of bundled offers and why we expect these to continue to be a driving force in increasing the penetration rates of the various products.
36
BEREC, BEREC Report on Impact of Bundled Offers in Retail and Wholesale Market Definition. According to this study, cost advantages for companies engaging in multiple play offers may vary between 12% and 20%.
Bundled Offers present a number of advantages both for consumers and corporations
1,12
1,58
2,17 4,75
4,92
4,90
0 1 2 3 4 5
2009 2010 2011
Single-Play Revenes
Multiple-Play Revenues Graph 19 - Sector Residential Revenues
PORTUGAL TELECOM COMPANY REPORT
PAGE 12/38 be, to some significant extent, put off at least for the next 3 years, due to the adverse economic conditions. Even though it is true that churn rates are lower once a client signs on a bundled offer since the willingness to quit is significantly smaller, we believe that the prognosis of yet another large fixed bill during times of economic duress is likely to increase the perception of bundled offers as being a high-end product (regardless of whether that is true or not), thus shifting the adoption of these offers to after the worse years of recession.
Focusing now on PT’s own client base, as we can see in the graphs below, there is an overwhelming percentage of clients on the internet and pay TV business that are coming from triple play and multiple play as a whole. As explained, it is our belief that these are numbers that will only tend to move upwards. As for the fixed line, in which single play is still the major type of client for PT (unlike the remaining industry, as showcased in the graph on the left), we are also expecting a major increase in the percentage of multiple play clients, especially because we believe this will be the main factor in stopping the bleeding that the fixed line business had been suffering ever since the fixed-to-mobile substitution effect started, as discussed before.
As for the ARPUs of these bundled offers when paralleled with those from single offers, the comparison is not clear at the moment, meaning that in some cases PT has an ARPU higher than the sum of parts (most double play offers) whereas in others the ARPU is actually lower than the sum of parts (tripe play offers essentially). On this matter, our conviction is that, long-term, companies will be able to profit from bundled offers on an ARPU level, meaning that the tendency will be for them to go upwards. We believe PT’s present situation, with the ARPU being lower than the sum of parts in the case of triple pay offers, is a result of marketing campaigns that have been aiming to increase the number of users by
53% 51% 50% 48% 11% 11% 12% 12% 37% 38% 39% 40%
0% 10% 20% 30% 40% 50% 60% 70% 80% 90% 100%
2011 2013 E 2015 E 2017 E
Single-Play Double-Play Triple-Play
23% 20% 17%
15% 9%
10% 10%
10% 67% 70% 72%
75%
0% 10% 20% 30% 40% 50% 60% 70% 80% 90% 100%
2011 2013 E 2015 E 2017 E
Single-Play Double-Play Triple-Play
19% 17% 16% 15% 18% 16%
13% 12% 63% 67%
70% 74%
0% 10% 20% 30% 40% 50% 60% 70% 80% 90% 100%
2011 2013 E 2015 E 2017 E
Single-Play Double-Play Triple-Play Graph 23 –PT’s Fixed Line Client Mix Graph 23 - PT’s Fixed Broadband Client Mix Graph 23 - PT’s Pay TV Client Mix
Source: Anacom, Company Reports, Analyst Estimates
ARPUs to rise in the long run
65% 65% 74%
47%
77% 81%
0% 10% 20% 30% 40% 50% 60% 70% 80% 90%
Fixed Line Fixed Broadband
Pay TV
Sector PT
Graph 20 - Percentage of Bundled Offer Clients as of the end of 2011
PORTUGAL TELECOM COMPANY REPORT
PAGE 13/38 providing discounts to new clients during the first year of usage3738. Once again, however, we believe the unfavourable economic outlook will keep ARPUs down and may even exert some further downward pressure in the next few years, but once passed that period, PT will be able to increase the multiple play offers’ ARPU, especially considering that it currently 25% below Zon’s, as previously mentioned39.
On this matter, it is also important to mention that, once again, there is little room for differentiation. Out of the three wireline products that are part of multiple play offers, the one that still has the most room for differentiation is the Pay TV service, due to the different channels that can always be offered and to the possibilities for innovation and interactivity that the nature of the business creates40. This is extremely important because when thinking about bundles, this means that Pay TV will be the deciding factor when households decide with which company they want to sign their entire monthly bill with; as such, the player with the upper hand in TV is likely to gain an important advantage on the multiple-play market – we believe this is something that has not failed to be understood by companies, which have been putting a considerable effort on their pay TV businesses, likely anticipating these trends. Nowadays, Zon has the highest market share in Pay TV as a whole (54% vs. 35% from PT) and it also has the highest market share in bundled offers as a whole (42% vs. 38% from PT). However, as we have described in detail above, mostly because of its well-received initiatives and continued innovation in interactivity features and in developing exclusive channels41, PT has been gaining market share in Pay TV at a very steep pace, and we believe it has positioned itself to possibly have the upper hand on this market moving forward, thus enabling PT to soar in capturing new bundled clients.
37
A price comparison, rather than ARPU comparison, indeed makes it look like the triple play offers are more profitable for companies, even on a strictly revenues generation level (i.e. not accounting for cost synergies or other bundled offers advantages).
38
We were not able to find the exact number of clients on these conditions, but this is widely visible if one looks at PT’s marketing campaigns.
39
As explained before, we do not believe that there will be sustained long-term differences in pricing in the offers from Zon and PT.
40
We do not exclude the possibility that, on the long term, the superior technological capabilities provided by the fiber rollout and thus the fixed broadband service become also deciding factors. However, it is always possible to imagine a scenario in which Zon upgrades its network as well or in which PT is forced to engage in wholesale agreements of its network, which is why we believe it is more likely that Pay TV becomes the deciding factor.
41
Mr Bava has already stated that the Pay TV segment is the top priority for the domestic operations of PT. Pay TV to become the deciding
PORTUGAL TELECOM COMPANY REPORT
PAGE 14/38
The Personal Business
–
Un Avoidable Downturn
If the story of the residential business is one of resilience and long-term positive trends, the one from personal business is of sustained decline over the years and of a simultaneous convergence of negative trends and little long term good news. For starters, and perhaps most importantly, spending patterns on the mobile sector are far different from what we find on wireline. While the socio-cultural argument concerning the way communications are made today and the sense of essentialness that we made for the wireline is still present (perhaps even strongly) on the mobile market, the tariffing system of the sector, and of Portugal in particular, does not do the sector any favours. The fact that, unlike the Pay TV or the fixed broadband, there is a direct relationship between what is paid for and what is being used (usually in terms of minutes), means that we are dealing with a business that suffers, from the get-go, from a much smaller capacity to withhold negative economic cycles, as consumers will simply be able to adjust their usage and, therefore, their expenditures. This is clearly visible in the different ARPUs from both plans, as depicted in the graph on the left: in Portugal, post-paid has been on average 313% higher than pre-paid, a value in line with the European median, 298%. On top of this, Portugal has an overwhelming percentage of pre-paid plans (74% vs. an European Average of 52%42), which allows consumers to monitor and decide on a more rational way their expenditures, thus adjusting patterns to worse economic environments on an ex-ante root, as opposed to what happens in a post-paid plan, in which the control of the level of expenditures is made on an ex-post basis, as these involve signing contracts that stipulate a minimum monthly bill for a certain amount of time. As one can imagine, given the economic conditions that we are currently facing and that we will be facing during the next few years, this is an extremely important factor, capable of undermining the financial health of the whole sector.
The second trend that we believe to be negatively affecting this market is the rise of tribal plans43. These are pre-paid pricing plans targeted, but not limited, at young consumers, which offer free communications between members of the same plan, thus significantly cannibalizing the ARPU from the mobile segment. These tribal plans were originally launched by Optimus (the “Tag” program), the third Portuguese mobile operator, as a way to try to increase its market share among the youth; when Vodafone, the second operator and the most serious threat to TMN’s long running leadership, ended up responding with the launch of
42
Anacom 43
Although we could not find any concrete numbers to back up this statement, it is widely reported by all three operators that the percentage of revenues arising from tribal plans has been rising each year since its launch.
The rise of tribal plans has been bringing down the ARPU
-7,0% -6,5% -6,0% -5,5% -5,0%
0 1 2 3
2008 2009 2010 2011
Sector Revenues
Growth of Sector Revenues Graph 24 - Portugal
Personal Mobile Revnues
Units: Million Euros| Source: Anacom
Graph 25 - Mobile ARPU
0 5 10 15 20 25 30 35 40 45 50
Median Europe Pre-Paid
Median Europe Post-Paid
Portugal Pre-Paid
Portugal Post-Paid
PORTUGAL TELECOM COMPANY REPORT
PAGE 15/38 “Extreme”, PT (TMN) had no choice but to launch a similar offer, which was the “Moche” program. By definition, these programs suffer from structurally lower ARPUs and the similar offers in the market makes pricing upswings hard to sustain in the long run. This means that as tribal plans keep on gaining popularity, a downward pressure on ARPUs is expected to continue.
The third trend we would like to bring to the discussion is related with regulation, particularly with the decrease in mobile termination rates (MTRs). In Portugal, as a result of an enormous gap between on-net and off-net prices (as seen in the graph on the left), people tend to prefer to belong to the same network as their friends and family, which creates significant barriers for consumers to change network – network effect. However, in May 2009, the European Commission adopted a recommendation on the termination rates44 decrease as a way to boost competition (as seen in the graph on the left), thus bringing down the companies’ ARPUs as a result. Although the target for this decrease was the end of 201245, Anacom has already made announcements that would suggest further decreases in the MTRs. In addition to this, another regulatory measure, aimed at reducing the roaming fees, is also in play, which is also expected to have some impact, albeit on a lower scale. There are two implications of these regulatory changes for the communications sector and PT in particular. The first, and the most straightforward, is a continued decrease in the ARPU, as companies are able to charge less per each call. The second effect is related with the market share distribution. Historically, Portuguese market shares have remained remarkably stable, as the graph below illustrates, a situation that we attribute exactly to the high barriers that consumers faced to change networks and then be forced to pay substantially more to communicate with their normal contacts. However, with the decrease of mobile termination rates, this stability of the market is likely to have a shakedown, and one whose effects are quite unforeseeable. We believe that some minor players will be able to benefit from the situation as they offer more competitive packages (although they are not likely to become a factor in the long run) and we also believe that Optimus, whose pricing is actually, in general terms, more attractive than the one offered by TMN, might rise at the expense of the PT brand. We acknowledge the possibility of TMN adjusting its pricing in order to counteract this effect, but we do anticipate this to be very significant given the already low ARPUs which will not leave much room for companies to engage in price wars.
44
The termination rates are the fees that operators charge to one another for terminating calls on its network, which means, for routing calls from one company to another. These rates are the most important element in explaining the difference between the on-net and off-net prices (on-net prices o do not include termination rates, whereas off-net do). 45
OECD reports that from 2006 to 2011 these rates fell by a hefty 53% average on OECD countries. Graph 27 - Portugal On-Net and Off-Net
Prices Comparison (end of 2011)
9,2
13,6
-01 01 03 05 07 09 11 13 15
On-Net Off-Net
Source: Analyst Estimates, Diário Económico Research, Anacom | Units: Eurocents per Minute
Graph 26 - Portugal MTR Evolution
0 1 2 3 4 5 6
4Q2
010
1Q2
011
2Q2
011
3Q2
011
4Q2
011
Q12
012
2Q2
012
3Q2
012
4Q2
012
PORTUGAL TELECOM COMPANY REPORT
PAGE 16/38 The last factor we would like to mention is the fact that, unlike wireline, it is improbable that an ARPU contraction will be counterbalanced by an increase in the number of users, as Portugal already has one of the highest penetration rates in Europe in mobile. Although not a trend per se, the fact that the market has pretty much ceiled up will certainly not do PT or its competitors any favours, as this means new users will forcefully have to be conquered from the competition. Amidst all these negative dynamics, the only positive trend seems to be coming from the increase in the mobile data consumption, as signalled by the increase in data traffic worldwide, as seen by the first graph on the left. In fact, as shown in the second graph on the left, Portugal is, as of the end of 2011, the 16th country in the world with the highest penetration rate of smart-phones (35%) suggesting indeed a rise in mobile data consumption. Even more importantly, it is still way behind countries which usually exhibit the same adoption patterns as Portugal, such as Spain (46%) and Italy (38%), suggesting further growth potential. As such, the challenge for Portuguese mobile operators seems to be finding a way to monetize this revenue, which is shaping more and more to be the primary source of revenues in the segment in the future46. PT has positioned itself in a privileged position to do so, as it possesses an impressive LTE network, with a superior speed and quality and over 90% coverage47. We believe this will prove to be critical for the company’s continued dominance on this market in the long term, even though similarly to what happens with the fibber rollout investment, this is an investment whose return we do not expect the company to get back in the next years, due to the adverse economic conditions, which will continue to postpone the adoption of these superior technologies.
Bottom line, we believe that despite long-term positive impact from data48, there are just too many negative factors in play, so we expect revenues to fall, especially in the next three years, after which we trust things will start looking up.
46
Another important source of revenues are the mobile pen-drives that provide internet access which have been gaining popularity within the last years, although neither companies nor regulators provide individual information about this. 47
Although we could not quantify Vodafone and Optimus’ coverage of this technology, the consensus is that it is still considerably below the 90% held by TMN. The biggest cause for this appears to be the implementation gap: while TMN started its investment in early 2009, it was not until late 2010 that the other competitors got serious about it (Anacom). 48The positive impact of mobile data is weakened by the low ARPU that it has, 3.6€, when compared with the mobile
voice ARPU, 7.4€, of PT (as of the end of 2011).
Graph 28 - Personal Mobile Market Shares
44% 44% 43% 43% 43% 42% 42% 42%
0% 20% 40% 60% 80% 100%
2009 2010 2011 2012 E 2013 E 2014 E 2015 E 2016 E
Others
Optimus
Vodafone
TMN
Source: Anacom, Analyst Estimates
0% 20% 40% 60% 80% Singapore
Hong Kong Sweden Australia Spain Denmark Israel Finland Norway New Zealand UK Italy The Netherlands Austria Taiwan Greece Ireland Portugal USA South Korea
Graph 30 - Smartphone Penetration
Source: Wired Magazine 0
50000 100000 150000 200000 250000 300000 350000 400000
2010 20011 2012
Graph 29 - Mobile Data Traffic in Western Europe
PORTUGAL TELECOM COMPANY REPORT
PAGE 17/38
Enterprise
–
Where It Hurts the Most
The enterprise segment is, in our opinion, the one that in the next years will truly harm PT’s revenues and overall results, as we expect a continued decline on its revenues. The thing with this segment is that it is a sector that will always follow very closely the economic cycles. As such, in a recessionary time such as the present one and the ones we will be going through the next years, not only are the net additions of clients negative (there are more companies going bankrupt and closing than new companies opening) but ARPUs are also falling at a downright scary pace (-10% in the last year, to 32.3€), as a result of expenditure cut programs all across the corporate world. PT in particular is widely exposed to these expenditure cuts due to the fact that its product mix in the enterprise segment is, as showcased in the chart on the left, heavily skewed towards voice (826K users from fixed line and 1445K users from mobile, against 193K from broadband and 68K from Pay TV), which, as discussed before, is the product in which consumers have less trouble adjusting their spending patterns. Additionally, PT is also more exposed to the enterprise sector as a whole than its peers: whereas 21% of total PT users come from the enterprise sector, on a Portuguese sector basis, this number is only about 7%49.
Nevertheless, on a long term basis, we believe PT, through its impressive investments both in fibber rollout and LTE, has positioned itself to counterbalance most of these short term losses and that it will remain the company of choice for most corporations due to its superior technology and complete offer, considering corporations are usually interested in hiring services in a bundled fashion, including also mobile services. Moreover, as seen in the graph on the left, Portugal is still far from having a very high penetration rate in the enterprise sector when compared to its peers when it comes, for instance, to broadband, which means that there is still a lot of room to grow. Standing between the materialisation of this potential and PT is, of course, the Portuguese macro environment, which despite these positive trends, we still believe will be, by far, the dominant effect on this market.
We are therefore forecasting massive declines on this sector, both on the number of users and on the ARPU in the short to medium term, with recovery starting, albeit on a slow pace, around 2016.
49
Looking at fixed broadband only, 17% of PT customers are enterprise, whereas these are only 5% from the sector as a whole, again reflecting the higher exposure from PT. These numbers, as well as the 7% aforementioned, were estimated through data provided by Anacom as well as company reports.
Graph 31 - PT Enterprise Users Segmentation
18%
157 %
Fixed Broadband + Pay TV Users
Fixed Line + Mobile Users
Source: Company Reports
00% 10% 20% 30% 40% 50% 60% 70% 80% 90% 100%
S
pa
in
F
ran
ce
Sw
e
d
e
n
N
e
the
rl
an
ds
G
e
rm
an
y
UK
Ir
e
la
nd
D
e
nm
ar
k
P
o
rt
ug
al
It
al
y
A
us
tr
ia
G
re
e
ce
P
o
lan
d
Graph 32 - Fixed Broadband Penetration on Enterprises Across Countries
PORTUGAL TELECOM COMPANY REPORT
PAGE 18/38
Cost Margins and Investments
Despite the recent hits that PT’s domestic revenues took, the operational performance has actually been very healthy, as the company was able to cut its costs and achieve more favourable EBITDA margins, even amidst a recessionary climate. In fact, operational expenditures fell 14.2% in 2010 while revenues fell by just 7.4% thus allowing for an impressive expansion of the EBITDA margin of 5.2%. Nevertheless, we believe that PT is already at the limit of cost reductions, particularly those concerned with personnel and commercial costs, so it is not in a position to keep cutting down costs. For this reason, we are expecting some contraction of the EBITDA margin in the short term. On the long term though, we expect this margin to start swinging upwards, eventually stabilizing around the 40-45% range once again. As shown in the graph, this range is actually higher than the average European EBITDA margin from its peers. In order to assess whether this was mostly due to efficiency gains or due to higher ARPUs (due to lower competition or due to more collusion), we have looked at the ARPUs from other countries50. As shown in the second graph on the left, Portugal’s ARPU is actually one of the lowest analysed, supporting to the idea of a higher operational efficiency51. As such, we are counting on PT’s ability to keep this operational efficiency in the long run. Nevertheless, the long term margins we are forecasting are slightly below today’s margins, reflecting on the one hand the fact today PT is having margins that are already diminished to adjust for negative economic conditions and also the fact that the expected product mix, skewed towards fixed broadband and pay TV is associated with lower margins than voice52.
On the other hand, in what concerns CAPEX, the outlook seems to be far more favourable. In the last years, PT has had an abnormally high CAPEX, especially due to its fibber rollout investment.53. Recently, Mr Bava has stated that PT had an approximate cost of 200€ with each household passed with fibber, which would mean an approximate 320M€ of total investment from 2009 until 2012. To analyse the impact of this investment, we have looked at the number of clients PT has in FTTH54, as summarized in the graph, and assumed an increase in the ARPU of about 27%55. This would mean that from 2009 until the end of 2011,
50
The ARPUs presented are estimates of averages (considering the purchasing power parity differences) across fixed line, fixed broadband and Pay TV that do not take into account the distribution of users across these three services. 51
Although the average EBITDA margin presented includes a few more countries than the 7 here presented, we do not think the conclusions would be altered in a significant way.
52
Although PT does not disclose these margins separately, this is the typical situation, as we will show when dwelling
into Oi’s business, where this is also an important factor. 53
The LTE investment has also contributed to this high level of CAPEX. 54
PT is leader in both areas with a market share in FTTH fixed broadband of 80% and of 83.4% in FTTH Pay TV. 55
This value is not disclosed, so we have used as proxies international companies (Nippon Telephone Corporation, Telekom Austria Group and Swisscom). The results presented are thus estimates only.
Graph 33 - EBITDA Margin
Source: Company Reports, Analyst Estimates, Bloomberg 0% 5% 10% 15% 20% 25% 30% 35% 40% 45% 50% EBITDA Margin
Comparables Margin as of 2011
00 10 20 30 40 50 60 70 80
Graph 35 - ARPU Across Countries
Source: OECD, Analyst Estimates | Units: Euros
Source: Anacom, Company Reports Analyst Estimates | Units: # Users Graph 34 - FTTH Users from PT
0 50.000 100.000 150.000 200.000 1 T 0 9 2 T 0 9 3 T 0 9 4 T 0 9 1 T 1 0 2 T 1 0 3 T 1 0 4 T 1 0 1 T 1 1 2 T 1 1 3 T 1 1 4 T 1 1
PORTUGAL TELECOM COMPANY REPORT
PAGE 19/38 PT’s incremental revenues from FTTH would have been about 200M€ - the company should have then broken-even in 2012. There are, however, two caveats. The first is that FTTH also reduces OPEX due to the higher quality of the technology, although we could not infer exactly by how much. The second is that some of these clients would likely not be PT’s clients were it not for the FTTH – in such cases, the added value of the investment would be the entire revenue generated by these users rather than the incremental portion. As such, it is likely that we are underestimating the positive impact of the FTTH investment and that the break-even might have occurred as early as in 2011. In any case, we believe the investment has already paid off and will continue to do so in the future, as FTTH revenues continue to grow, as seen by the first graph on the left.
Coming back to the impact on CAPEX, this FTTH investment is ceasing in 2012 as company is reaching the 1.6M households passed with fibber, thus achieving about 40% coverage. Mr Bava has already confirmed that further investments on this technology are not on PT’s plans for the foreseeable future, not only because Portugal’s penetration rate in FTTH is already extremely high56, but also due to the possible adverse regulations effects. In fact, the EC has been pressuring Anacom to force PT to engage in wholesale agreements with its competitors and open its fibber rollout lines (as a way to save the duplication of infrastructures) – this would obviously alter PT’s return on its investment, as it would receive remuneration but it would also lose its differentiation factor. So far, Anacom has not pursued this recommendation, on the grounds that the coverage that PT has is still not large enough for this (this is why we do not believe PT will keep on investing), although the threat still stands. Regardless, this CAPEX reduction offers PT a CF advantage over most of its competitors, which are now struggling to upgrade their own networks in spite of the adverse market trends. As for the intangible assets, PT has announced that it will not need to renew its licenses until 2025, so there are no major investments in this area expected either.
This lower CAPEX needs give PT a great flexibility to postpone its investments, which become mostly related with revamping activities, the timing of which could be easily adjusted. Overall, we expect a decrease of the CAPEX/Sales Ratio from the current 22% to about 18% in the long term, still above the sector average of 13%, bearing in mind PT’s continued focus on innovation and the need to create differentiated products, particularly on Pay TV, as discussed.57
56Portugal’s penetration rate in FTTH was, as of the end of 2011, 1.60% (per inhabitant), a value that was more t han double the European average of 0.6%, according to data from Anacom. This suggests that Portugal is already advanced for its time, so a similar amount of investment in this in the near future is unlikely.
57
The higher-than-the-sector expectation comes from PT’s commitment to innovation and ahead of its time investments,
which we believe will continue to impact the company’s direction moving forward.
0 100 200 300 400 500 600 700 800 900 1T 09 2T 09 3T 09 4T 09 1T 10 2T 10 3T 10 4T 10 1T 11 2T 11 3T 11 4T 11
FTTH Revenues Other Revenues
Source: Anacom, Company Reports Analyst Estimates | Units: Million Euros Graph 36 - PT Revenues Split
Source: Company Reports, Analyst Estimates, Bloomberg | Units: Million Euros or %
0% 5% 10% 15% 20% 25% 30% 0 100 200 300 400 500 600 700 800 900 1000 201 0 201 1 201 2 E 201 3 E 201 4 E 201 5 E 201 6 E 201 7 E Capex
Capex as % Sales