A vibrational spectroscopic study of the silicate mineral inesite
Ca
2
(Mn,Fe)
7
Si
10
O
28
(OH)
5H
2
O
Ray L. Frost
a,⇑, Andrés López
a, Yunfei Xi
a, Ricardo Scholz
ba
School of Chemistry, Physics and Mechanical Engineering, Science and Engineering Faculty, Queensland University of Technology, GPO Box 2434, Brisbane, Queensland 4001, Australia
b
Geology Department, School of Mines, Federal University of Ouro Preto, Campus Morro do Cruzeiro, Ouro Preto, MG 35,400-00, Brazil
h i g h l i g h t s
We have studied the hydrated
hydroxyl silicate mineral inesite.
Of formula
Ca2(Mn,Fe)7Si10O28(OH)5H2O.
Using a combination of scanning
electron microscopy with EDX and Raman and infrared spectroscopy.
OH stretching vibrations are readily
studied.
The application of vibrational
spectroscopy has enabled an assessment of the molecular structure of inesite.
g r a p h i c a l
a b s t r a c t
a r t i c l e
i n f o
Article history:
Received 14 October 2013
Received in revised form 2 February 2014 Accepted 19 February 2014
Available online 12 March 2014
Keywords: Inesite Silicate N’chwaning mine Raman spectroscopy Infrared spectroscopy
a b s t r a c t
We have studied the hydrated hydroxyl silicate mineral inesite of formula Ca2(Mn,Fe)7Si10O28(OH)5H2O using a combination of scanning electron microscopy with EDX and Raman and infrared spectroscopy. SEM analysis shows the mineral to be a pure monomineral with no impurities. Semiquantitative analysis shows a homogeneous phase, composed by Ca, Mn2+, Si and P, with minor amounts of Mg and Fe.
Raman spectrum shows well resolved component bands at 997, 1031, 1051, and 1067 cm 1attributed to a range of SiO symmetric stretching vibrations of [Si10O28] units. Infrared bands found at 896, 928, 959 and 985 cm 1are attributed to the OSiO antisymmetric stretching vibrations. An intense broad band at 653 cm1with shoulder bands at 608, 631 and 684 cm 1are associated with the bending modes of the OSiO units of the 6- and 8-membered rings of the [Si10O28] units. The sharp band at 3642 cm 1with shoulder bands at 3612 and 3662 cm 1are assigned to the OH stretching vibrations of the hydroxyl units. The broad Raman band at 3420 cm 1with shoulder bands at 3362 and 3496 cm 1are assigned to the water stretching vibrations. The application of vibrational spectroscopy has enabled an assessment of the molecular structure of inesite to be undertaken.
Ó2014 Elsevier B.V. All rights reserved.
Introduction
Inesite[1]is a hydrated calcium manganese silicate hydroxide of formula Ca2(Mn,Fe)7Si10O28(OH)25H2O. The mineral is triclinic
and its habit includes prismatic crystals with chisel-like termina-tions and tabular and fibrous and in radiating aggregates and sphericules. The mineral was named after the Greek for ‘‘fibers,’’
ines, in reference to its common crystal habit. The mineral has outstanding colours from pink to orange or flesh-red to rose. The mineral was first discovered in 1887 at the manganese mines at Nanzenbach, northeast of Dillenburg, Germany[2]and is known from quite a number of sites worldwide[3–6].
http://dx.doi.org/10.1016/j.saa.2014.02.115 1386-1425/Ó2014 Elsevier B.V. All rights reserved.
⇑ Corresponding author. Tel.: +61 7 3138 2407. E-mail address:[email protected](R.L. Frost).
Contents lists available atScienceDirect
Spectrochimica Acta Part A: Molecular and
Biomolecular Spectroscopy
The structure of inesite has been solved by Otroshchenko et al. [7], who state that the crystals of inesite are triclinic, space group
P1., with a= 8.956, b= 9.257, c= 11.995 Å,
a
= 91°540,b= 47°300,c
= 85°500, andZ= 1. Inesite structure is composed of Mn octahedra, Ca polyhedra, and Si tetrahedra[7]. The [Si10O28] infinite ribbons lie parallel to layers composed of Mn octahedra and Ca polyhedra. There are four different Mn octahedra (composed of Mn + O, Mn + O + OH, Mn + O + H2O, and Mn + O + OH + 1/2H2O) and five Si–O tetrahedra (differing in interatomic distances) in the inesite structure[8]. Wan and Ghose stated that the crystal structure of inesite provides the first example of double silicate chains with a periodicity of five tetrahedra[9]. In their study of the structure, Wan and Ghose[8]chose different orientation of crystallographic elements for mineral inesite, where a= 8.889(2), b= 9.247(2),c= 11.975(3) Å,
a
= 88.15(2)°, b= 132.07(2)°,c
= 96.64(2)°. The crystal structure of inesite is composed of two components: (1) sin-gle silicate chains with a five-tetrahedral-repeat period, polymer-ized into double chains with alternating 6- and 8-membered rings and (2) polyhedral bands, whose building blocks are a distorted pentagonal bipyramid around Ca and octahedra around four crys-tallographic different Mn atoms. These two components are linked into a three-dimensional framework by sharing corners, in addition to two edges of the Ca polyhedron, which are shared by two silicate tetrahedra. The bridging Si-O bonds are significantly longer (av. 1.64 Å) than the nonbridging Si–O bonds (av. 1.60 Å) [10]. The three crystallographically independent water molecules serve as apical ligands to the Ca and Mn atoms. The site of one of the water molecules is statistically occupied half the time, accounting for five water molecules in the unit cell [8]. All seven hydrogen atoms are involved in hydrogen bonding. The recipient of a hydro-gen bond is either a water molecule or a bridging oxyhydro-gen atom bonded to two silicon only[8].Raman spectroscopy has proven very useful for the study of sil-icate minerals [11–14]. Indeed, Raman spectroscopy has proven most useful for the study of diagenetically related minerals where isomorphic substitution may occur as with wardite, cyrilovite and inesite, as often occurs with minerals containing phosphate groups. This paper is a part of systematic studies of vibrational spectra of minerals of secondary origin. The objective of this research is to report the Raman and infrared spectra of inesite and to relate the spectra to the molecular structure of the mineral.
Experimental
Samples description and preparation
Inesite from N’chwaning mine in the Kalahari manganese field occurs in the vein- and vug-hosted mineral associations in Wessels-type ore[15], which is oxide-rich, carbonate-poor high-grade manganese ore formed by hydrothermal alteration of Mamatwan-type (braunite lutite) ore [16]. Among four textural types of vein- and vug-hosted mineralization in Wessels-type ore, inesite occurs in large isolated vugs or ‘‘pockets’’[17]. In most vugs of this type a crude concentric mineralogical zonation is observable. The wallrock is usually composed of massive hematite or jacobsite, and inner lining along the wallrock contact is com-posed of a fine crystalline, massive mixture of densely intergrown andradite, tephroite, jacobsite, clinochlore, datolite and caryopilite. This fine crystalline assemblage is overgrown by a more coarse grained mineral association containing euhedral crystals of a mul-titude of mineral species ranging from andradite and hausmannite to xonotlite, tobermorite, datolite, inesite and many more[18].
The sample was incorporated to the collection of the Geology Department of the Federal University of Ouro Preto, Minas Gerais, Brazil, with sample code SAB-195. The sample was gently crushed and the associated minerals were removed under a
stereomicro-scope Leica MZ4. Scanning electron microscopy (SEM) in the EDS mode was applied to support the mineral characterization.
Scanning electron microscopy (SEM)
Experiments and analyses involving electron microscopy were performed in the Center of Microscopy of the Universidade Federal de Minas Gerais, Belo Horizonte, Minas Gerais, Brazil (http:// www.microscopia.ufmg.br). The results are given in the supple-mentary information.
Inesite single crystal up to 1 mm was coated with a 5 nm layer of evaporated carbon. Secondary Electron and Backscattering Elec-tron images were obtained using a JEOL JSM-6360LV equipment. Qualitative and semi-quantitative chemical analyses in the EDS mode were performed with a ThermoNORAN spectrometer model Quest and was applied to support the mineral characterization.
Raman spectroscopy
Crystals of inesite were placed on a polished metal surface on the stage of an Olympus BHSM microscope, which is equipped with 10, 20, and 50 objectives. The microscope is part of a
Reni-shaw 1000 Raman microscope system, which also includes a monochromator, a filter system and a CCD detector (1024 pixels). The Raman spectra were excited by a Spectra-Physics model 127 He–Ne laser producing highly polarised light at 633 nm and col-lected at a nominal resolution of 2 cm 1 and a precision of ±1 cm 1in the range between 200 and 4000 cm 1. Some of these mineral fluoresced badly at 633 nm; as a consequence other laser excitation wavelengths were used especially the 785 nm laser. Repeated acquisitions on the crystals using the highest
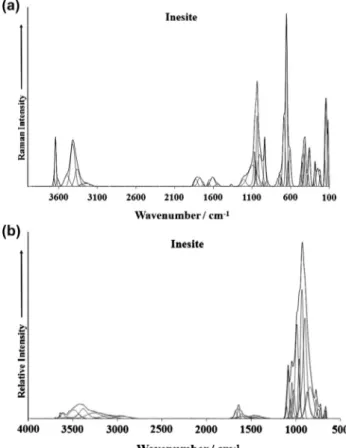
Fig. 1.(a) Raman spectrum of inesite over the 100–4000 cm 1spectral range and
magnification (50) were accumulated to improve the signal to
noise ratio of the spectra. Spectra were calibrated using the 520.5 cm 1line of a silicon wafer. Previous studies by the authors provide more details of the experimental technique. Alignment of all crystals in a similar orientation has been attempted and achieved. However, differences in intensity may be observed due to minor differences in the crystal orientation.
A Raman spectrum of inesite is recorded on the RRUFF data base (http://rruff.info/inesite/display=default/R090030). This spectrum has been downloaded and is included in the supplementary information.
Infrared spectroscopy
Infrared spectra were obtained using a Nicolet Nexus 870 FTIR spectrometer with a smart endurance single bounce diamond ATR cell. Spectra over the 4000–525 cm 1 range were obtained by the co-addition of 128 scans with a resolution of 4 cm 1and a mirror velocity of 0.6329 cm/s. Spectra were co-added to improve the signal to noise ratio.
Spectral manipulation such as baseline correction/adjustment and smoothing were performed using the Spectracalc software package GRAMS (Galactic Industries Corporation, NH, USA). Band component analysis was undertaken using the Jandel ‘Peakfit’ software package that enabled the type of fitting function to be selected and allows specific parameters to be fixed or varied accordingly. Band fitting was done using a Lorentzian–Gaussian cross-product function with the minimum number of component
bands used for the fitting process. The Gaussian–Lorentzian ratio was maintained at values greater than 0.7 and fitting was undertaken until reproducible results were obtained with squared correlations ofr2greater than 0.995.
Results and discussion
Chemical characterization
The SEM image of inesite sample studied in this work is shown in Fig. S1. Inesite crystals show a prismatic habitus. Qualitative chemical composition shows a homogeneous phase, composed by Ca, Mn and Si, with minor amounts of Al (Fig. S2).
Vibrational spectroscopy
The Raman spectrum of inesite in the 100–4000 cm 1spectral range is illustrated in Fig. 1a. This Raman spectrum shows the position of the Raman bands and their relative intensities. It is obvious that there are large parts of the spectrum where little or no intensity is observed. Therefore, the spectrum is subdivided into sections according to the type of vibration being investigated. In this way, the precise position of the bands can be detailed. The infrared spectrum of inesite in the 500–4000 cm 1spectral range is shown inFig. 1b. The reflectance spectrum starts at500 cm 1
because the ATR cell absorbs all infrared radiation below this wavenumber. As for the Raman spectrum, the infrared spectrum is subdivided into sections depending upon the type of vibration being examined. The complete infrared spectrum displays the po-sition of the infrared bands and their relative intensity. It is noted Fig. 2.(a) Raman spectrum of inesite over the 800–1400 cm1 range and (b)
infrared spectrum of inesite over the 500–1300 cm 1range.
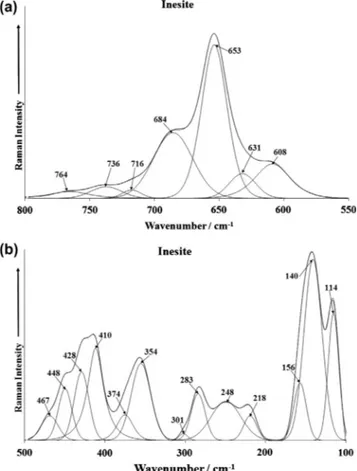
Fig. 3.(a) Raman spectrum of inesite over the 300–800 cm 1range and (b) Raman
that there is significant intensity in the hydroxyl stretching region in both the Raman and infrared spectra.
The Raman spectrum of inesite over the 850–1400 cm 1 spec-tral range is shown inFig. 2a. The Raman spectrum is dominated by a series of intense overlapping Raman bands with resolved com-ponent bands at 997, 1031, 1051, and 1067 cm 1. These bands are attributed to a range of SiO symmetric stretching vibrations. The structure consists of infinite ribbons of [Si10O28] units and with silicate double chains with alternate 6- and 8-membered rings. Thus, it is not unexpected that there are differing SiO stretching vibrations. In the Raman spectrum of inesite from the RRUFF data base, Raman bands are identified at 1013, 1025 and 1067 cm 1. The position of these bands is in harmony with the Raman bands shown inFig. 4a. Dowty showed that the -SiO3units had a unique band position of 980 cm 1[19](see Figs. 2 and 4 of this reference). Dowty also showed that Si2O5units had a Raman peak at around 1100 cm 1.
The infrared spectrum of inesite over the 700–1200 cm 1 spec-tral range is provided inFig. 2b. The infrared spectrum is complex with multiple overlapping bands. The Raman bands in the 1000–1100 cm 1spectral range are also observed in the infrared spectrum with infrared bands at 1021, 1042, 1057, 1083 and 1101 cm 1. Infrared bands are found at 896, 928, 959 and 985 cm 1. These bands are attributed to the OSiO antisymmetric stretching vibrations. These bands were not observed or were of very low intensity in the Raman spectrum. It is likely that the infra-red bands at 720, 743, 771 are due to water vibrational modes or hydroxyl deformation modes.
The Raman spectrum of inesite over the 550–800 cm 1spectral range and the 100–550 cm 1spectral range is shown inFig. 3. The
Raman spectrum (Fig. 3a) is dominated by an intense broad band at 653 cm 1 with shoulder bands at 608, 631 and 684 cm 1. These bands are associated with the bending modes of the OSiO units of the 6- and 8-membered rings of the [Si10O28] units. The Raman spectrum from the RRUFF data base shows a very intense Raman band at 651 cm 1with shoulder bands at 606, 687 and 710 cm 1. The position of the bands from the RRUFF data base is in good agreement with the bands shown inFig. 3a.
The Raman spectrum (Fig. 3) may be divided into sections (a) Raman bands in the 350–467 cm 1spectral range and (b) bands between 100 and 301 cm 1 region. The first group of bands are attributed to CaO and MnO stretching and bending vibrations. The Raman bands below 300 cm 1 may simply be described as external vibrations or lattice modes. In the RRUFF spectrum, Raman bands are detailed at 337, 348, 421, 445 and 489 cm 1.
The Raman spectrum of inesite in the hydroxyl stretching region is reported inFig. 4a. There are two features in this spec-trum (a) the sharp band at 3642 cm 1 and (b) the broad band centered upon 3420 cm 1. The first band with its shoulders at 3612 and 3662 cm 1are assigned to the OH stretching vibrations of the hydroxyl units. The observation of multiple OH stretching bands supports the concept of non-equivalent hydroxyl units in the inesite structure. The broad Raman band at 3420 cm 1 with shoulder bands at 3362 and 3496 cm 1are assigned to the water OH stretching vibrations.
The infrared spectrum of inesite in the 2700–3800 cm 1 spec-tral range is shown inFig. 4b. The infrared spectrum is broad with multiple overlapping bands. The sharp bands at 3609 and 3638 cm 1 are attributed to the OH stretching vibrations of the
Fig. 4.(a) Raman spectrum of inesite over the 2600–3800 cm1spectral range and
(b) infrared spectrum of inesite over the 2400–3800 cm 1range.
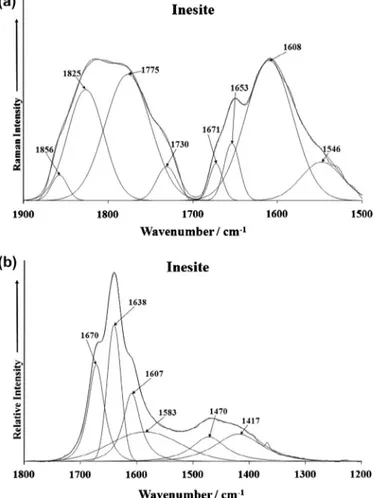
Fig. 5.(a) Raman spectrum of inesite over the 1400–1800 cm1spectral range and
OH units. The series of resolved component bands at 2944, 3108, 3261, 3379 and 3429 cm 1are ascribed to water stretching vibra-tions. The observation of multiple water OH stretching vibrations supports the concept of non-equivalent water molecules in the ine-site structure. This means that water exists in the ineine-site structure in different molecular environments.
The Raman spectrum of inesite over the 1500–1900 cm 1 spec-tral range is shown inFig. 5a. The infrared spectrum of inesite over the 1200–1800 cm 1spectral range is provided inFig. 5b. The Ra-man bands at 1608, 1653 and 1671 cm 1are assigned to water bending vibrational modes. The observation of three bands supports the concept of water molecules in different molecular environments with different hydrogen bond strengths. This concept is reinforced by the series of bands in the infrared spectrum at 1607, 1638 and 1670 cm 1assigned to water bending modes. The infrared spectrum also displays two bands at 1417 and 1470 cm 1.
Conclusions
Inesite is a hydrated hydroxyl silicate mineral of formula Ca2(Mn,Fe)7Si10O28(OH)5H2O Raman spectroscopy complimented with infrared spectroscopy has been used to study aspects of the molecular structure of this silicate mineral inesite. The structure of inesite is triclinic. As a consequence multiple silicate vibrational modes are observed. Raman and infrared bands are observed and attributed to silicate, hydroxyl and water vibrational stretching and bending modes. As a consequence at the molecular level non-equivalent silicate units exist in the structure of inesite. As a consequence multiple silicate vibrational modes are observed.
Acknowledgments
The financial and infra-structure support of the Discipline of Nanotechnology and Molecular Science, Science and Engineering Faculty of the Queensland University of Technology, is gratefully
acknowledged. The Australian Research Council (ARC) is thanked for funding the instrumentation. The authors would like to acknowledge the Center of Microscopy at the Universidade Federal de Minas Gerais (http://www.microscopia.ufmg.br) for providing the equipment and technical support for experiments involving electron microscopy. Zˇ. Zˇigovecˇki Gobac thanks to Ministry of Sci-ence, Education and Sports of the Republic of Croatia, under Grant No. 119-0000000-1158. R. Scholz thanks to CNPq – Conselho Nac-ional de Desenvolvimento Científico e Tecnológico (Grant No. 306287/2012-9).
Appendix A. Supplementary material
Supplementary data associated with this article can be found, in the online version, athttp://dx.doi.org/10.1016/j.saa.2014.02.115.
References
[1]W.E. Richmond, Am. Min. 27 (1942) 563–569. [2]S.G. Gordon, Science 56 (1922) 50.
[3]A. Schneider, Jahrb. Preuss. Geol. Reichsans (1888) 472. [4]A. Hamberg, Geol. For. Forh. 16 (1894) 304.
[5]O.C. Farrington, N. Jahrb. f. Mineral. (1901) 364–367. [6]G. Flink, Z. Krist. 58 (1923) 356–385.
[7]L.P. Otroshchenko, V.I. Simonov, N.V. Belov, Doklady Akad. Nauk SSSR 238 (1978) 1344–1347.
[8]C. Wan, S. Ghose, Am. Min. 63 (1978) 563–571.
[9] W. Anthony, R.A. Bideaux, K.W. Bladh, M.C. Nichols, Arsenates, Phosphates, Vanadates, vol. 4, Mineral Data Publishing, Tucson, 2000.
[10] C. Wan, S. Ghose, Naturwissenschaften 62 (1975) 96. [11]R.L. Frost, Y. Xi, Radiat. Eff. Defects Solids 168 (2013) 72–79. [12]R.L. Frost, Y. Xi, Vib. Spectrosc. 64 (2013) 33–38.
[13]R.L. Frost, Y. Xi, R. Scholz, L.F.C. Horta, Spectrochim. Acta A109 (2013) 138–145. [14]R.L. Frost, Y. Xi, R. Scholz, A. Lopez, F.M. Belotti, J. Mol. Struct. 1042 (2013) 1–7. [15]J. Gutzmer, N.J. Beukes, Ore Geol. Rev. 11 (1996) 405–428.