Structural characterization of the borate mineral
inyoite – CaB
3
O
3
(OH)
5
4(H
2
O)
Ray L. Frost
a,⇑, Andrés López
a, Ricardo Scholz
b, Frederick Theiss
a, Geraldo Magela da Costa
c aSchool of Chemistry, Physics and Mechanical Engineering, Science and Engineering Faculty, Queensland University of Technology, GPO Box 2434, Brisbane, Queensland 4001, Australia b
Geology Department, School of Mines, Federal University of Ouro Preto, Campus Morro do Cruzeiro, Ouro Preto, MG 35400-00, Brazil c
Chemistry Department, Federal University of Ouro Preto, Campus Morro do Cruzeiro, Ouro Preto, MG 35400-00, Brazil
h i g h l i g h t s
We have studied the mineral Ca(H4B3O7)(OH)4(H2O) or CaB3O3(OH)54(H2O).
Using a range of techniques including XRD, SEM, EDX, TG and vibrational spectroscopy. Both tetrahedral and trigonal boron units are observed.
Bands due to the isotopes of boron are observed.
Aspects of the molecular structure of inyoite are determined.
a r t i c l e
i n f o
Article history:
Received 28 July 2014
Received in revised form 23 September 2014 Accepted 27 September 2014
Available online 5 October 2014
Keywords:
Inyoite Borate Calcium
Raman spectroscopy Infrared spectroscopy
a b s t r a c t
We have studied the mineral Ca(H4B3O7)(OH)4(H2O) or CaB3O3(OH)54(H2O) using electron microscopy
and vibrational spectroscopy. The mineral has been characterized by a range of techniques including X-ray diffraction, thermal analysis, electron microscopy with EDX and vibrational spectroscopy. Electron microscopy shows a pure phase and the chemical analysis shows the presence of calcium only. The nom-inal resolution of the Raman spectrometer is of the order of 2 cm1and as such is sufficient enough to
identify separate bands for the stretching bands of the two boron isotopes. Raman and infrared bands are assigned to the stretching and bending modes of trigonal and tetrahedral boron and the stretching modes of the hydroxyl and water units. By using a combination of techniques we have characterized the borate mineral inyoite.
Ó2014 Elsevier B.V. All rights reserved.
Introduction
Borate minerals are an important supplement for different industries[1]. Boron is found in borates of metals, especially of cal-cium and sodium. Important deposits of boron ores are located in Turkey, mainly in Anatolia[2]; California, USA[3]; Argentina[4] and Bolívia[5]. Borate brine deposits are composed by a complex association of minerals. The mineral inyoite is a hydrated borate mineral of sodium with the formula Na2B4O6(OH)23H2O. It was
described as a new mineral by Schaller from the Rich Station, Kra-mer Borate deposit, Boron, KraKra-mer District, Kern Co., California, USA[6]. Other occurrences were reported from Argentina[7]and Turkey[8].
The mineral occurs as prismatic to tabular crystals and crystal-izes with monoclinic symmetry, Space Group is P21/a with
a =10.63(2)Å,b =12.06(2)Å,c =8.405(2)Å,b=114°020 with Z= 4. Inyoite contains the same isolated [B3O3(OH)5]2 polyions that
were found in meyerhofferite and in the synthetic, CaB3O3(OH) 2H2O. Such a polyion is formed by two BO4tetrahedra sharing a
corner and one BO3triangle linking the two tetrahedra. Polyions
of inyoite are connected to one another and to neighboring water molecules by bonding through calcium ions and by hydrogen bonds[9].
There are many borate containing minerals which have yet to have their vibrational spectra measured and the molecular struc-ture assessed in terms of their vibrational spectra. The importance of the mineral inyoite rests with the chemistry of the compound and the potential to synthesize nanomaterials based upon polymer-ization of borate units. Such compounds have the potential to make especially selected ferroelectric, pyroelectric and piezoelectric properties. The mineral inyoite is a precursor for the synthesis of such nanomaterials. Spectroscopy methods are important tools in the study of complex mineral associations. The objective of this
http://dx.doi.org/10.1016/j.molstruc.2014.09.079
0022-2860/Ó2014 Elsevier B.V. All rights reserved.
⇑ Corresponding author. Tel.: +61 7 3138 2407; fax: +61 7 3138 1804.
E-mail address:[email protected](R.L. Frost).
Contents lists available atScienceDirect
Journal of Molecular Structure
research is to report the Raman and infrared spectra of inyoite and to relate the spectra to the molecular structure of the mineral. This is the first report of a combined systematic study of inyoite by a wide range of techniques including infrared and Raman spectros-copy. Due to the industrial importance, inyoite was subject of scien-tific studies in different ways[10].
Experimental
Samples description and preparation
The inyoite sample studied in this work forms part of the collec-tion of the Geology Department of the Federal University of Ouro Preto, Minas Gerais, Brazil, with sample code SAC-013. The mineral originated from Mount Blanco mine, Mount Blanco, Black Mountains, Death Valley, Inyo County, California[11]in the Puna Austral subprovince [12] and constitutes an evaporate deposit. Detailed study concerning the geology of the deposit and genetic aspects was published[13].
The sample occurs as a single crystal up to 3 cm along thecaxis. Cleavage fragments were collected under a stereomicroscope Zeiss Stemi DV4 from the Museu de Ciência e Técnica – UFOP. Scanning electron microscopy (SEM) in the EDS mode was applied to support the mineral characterization.
X-ray diffraction
X-ray diffractogram was obtained in a Shimadzu XRD 6000 dif-fractometer equipped with an iron tube and a graphite monochro-mator. The scans were done between 4 and 70° (2h) with a scanning speed of 0.5 degree/min. Silicon was used as an internal standard. Cell parameters were refined by means of the Jade+
pro-gram using least-square refinement after subtracting the back-ground and theKa2contribution and using intensity and angular
weighting of the most intense peaks.
Thermogravimetric analysis
Simultaneous thermogravimetric analysis (TGA) and differen-tial thermal analysis (DTA) were performed in a Du Pont SDT2960 module. The temperature ranged from 25°C to 1000°C, using a constant flow of synthetic air (100 ml/min) and a heating rate of 20°C /min.
Scanning electron microscopy (SEM)
Experiments and analyses involving electron microscopy were performed in the Center of Microscopy of the Universidade Federal de Minas Gerais, Belo Horizonte, Minas Gerais, Brazil (http:// www.microscopia.ufmg.br).
Inyoite single crystal was coated with a 5 nm layer of evapo-rated Au. Secondary Electron and Backscattering Electron images were obtained using a JEOL JSM-6360LV equipment. Qualitative and semi-quantitative chemical analyses in the EDS mode were performed with a ThermoNORAN spectrometer model Quest and was applied to support the mineral characterization.
Raman microprobe spectroscopy
Crystals of inyoite were placed on a polished metal surface on the stage of an Olympus BHSM microscope, which is equipped with 10, 20, and 50objectives. The microscope is part of a Reni-shaw 1000 Raman microscope system, which also includes a monochromator, a filter system and a CCD detector (1024 pixels). The Raman spectra were excited by a Spectra-Physics model 127 He–Ne laser producing highly polarized light at 633 nm and col-lected at a nominal resolution of 2 cm1 and a precision of
±1 cm1in the range between 200 and 4000 cm1. Repeated
acqui-sitions on the crystals using the highest magnification (50) were accumulated to improve the signal to noise ratio of the spectra. Raman Spectra were calibrated using the 520.5 cm1line of a
sili-con wafer. The Raman spectrum of at least 10 crystals was col-lected to ensure the consistency of the spectra.
Infrared spectroscopy
Infrared spectra were obtained using a Nicolet Nexus 870 FTIR spectrometer with a smart endurance single bounce diamond ATR cell. Spectra over the 4000–525 cm1 range were obtained
by the co-addition of 128 scans with a resolution of 4 cm1and a
mirror velocity of 0.6329 cm/s. Spectra were co-added to improve the signal to noise ratio.
Spectral manipulation such as baseline correction/adjustment and smoothing were performed using the Spectracalc software package GRAMS (Galactic Industries Corporation, NH, USA). Band component analysis was undertaken using the Jandel ‘Peakfit’ soft-ware package that enabled the type of fitting function to be selected and allows specific parameters to be fixed or varied accordingly. Band fitting was done using a Lorentzian–Gaussian cross-product function with the minimum number of component bands used for the fitting process. The Gaussian–Lorentzian ratio was maintained at values greater than 0.7 and fitting was under-taken until reproducible results were obtained with squared corre-lations ofr2greater than 0.995.
Results and discussion
Mineral characterization
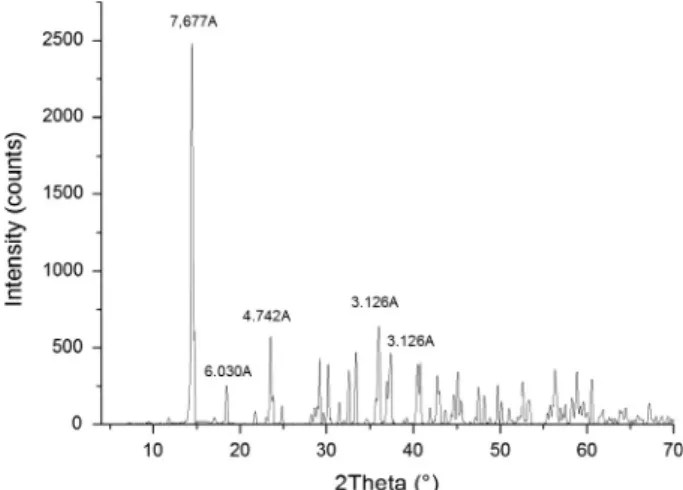
X-ray powder diffraction data (Fig. 1) show monoclinic symme-try with space groupP21/a. Unit cell parameters are:a= 10.63 Å;
b= 12.06 Å;c= 8.405 Å;b= 114.03°andZ= 4, which are in agree-ment with published data[9].
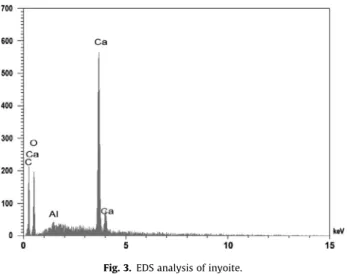
The SEM image of inyoite sample studied in this work is shown inFig. 2. The sample corresponds to needle like cleavage fragment up to 2.0 mm. The SEM image shows a homogeneous phase. Qual-itative chemical analysis gave Ca as the major element. The pres-ence of C is related to the carbon coating (Fig. 3).
Thermogravimetric analysis
The TGA and DTG curves for the mineral inyoite are shown in Fig. 4. Two mass-loss events occur at 111°C and 129°C (33.0%)
with a further mass loss at 403°C (10.0%). It is proposed that the mass losses at 111°C and 129°C are due to the removal of water and the mass loss at 403°C is attributed to the loss of the hydroxyl units. The theoretical mass losses using a molecular mass of 278 is 25.96% for the water mass loss step and 6.1% for the loss of the hydroxyls.
The following reactions are proposed:
CaðH4B3O7ÞðOHÞ 4H2O!CaðH4B3O7ÞðOHÞ þ4H2O 2CaðH4B3O7ÞðOHÞ !2CaðH4B3O8Þ þH2O
The values of the experimental results are less than the exper-imental values. One possibility is that there is a greater amount of water present.
Vibrational spectroscopy
The Raman spectrum of inyoite over the 4000–100 cm1
spec-tral range is reported inFig. 5a. The spectrum shows complexity with many bands being observed. This figure shows the position and relative intensities of the Raman bands. It is noteworthy that there are large parts of the spectrum where no intensity is observed. The Raman spectrum is therefore subdivided into sec-tions depending upon the type of vibration being analysed. The infrared spectrum of inyoite over the 4000–500 cm1 spectral
range is displayed in Fig. 5b. The spectrum is not shown below 500 cm1. The reason for this is that we are using a reflectance
technique and the ATR cell absorbs all incident radiation. There are parts of this infrared spectrum where little or no intensity is observed. This spectrum may be thus subdivided into sections depending upon the type of vibration being analysed.
The Raman spectrum of inyoite over the 1450–850 cm1
spec-tral range is illustrated inFig. 6a. The Raman spectrum in this spec-tral region is dominated by a sharp intense band at 910 cm1. On
the high wavenumber side of this band, bands of significantly les-ser intensity are obles-served at 925, 957, 971, 1013, 1048 and 1062 cm1with a broad band at 1204 cm1. The Raman band at
910 cm1is assigned to the BO stretching vibration of the B 4O10
units. It is probable that there at least 13 BO stretching vibrations based upon a B4O10unit. Whether all these vibrations are
coinci-dent are not known but it is likely. The width of the symmetric stretching vibration in the Raman spectrum suggests that these vibrational modes of the BO stretching vibrations are coincident. Further, the existence of two isotopes, also complicates the situa-tion. The nominal resolution of the Raman spectrometer is of the order of 2 cm1and as such is sufficient enough to identify
sepa-rate bands for the stretching bands of the two boron isotopes. The two reduced masses for a pure B–O stretching mode would be (10x16)/(10 + 16) = 6.154 for 10-B and (1116)/(11 + 16) = 6.518 for 11-B. The wavenumber is inversely proportional to square root of reduced mass; so the isotopic wavenumber ratio should be the sqrt(6.518/6.154) = 1.03. 10-B is about 20% of natural boron, so a mode that is mostly B–O stretching and that includes significant motion of the B atom (not a breathing mode of a BO3
tri-gonal planar unit or a BO4tetrahedral unit) should show a large
peak for 11-B and a smaller peak at higher wavenumber for 10-B. For example if the sharp Raman peak at 925 inFig. 3a is from the 11-B component such a mode, then it should have a smaller 10-B satellite near (1.03)(925) = 952 cm1, and indeed a small
Fig. 2.Backscattered electron image (BSI) of an inyoite single crystal up to 1.0 mm in length.
Fig. 3.EDS analysis of inyoite.
Fig. 4.Thermogravimetric analysis of inyoite. Fig. 5a.Raman spectrum of inyoite (upper spectrum).
peak at 955 is observed in the figure. Similar small, higher wave-number bands are also shown in this figure associated with peaks at 1013 and 1062 cm1.
The Raman bands at 980, 1013, 1032, 1088, 1140, and 1323 cm1are attributed to the BOH in-plane bending modes. It
is not known to what the very broad band at 1204 cm1is
attrib-uted. Iliev et al. determined the Raman spectrum of a synthetic cobalt boracite [14]. The symmetry species of some vibrational modes were determined. These researchers[15]used Raman imag-ing to show the ferroelectric properties of boracite type com-pounds. These workers [15] showed that boracites exhibit a sequence of transitions from the high temperature paraelectric cubic phase to ferroelectric orthorhombic, monoclinic, trigonal phases, and finally to a monoclinic phase at low temperatures where both ferroelectric and magnetic orders coexist. Kim and Somoano determined the improper ferroelectric transition using Raman spectroscopy [16]. On the low wavenumber side of the 1039 cm1 peak, Raman bands with significant intensity are
observed at 825 and 925 cm1. These bands may be attributed to
the antisymmetric stretching modes of tetrahedral boron. The detailed infrared spectrum over the 1050–650 cm1
spec-tral range is provided inFig. 6b. This spectrum displays complexity with many bands being observed. The series of infrared bands at 924, 955, 980 and 1007 cm1are attributed to the trigonal borate
antisymmetric stretching modes. The infrared band at 955 cm1is
assigned to the BO stretching mode, the equivalent to the Raman band at 910 cm1. The series of infrared bands from 677 through
to 869 cm1 are related to trigonal borate bending modes. The
infrared bands at 1032, 1076 and 1161 cm1are assigned to BOH
deformation modes. The infrared bands at around 792 and 804 cm1are assigned to water librational modes[17–19].
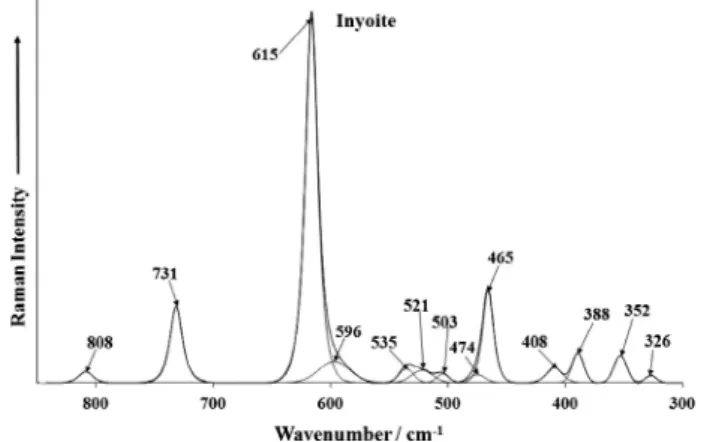
The Raman spectra in the 900–300 cm1 and in the 300–
100 cm1spectral ranges are shown inFig. 7. Four sharp Raman
bands are observed at 390, 599, and 739 cm1. These bands are
simply defined as trigonal and tetrahedral borate bending modes. A series of Raman bands at 160, 172, 182, 192, 206, 258 and 268 cm1(Fig. 7b) are due to lattice modes.
The Raman spectrum of inyoite in the 3800–2600 cm1spectral
range is reported inFig. 8a. The infrared spectrum of inyoite in the 3800–2500 cm1spectral range is reported inFig. 8b. The formula
of inyoite Na2B4O6(OH)2H2O is such that both water and hydroxyl
stretching bands would be expected in both the Raman and infra-red spectra. The difficulty is which band is attributable to which vibration. In the normal course of events, the hydroxyl stretching vibrations occur at higher wavenumbers than the water stretching wavenumbers[20–23]. Further, the widths of the hydroxyl stretch-ing vibrations are narrow compared with the width of the water bands. A sharp Raman band observed at 3444 cm1are
superim-posed upon some broad bands at 2828, 3153 and 3389 cm1. It is
likely that these latter three bands are attributable to water stretching vibrations. The first band is attributed to the stretching vibrations of the hydroxyl units. The Raman bands observed in the Raman spectrum are also observed in the infrared spectrum at 2996, 3109, 3240, 3332, 3403, 3446, 3503 and 3535 cm1. These
infrared bands are ascribed to the stretching vibrations of the water and hydroxyl units. The sharp infrared band at 3535 cm1
is assigned to the stretching vibrations of hydroxyl units. Fig. 5b.Infrared spectrum of inyoite (lower spectrum).
Fig. 6a.Raman spectrum of inyoite (upper spectrum) in the 1450–850 cm1 spectral range.
Fig. 6b.Infrared spectrum of inyoite (lower spectrum) in the 1050–650 cm1 spectral range.
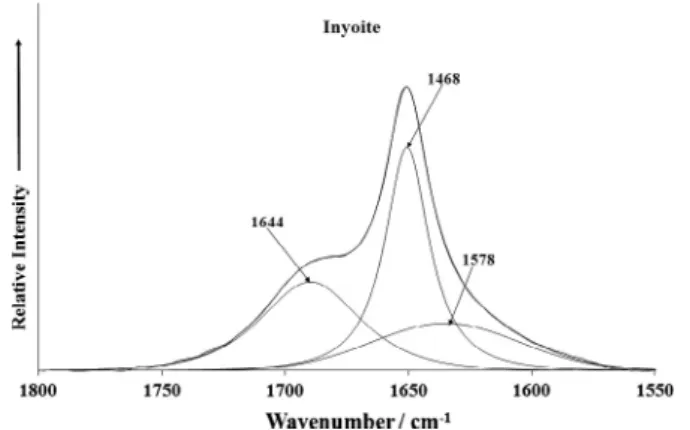
The Raman spectrum of inyoite in the 1800–1500 cm1spectral
range is reported inFig. 9a. The infrared spectrum of inyoite in the 1800–1550 cm1spectral range is reported inFig. 9b. Raman bands
are found at 1656 and 1689 cm1and are assigned to water
bend-ing vibrations. The observation of two bands is in harmony with the number of water stretching vibrations. The two bands indicate water with different hydrogen bonding. The position of the bands indicates very strong hydrogen bonding in the mineral inyoite. In the infrared spectrum bands are found at 1468 and 1644 cm1.
This latter band is in harmony with the Raman bands and indicates water bending modes associated with strong hydrogen bonding.
Conclusions
There are many borate containing minerals which have yet to have their vibrational spectra measured and the molecular struc-ture assessed in terms of their vibrational spectra. In this work we have measured the Raman and infrared spectrum of inyoite, a borate containing mineral. The importance of the mineral inyoite rests with the chemistry of the compound and the potential to syn-thesize nanomaterials based upon polymerization of borate units. Such compounds have the potential to make especially selected ferroelectric, pyroelectric and piezoelectric properties. The mineral inyoite is a precursor for the synthesis of such nanomaterials.
The inyoite sample studied in this work is from the Salar del Hombre Muerto, La Puna Plateau, Salta Province, Argentina. The borate mineral inyoite has been characterized by a range of com-plimentary techniques including X-ray diffraction, scanning elec-tron microscopy, energy dispersive X-ray spectroscopy, thermal analysis and Raman spectroscopy at ambient temperatures compli-mented with infrared spectroscopy. Tentative assignments are made based upon the position and intensity of the infrared and Raman bands. Two boron isotopes are known namely 10-B and 11-B. The 10-B is around 20% in concentration compared with 11-B. The Raman spectrum shows a large peak for 11-B and a smal-ler peak at higher frequency for 10-B. The sharp Raman peak at 932 cm1is from the 11-B component such a mode, then it should
have a smaller 10-B satellite near (1.03)(932) = 980 cm1, and
indeed a low intensity peak at 980 cm1is observed.
Fig. 7b.Raman spectrum of inyoite (lower spectrum) in the 300–100 cm1spectral range.
Fig. 8a.Raman spectrum of inyoite (upper spectrum) in the 3800–2600 cm1 spectral range.
Fig. 8b.Infrared spectrum of inyoite (lower spectrum) in the 3800–2500 cm1 spectral range.
Fig. 9a.Raman spectrum of inyoite (upper spectrum) in the 1800–1500 cm1 spectral range.
Fig. 9b.Infrared spectrum of inyoite (lower spectrum) in the 1800–1550 cm1 spectral range.
Acknowledgments
The financial and infra-structure support of the Discipline of Nanotechnology and Molecular Science, Science and Engineering Faculty of the Queensland University of Technology, is gratefully acknowledged. The Australian Research Council (ARC) is thanked for funding the instrumentation. The authors would like to acknowledge the Center of Microscopy at the Universidade Federal de Minas Gerais (http://www.microscopia.ufmg.br) for providing the equipment and technical support for experiments involving electron microscopy.
References
[1]D.E. Garrett, Borates – Handbook of Deposits, Processing, Properties, and Use, Academic Press, 1998.
[2]M. Alkan, M. Dogan, Chem. Eng. Process. 43 (2004) 867–872.
[3]V. Morgan, R.C. Erd, Minerals of the Kramer borate district, California, California Division of Mines and Geology Mineral Information Service 22 (1969) 146.
[4]R.N. Alonso, Anales 35 (1999) 1907–1921.
[5]F. Risacher, B. Fritz, Central Altiplano, Bolivia, Chemical Geology 90 (1991) 211–231.
[6]W.T. Schaller, Am. Mineral. 12 (1927) 24–25.
[7]R.N. Alonso, On the origin of La Puna borates 34 (1999) 141–166. [8]C. Helvaci, R.N. Alonso, Turkish J. Earth Sci. 9 (2000) 1–27. [9]J.R. Clark, Acta Crystallogr. 12 (1959) 162–170.
[10]I. Waclawska, J. Alloys Compd. 244 (1996) 52–58.
[11]J.C. Turner, En Puna, in: A.F. Leanza (Ed.), Primer Simposio de Geología Regional: Academia Nacional de Ciencias, Córdoba, Argentina, 1972, pp. 91– 116.
[12] R.N. Alonso, J.Y. Viramonte, R. Gutiérrez, Puna Austral. Bases para el subprovincialismo geológico de la Puna argentina. 9°Congreso Geológico Argentino, Actas 1 (1984) 43–63 Bariloche.
[13]D. Vivante, R.N. Alonso, Revista de la Asociación Geologica Argentina 61 (2006) 286–297.
[14]M.N. Iliev, V.G. Hadjiev, M.E. Mendoza, J. Pascual, Phys. Rev. B: Condensed Matter. Mater. Phys. 76 (2007). 214112/214111-214112/214115.
[15]M.N. Iliev, V.G. Hadjiev, J. Iniguez, J. Pascual, Acta Physica Polonica, A 116 (2009) 19–24.
[16]Q. Kim, R.B. Somoano, Ferroelectrics 36 (1981) 431–434.
[17]D.W. James, R.F. Armishaw, R.L. Frost, Austr. J. Chem. 31 (1978) 1401–1410. [18]D.W. James, R.L. Frost, J. Chem. Soc., Faraday Trans. 1: Phys. Chem. Condensed
Phases 74 (1978) 583–596.
[19]D.W. James, R.F. Armishaw, R.L. Frost, J. Phys. Chem. 80 (1976) 1346–1350. [20]R.L. Frost, Y. Xi, Spectrochim. Acta A Mol. Biomol. Spectrosc. 103 (2013) 151–
155.
[21]R.L. Frost, A. Lopez, Y. Xi, R. Scholz, G.M.d. Costa, F.M. Belotti, R.M.F. Lima, Spectrochim. Acta, Part A 114 (2013) 27–32.
[22]R.L. Frost, Y. Xi, R. Scholz, F.M. Belotti, M. Candido, J. Mol. Struct. 1037 (2013) 23–28.