Article
J. Braz. Chem. Soc., Vol. 24, No. 11, 1832-1839, 2013. Printed in Brazil - ©2013 Sociedade Brasileira de Química 0103 - 5053 $6.00+0.00
A
*e-mail: [email protected]
Cold-Induced Aggregation Microextraction Technique based on Ionic Liquid for
Preconcentration and Determination of Nickel in Food Samples
Bahram Ebrahimi,a Soleiman Bahar*,b and Seyde Elham Moedib
aDepartment of Chemistry, Faculty of Sciences, Sanandaj Branch, Islamic Azad University,
Sanandaj, Islamic Republic of Iran
bDepartment of Chemistry, Faculty of Sciences, University of Kurdistan,
PO Box 416, Sanandaj, Islamic Republic of Iran
Este trabalho descreve a determinação de níquel em amostras de alimentos e de água usando microextração com agregação induzida à frio e determinação por espectrofotometria UV-Vis. A extração de níquel (II) foi feita na presença de dimetilglioxima (DMG) como agente complexante e hexafluorofosfato de sódio (NaPF6) foi adicionado às amostras contendo pequenas quantidades de 1-hexil-3-metilimidazol hexafluorofosfato [Hmim][PF6] como solvente extrator. Os parâmetros que governam a eficiência da extração, como o líquido iônico, o pH, a temperatura e a força iônica, foram otimizados. O método foi aplicado para a determinação de baixas concentrações de níquel em diferentes tipos de vegetais. Nas condições otimizadas a curva analítica mostrou-se linear no
intervalo de concentração de 8-200 ng mL-1 apresentando coeficiente de correlação (r2) de 0,9996.
O limite de detecção (LOD) calculado foi de 0,47 ng mL-1 com fator de enriquecimento de 186.
O desvio padrão relativo (RSD) foi de 3,7% para 40 ng L-1 de níquel (n = 10).
The determination of nickel in food samples and well water using cold induced aggregation microextraction combined UV-Vis spectrophotometry is described. The extraction of nickel was performed in the presence of dimethylglyoxime (DMG) as the complexing agent. In this method,
sodium hexafluorophosphate (NaPF6) was added to the sample solution containing small amounts of
1-hexyl-3-methylimidazolium hexafluorophosphate [Hmim][PF6] as extraction solvent. Parameters
governing the extraction efficiency such as amount of ionic liquid, pH, temperature and ionic strength were optimized. The applicability of the technique was evaluated by the determination of trace nickel in different types of vegetables. Under the optimum conditions, the calibration curve
was linear in the concentration range 8-200 ng mL-1 with correlation coefficient (r2) of 0.9996.
The limit of detection (LOD) of 0.47 ng mL-1 and enhancement factor of 186 were obtained for
nickel. The relative standard deviation (RSD) was 3.7% for 40 ng L-1 nickel (n = 10).
Keywords: ionic liquid, cold induced aggregation microextraction, nickel determination, UV-Vis spectrophotometry, vegetables
Introduction
The toxicity and effect of trace heavy metals on human health and the environmental have drawn considerable attention and concern in recent years. The main sources of nickel in aquatic systems are industrial processes, atmospheric fall out, biological cycles, and the dissolution of rocks and soil. However, food and water are the only possible sources of nickel for humans.1,2 Therefore, the
determination of nickel in drinking water and foods is
very important for public health. The traditional analytical techniques such as UV-Vis spectrophotometry, for the determination of trace elements often suffer from its low sensitivity, hence the determination of trace amounts of heavy metals in environmental samples like natural water and vegetables which are usually found at very low concentrations, requires the use of preconcentration methods coupled to spectroscopic methods.3-5
The most widely used techniques for separation and preconcentration of Ni are liquid-liquid extraction (LLE),6,7 coprecipitation,8 ion exchange,9 solid-phase
satisfactory results can be obtained with the above mentioned separation/preconcentration techniques, they have some drawbacks such as large consumption of reagent, low enrichment factor, multistage operation and lengthy separation.
Modern trends in analytical chemistry are towards the simplification and miniaturization of sample preparation, as well as the minimization of the used organic solvent. A new mode of liquid-phase microextraction (LPME) named dispersive liquid-liquid microextraction (DLLME) which is based on ternary component solvent system, such as cloud point extraction (CPE) and homogeneous liquid-liquid extraction (HLLE), as high performance, rapid and inexpensive microextraction method has been proposed.13 DLLME has been successfully applied to
the preconcentration of several families of organic14-19
and inorganic species,20-22 prior to analysis with gas
chromatography (GC), GC-mass spectrometry (GC-MS), high-performance liquid chromatography (HPLC), UV-Vis spectrophotometry and atomic absorption spectrophotometry (AAS).
Room temperature ionic liquids (RTILs) with negligible vapor pressure and good selective solubility have aroused increasing interests for their promising role as alternative solvents in synthesis, separation and electrochemistry.23
They are considered to be green solvents due to their negligible vapor pressure, good thermal stability, very wide liquid phase range and good dissolving and extracting abilities.24-26 They have been recently used with success
as replacement solvents to separate organic compounds,27
biologically important molecules27,28 and metal ions.29,30
Several efforts have been made based on extraction with an ionic liquid, such as ionic liquid-based headspace liquid phase microextraction,31 ionic liquid-based single-drop
microextraction32-34 and temperature-controlled ionic liquid
dispersive liquid phase microextraction.35,36 These methods
present outstanding figures of low consumption of volatile organic solvents and high enrichment factors. Another useful method, which is termed cold-induced aggregation microextraction (CIAME) and is based on the use of ILs for homogeneous liquid-liquid microextraction (HLLME), was developed by Baghdadi and Shemirani in 2008,37
and further modified in 2010.38 The mechanism of this
method is very similar to that of DLLME, but the dispersal is accomplished by temperature-dependent dissolution instead of injection. In this method, a suitable temperature is used to fully dissolve the room temperature IL in the sample solution without the use of disperser solvent.39
Both CIAME and DLLME methods have their merits. In comparison with CIAME, IL-based DLLME is more efficient and convenient for dispersing the room
temperature ILs throughout the sample, thus significantly reducing the extraction time and improving the recovery. However, because the IL solubility in water can change considerably with changes in temperature, the IL-CIAME extraction process (which involves cooling) can require more IL than the DLLME extraction process, not involving cooling when the initial volume of IL is the same.
In this study, the CIAME method was applied for sensitive and reasonably selective determination of nickel(II) in food and water samples using UV-Vis spectrophotometry technique. The effects of various experimental parameters on the extraction were also investigated.
Experimental
Reagents
All reagents and solvents such as NiNO3,
dimethyl-glyoxime (DMG), ethanol, acetone, sodium hydroxide, sodium nitrate, nitric acid, hydrochloric acid, Triton X-114 (octylphenoxy polyethoxyethanol) and sodium hexafluorophosphate (NaPF6) were highly purified reagents
produced in Merck Co. (Darmstadt, Germany). 1-Hexyl-3-methylimidazolium hexafluorophosphate [Hmim][PF6]
ionic liquid was produced in Kimiaexir (Iran). Deionized water (1-10 MΩ cm) obtained from a Labconco system (Labconco Co., Kansas City, USA) was used throughout this work. A stock standard solution of 1000 µg mL-1
Ni(II) was prepared by the dissolution of the proper amount of NiNO3 in HNO3 (pH 2). Solutions of lower
concentrations were prepared daily by a suitable dilution of the stock solution with deionized water. A buffer solution (0.1 mol L-1) was prepared by dissolving the appropriate
amount of sodium dihydrogen phosphate (NaH2PO4.2H2O)
(Merck) in deionized water and adjusted to pH 7.0 by adding the diluted HCl and HNO3 solutions. The solution
of dimethylglyoxime (2 × 10⁻⁴ moL L-1) was prepared by
dissolving the appropriate amount of this reagent in the ethanol. A solution of 100 mg mL-1 NaPF
6 was prepared
by dissolving appropriate amount of NaPF6 in deionized
water. The viscosity of IL was high and their handling was difficult, so working solution ([Hmim][PF6], 0.8 mg L-1)
was prepared in acetone. In the experiments, vessels were kept in 10% nitric acid for at least 24 h and subsequently washed with the deionized water.
Apparatus
the spectra and measure the absorbance. A PHS-25CW microprocessor pH/mV meter, equipped with a combined glass-calomel electrode, was used for determining pH values and a laboratory centrifuge (Heraeus, Labofuge 400 model, Germany) was used to accelerate the phase separation.
General analytical procedure
A volume of 10 mL of sample or standard solution containing Ni(II), adjusted in pH 7 using phosphate buffer, was transferred to a 20 mL conical-bottom glass centrifuge tube. Then, 0.2% m/v NaNO3, 50 µL of a
mixture (2 × 10⁻⁴ mol L-1 dimethylglyoxime, 0.04% v/v
Triton X-114, 55 mg of IL ([Hmim][PF6] as extraction
solvent) and 45 µL of the solution containing sodium hexafluorophosphate using a Hamilton syringe were rapidly injected into the above mentioned aqueous sample. After shaking, it was kept in a thermostated bath at 50 oC for 4 min. Then, the tube was cooled in an ice
bath for a certain time and a cloudy solution was formed. Subsequently, the cloudy solution was centrifuged for 6 min at a centrifugation rate of 3500 rpm. As a result, the fine droplets of IL settled at the bottom of the tube. The upper aqueous phase was removed with a microsyringe, and the IL phase was dissolved in 150 µL of ethanol and transferred to quartz microcell. The absorbance of the complex was measured at 563 nm.
Preparation of real samples
Samples of cabbage, mint and spinach were bought from a supermarket in Sanandaj city (Iran). All the samples were stored in polythene bags according to their type and brought to the laboratory for preparation and treatment. After washing the vegetables with distilled water, 2.0 g of each sample were ground, homogenized and dried at 80 oC.
Then, each of them was digested with 10 mL concentrated nitric acid at 130 °C for approximately 4 h. After cooling, 5 mL of 30% (v/v) hydrogen peroxide were added and heated up to drying stage. Finally, the digest was cooled and quantitatively transferred to a 50 mL volumetric flask for analysis. A volume of 10 mL of this solution was transferred into a 50 mL volumetric flask and analyzed by the proposed procedure.40
Well water samples were collected in polytetra-fluoroethylene (PTFE) containers from the section of Sanandaj city. These water samples were filtered using 0.45 µm pore size membrane filter to remove suspended particulate matter. All the water samples were stored in a refrigerator in the dark before analysis.
Optimization of theCIAME sample preparatiom method
In the present study, for higher sensitivity, selectivity and precision of nickel determination, the CIAME method combined with UV-Vis spectrophotometer technique, after selecting the maximum wavelength of nickel complex, the effect of the main parameters (like the amount of ionic liquid, sample acidity, amount of chelating agent, sample ionic strength and extraction time), was studied and optimized.
The precision of the method was calculated as the relative standard deviation (RSD) of 10 independent measurements, carried out using 40 µg L-1 nickel. In order
to define the linear dynamic range (LDR) of method, eight sample solutions of Ni(II) with different concentrations were extracted under the optimized conditions. After extraction, the IL phase was dissolved in 150 µL of ethanol and absorbance signals were measured. The limit of detection is defined as 3Sb/m (where Sb is standard deviation
of the blank and m is the slope of the calibration graph). The enhancement factor (EF) is calculated as the ratio of the slope of preconcentrated samples using CIAME to that obtained without preconcentration.
Maximum wavelength of complex
To obtain the maximum wavelength of nickel complex, a solution of (10 mL, 0.01 µg mL-1, pH 7) of nickel cation
was taken for extraction with DMG ligand in ethanol (10 mL, 0.02 mol L-1). Absorption spectra corresponding to
the complex in ethanol in the range 300-900 nm were taken.
Sample acidity and DMG concentration
Among chemical variables, sample acidity, which was defined by the pH of the sample solution, played a significant role in the overall performance of the solvent extraction and affects the complex formation and the extraction efficiency. The effect of the pH on the absorbance was studied in the range of 2-12 by adjusting it in nickel(II) solution with phosphate buffer.
In addition, the influence of dimethylglyoxime concentration on the extraction in the range of 10-5-10-3 mol L-1 in ethanol was studied.
Amount of ionic liquid
To study the effect of extraction ([Hmim][PF6])
solvent amount, solutions containing different amounts of [Hmim][PF6] were tested. The experimental conditions
[Hmim][PF6] in the range of 40-90 mg. In addition, to
evaluate the effect of common ion, similar experiments were done in the presence of common ion. A common ion is any ion in the solution that is common to the ionic liquid being dissolved. In this study, NaPF6 was used as
a common ion source and the effect of this agent on the analytical responses was investigated.
Amount of anti-sticking agent
The effect of Triton X-114, as an anti-sticking agent, was investigated in order to overcome the adherence of the IL-phase on the wall of the centrifuge tube in the range of 0.00-0.08% (v/v).
Amount of salt
In order to investigate the influence of the ionic strength on the CIAME performance, several experiments were performed with different NaCl concentrations. Due to high solubility of NaNO3, salt effect was studied up to 30% (m/v).
Investigation of temperature
Temperature affects the partition coefficient of analytes and the solubility of ILs in water. As the temperature increases, the solubility of ILs in water also increases. Therefore, the selection of a suitable extraction temperature is necessary. To investigate this issue, nickel samples in water bath with different temperature in the range of 20-60 oC were
extracted while other conditions were kept constant.
Centrifuge conditions
Centrifugation is a necessary step to obtain two distinguishable phases in the extraction tubes. The effect of centrifugation time on the extraction efficiency was evaluated in the range of 500-3500 rpm.
Results and Discussion
Spectrophotometric study
The complex had an absorbance maximum at 563 nm while further experiments showed that DMG ligand in ethanol did not have any absorption at this wavelength, so this wavelength was chosen for the subsequent experiments.
Effect of sample pH and ligand concentration
As shown in Figure 1, the extraction recovery of nickel ion reaches a maximum in the pH ranges of 6.0-8.0. A
decrease in metal extraction efficiency at pH < 6.0 is due to the low complex formation. At pH > 8.0, the analyte is mainly present as hydroxide species, which do not form complex with the ligand. Therefore, a buffer media of pH 7.0 was chosen for the subsequent experiments.
The metal extraction efficiency as a function of the DMG concentration is shown in Figure 2. The results revealed that the extraction efficiency increased by increasing DMG concentration up to 2 × 10⁻⁴ mol L−1 and remained
nearly constant at higher concentrations. Therefore, this concentration was selected as optimum value.
Effect of ionic liquid amount
Figure 3 shows the effect of ionic liquid amount in the presence and absence of NaPF6 as a common ion source. As
can be seen, in the absence of NaPF6, minimum amount of ionic
Figure 1. Effect of pH on the absorbance of Ni-DMG complex. Utilized conditions: 10 ng mL-1 nickel, 2 × 10⁻⁴ mol L-1 dimethylglyoxime, 0.04% v/v Triton X-114, 55 mg of [Hmim][PF6] and 45 µL of sodium hexafluorophosphate.
liquid used to obtain maximum absorption was 65 mg. But, in the presence of constant NaPF6 (45 µL), this amount
reduced to 55 mg. Naturally, in the presence of excess content of salt, the solubility of the ionic liquid increases. But, according to common ion effect, solubility decreases in the presence of IL with common ion and lower amount of ionic liquid is consumed. So, 55 mg of IL and 45 µL of NaPF6 were chosen for the next steps.
Effect of anti-sticking agent
According to Figure 4, in the presence of Triton X-114, the absorbance increased up to 0.04% (v/v), and then remains approximately constant. Hence, 0.05% (v/v) was selected for the rest of the work.
Effect of salt content
In the presence of high medium salt content, the solubility of ILs increases and the phase separation
does not occur. But according to the common ion effect, solubility decreases in the presence of NaPF6. NaNO3 was
chosen in order to study the salt effect. It was shown in the presence of NaPF6 the successfully occurred phase
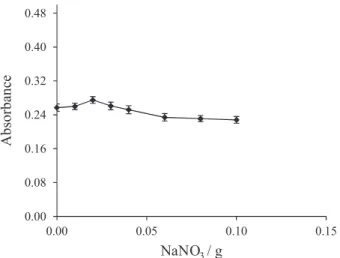
separation. Figure 5 shows the effect of salt in the range of 0-1%. Absorbance was slightly increased as a result of salting out effect. A concentration of 0.2% NaNO3
was selected for subsequent experiments to increase the recovery.
Effect of temperature
The experimental data showed (Figure 6) that in the range of 20-40 °C the absorbance increased due to increasing of analyte partition coefficient. But at temperatures higher than 50 °C, absorbance slightly Figure 3. Effect of IL amount and common ion on the absorbance
of Ni-DMG complex. Utilized conditions: 10 ng mL-1 nickel, pH 7, 2 × 10⁻⁴ mol L-1 dimethylglyoxime, 0.04% v/v Triton X-114 and 45 µL of sodium hexafluorophosphate.
Figure 4. Effect of Triton X-114 on the absorbance of the complex. Utilized conditions: 10 ng mL-1 nickel, 2 × 10⁻⁴ mol L-1 dimethylglyoxime, pH 7, 55 mg of [Hmim][PF6] and 45 µL of sodium hexafluorophosphate.
Figure 5. Effect of NaNO3 on the absorbance of the complex. Utilized conditions: 10 ng mL-1 nickel, 2 × 10⁻⁴ mol L-1 dimethylglyoxime, pH 7, 0.04% v/v Triton X-114, 55 mg of [Hmim][PF6] and 45 µL of sodium hexafluorophosphate.
decreased because of ionic liquid solubility. In the range of 40-50 °C, absorbance was constant, hence, a temperature of 50 °C was selected for the rest of the work.
Effect of centrifuge conditions
It was found that over 3000 rpm, IL-phase completely settled, so the rate of 3500 rpm was selected as the optimum point. At the optimum rate, the absorbance was investigated as a function of centrifugation time. The maximum absorption was achieved after 6 min, and no significant variation was observed when the time exceeded 6 min. Therefore, a time of 6 min was selected as optimum centrifugation time for subsequent experiments.
Interferences
After selecting the optimum conditions, effects of common coexisting ions on the recovery of nickel were studied by spiking appropriate amounts of the relative ions to the solutions containing 100 ng mL-1 nickel, which
were treated according to the recommended procedure. Ni recovery was almost quantitative in the presence of other species with tolerance limits indicated in Table 1. The tolerance limit was defined as the concentration of added ion causing less than ± 5% relative error. As can be seen, some cations, such as iron (II), palladium (II) and silver, may interfere with the determination of nickel(II) at 100:1 ratio. It was shown that the presence of most metals and anions, such as chloride, bromide, iodide, acetate and sulfate, did not have any adverse effects on the extraction efficiency.
Analytical performance
The performance of this method was investigated under optimized conditions. Excellent linearity was observed over the concentration range of 8-200 ng mL-1 for nickel with
favorable coefficient of correlation (r2) 0.9996. EF of nickel
was as high as 186. The repeatability study was carried out by extracting spiked water samples at a concentration level of 40 ng mL-1 nickel, and RSD was 3.7% (n = 10).
The limit of detection (LOD), based on a signal-to-noise ratio (S/N) of 3, was 0.47 ng mL-1. These results confirm
that the method is sensitive and stable, and may facilitate the analysis of nickel at trace levels.
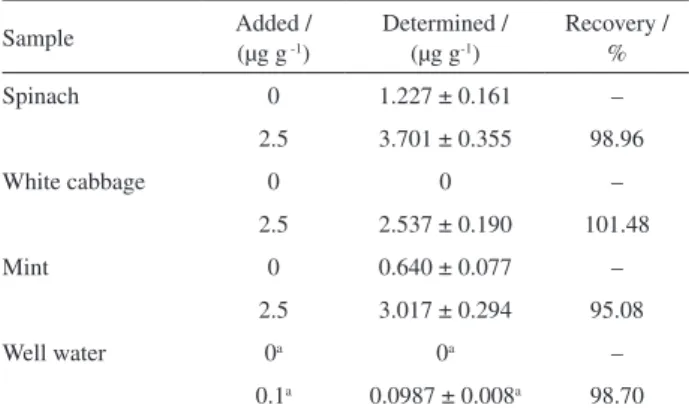
Real samples analysis
The proposed methodology was applied for the analysis of nickel in different real samples such as mint, white cabbage, spinach and well water by CIAME as a prior step to its determination by flame atomic absorption spectrophotometry (FAAS). No concentration of well water and white cabbage samples was detected. The results, along with the recovery for the spiked samples to assess matrix effects, are given in Table 2. The recoveries for the addition of Ni to all the samples were in the range of 95.08-101.48%. These results demonstrated that matrices of these samples, in our present context, had little effect on CIAME of nickel. To more verity the accuracy of the proposed procedure, Ni ion was also determined in two vegetable samples by LLE-FAAS method.41 The results for this test (Table 3), using t-test
at 95% confidence interval, showed that there is not any significant statistical difference between the obtained results. These results demonstrated that the proposed method could be satisfactorily used for the analysis of real food samples.
Table 1. Tolerance limits of diverse ions on the determination of Ni(II) (100 ng mL-1) using CIAME method
Diverse ion Diverse ion:Ni ratio
Cation
Zn2+, Cu2+, Co2+, Cr3+ 1000:1
Ca2+, Hg2+, Al3+, Pb2+, Mn2+, Mg2+, Cd2++ 1500:1
Fe2+, Pd2+, Ag+ 100:1
Anion
Cl–, Br–, CH3COO–, SO42-, I− 1500:1
Table 2. The analytical results (mean ± SD, n = 3) for determination of Ni(II) in real food samples
Sample Added /
(µg g -1)
Determined / (µg g-1)
Recovery / %
Spinach 0 1.227 ± 0.161 –
2.5 3.701 ± 0.355 98.96
White cabbage 0 0 –
2.5 2.537 ± 0.190 101.48
Mint 0 0.640 ± 0.077 –
2.5 3.017 ± 0.294 95.08
Well water 0a 0a –
0.1a 0.0987 ± 0.008a 98.70
a(µg mL-1). SD: standard deviation.
Table 3. Analytical results for determination of Ni(II) by the proposed and LLE method
Sample CIAME ± SD /
(µg g-1) (n = 3)
LLE ± SD / (µg g-1) (n = 3)
Spinach 1.227 ± 0.161 1.157 ± 0.226
Mint 0.640 ± 0.077 0.690 ± 0.064
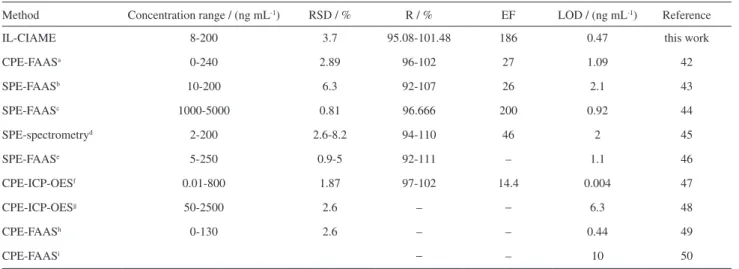
Comparison of CIAME with other methods
The determination of nickel in the water samples by cold-induced aggregation microextraction and spectrophotometric detection was compared with other methods and the results are shown in Table 4. As can be seen, the LOD value of the CIAME spectrophotometry using only 10 mL of the sample is better than that of other methods and this method is robust against high medium salt content. All these results indicate that CIAME is a reproducible, simple and low cost technique that can be used for the preconcentration of metal ions like nickel from water and food samples.
Conclusions
In this study, IL-CIAME method in combination with UV-Vis spectrophotometry was used for the determination of nickel in food and water samples. The method presented here has a high enhancement factor, acceptable recovery, good repeatability and a wide linear range for the determination of nickel. When compared to other methods, this extraction method reduces the danger of exposure to toxic solvents, used for extraction in conventional extraction procedures, it also requires a shorter extraction time. The limit of detection using only 10 mL of sample is better than that of other methods and this method is robust against high medium salt content.
References
1. Hu, G.; Deming, R. L.; Anal. Chim. Acta 2005, 535, 237. 2. Yaman, R. L.; Anal. Biochem. 2005, 339, 1.
3. Cerutti, S.; Martinez, L. D.; Wuilloud, R. G.; Appl. Spectrosc. Rev. 2005, 40, 71.
4. Aktas, Y. K.; Ibar, H.; J. Indian Chem. Soc. 2004, 81, 942. 5. Wei, Q.; Du, B.; Wu, D.; Zhang, H.; Li Y.; Ou, Q. Y.; Chin. J.
Anal. Chem. 2004, 32, 1509.
6. Reddy, B. R.; Priya, D. N.; J. Power Sources 2006, 161, 1428. 7. Arain, M. B.; Kazi, T. G.; Jamali, M. K.; J. Hazard. Mater.
2008, 160, 239.
8. Chen, H. W.; Jin, J. C.; Wang, Y. F.; Anal. Chim. Acta 1997,
353, 181.
9. Wang, J. H.; Hansen, E. H.; Anal. Chim. Acta 2000, 424, 223. 10. Khorrami, A. R.; Naeimi, H.; Fakhari, A. R.; Talanta 2004, 64,
13.
11. Ferreira, S. L. C.; dos Santos, W. N. L.; Lemos, V. A.; Anal. Chim. Acta 2001, 445, 145.
12. Chen, J.; Teo, K.; Anal. Chim. Acta 2001, 434, 330.
13. Rezaee, M.; Assadi, Y.; Milani Hosseini, M. R.; Aghaee, E.; Ahmadi, F.; Berijani, S.; J. Chromatogr., A 2006, 1116, 1. 14. Garcia-Lopez, M.; Rodriguez, I.; Cela, R.; J. Chromatogr., A
2007, 1166, 9.
15. Leong, M. I.; Huang, S. D.; J. Chromatogr., A 2008, 1211, 8. 16. Liang, P.; Xu, J.; Li Q.; Anal. Chim. Acta 2008, 609, 53. 17. Maleki, R.; Nezhad, N. M.; Samadi, N.; Farhadi, K.; Microchim.
Acta 2009, 165, 97. Table 4. Analytical characteristics of the different extraction methods
Method Concentration range / (ng mL-1) RSD / % R / % EF LOD / (ng mL-1) Reference
IL-CIAME 8-200 3.7 95.08-101.48 186 0.47 this work
CPE-FAASa 0-240 2.89 96-102 27 1.09 42
SPE-FAASb 10-200 6.3 92-107 26 2.1 43
SPE-FAASc 1000-5000 0.81 96.666 200 0.92 44
SPE-spectrometryd 2-200 2.6-8.2 94-110 46 2 45
SPE-FAASe 5-250 0.9-5 92-111 – 1.1 46
CPE-ICP-OESf 0.01-800 1.87 97-102 14.4 0.004 47
CPE-ICP-OESg 50-2500 2.6 –
− 6.3 48
CPE-FAASh 0-130 2.6 – – 0.44 49
CPE-FAASi
− – 10 50
18. Melwanki, M. B.; Fuh, M. R.; J. Chromatogr., A 2008, 1207, 24.
19. Farajzadeh, M. A.; Bahrama, M.; Jonsson, J. A.; Anal. Chim. Acta 2007, 591, 69.
20. Shokoufi, N.; Shemirani, F.; Assadi, Y.; Anal. Chim. Acta 2007,
597, 349.
21. Zeini Jahromi, E.; Bidari, A.; Assadi, Y.; Milani Hosseini, M. R.; Jamali, M. R.; Anal. Chim. Acta 2007, 585, 305.
22. Naseri, M. T.; Milani Hosseini, M. R.; Assadi, Y.; Kiani, A.;
Talanta 2008, 75, 56.
23. Anderson, J. L.; Armstrong, D. W.; Wei, G. T.; Anal. Chem.
2006, 78, 2892.
24. Martín-Calero, A.; Ayala, J. H.; González, V.; Afonso, A. M.;
Anal. Bioanal. Chem. 2009, 394, 937.
25. Zhu, H. Y.; Cao, Z. B.; Mou, X. G.; Chem. Prod. Technol. 2006,
13, 40.
26. Gu, H.; Fang, Y. X.; Zhang, K.; Fine and Specialty Chemicals
2005, 13, 17.
27. Zhao, H.; Xia, S. Q.; Ma, P. S.; J. Chem. Technol. Biotechnol.
2005, 80, 1089.
28. Wang, J. H.; Cheng, D. H.; Chen, X. W.; Du, Z.; Fang, Z. L.;
Anal. Chem. 2007, 79, 620.
29. Sun, X. Q.; Xu, A. M.; Chen, J.; Li, D. Q.; Chin. J. Anal. Chem.
2007, 35, 597.
30. Li, Z. J.; Chang, J.; Shan, H. X.; Pan, J. M.; Rev. Anal. Chem.
2007, 26, 109.
31. Ye, C. L.; Zhou, Q. X.; Wang, X. M.; Anal. Chim. Acta 2006,
572, 165.
32. Aguilera, H. E.; Lucena, R.; Cardenas, S.; Valcarcel, M.;
J. Chromatogr., A 2008, 1201, 106.
33. Xia, L. B.; Li, X.; Wu, Y. L.; Hu, B.; Chen, R.; Spectrochim. Acta, Part B 2008, 63, 1290.
34. Zhao, F. Q.; Lu, S.; Du, W.; Zeng, B. Z.; Microchim. Acta 2008,
165, 29.
35. Zhou, Q. X.; Bai, H. H.; Xie, G. H.; Xiao, J. P.; J. Chromatogr., A
2008, 1177, 43.
36. Zhou, Q. X.; Bai, H. H.; Xie, G. H.; Xiao, J. P.; J. Chromatogr., A
2008, 1188, 148.
37. Baghdadi, M.; Shemirani, F.; Anal. Chim. Acta 2008, 13, 56. 38. Gharehbaghi, M.; Shemirani, F.; Farahani, M. D.; J. Hazard.
Mater. 2009, 165, 1049.
39. Mahpishanian, S.; Shemirani, F.; Miner. Eng. 2010, 23, 823. 40. Tokalioglu, S.; Gurbuz, F.; Food Chem. 2010, 123, 183. 41. Liang, P.; Yong-chao, Q.; Bin, H. U.; Chem. Res. Chin. Univ.
2007, 23, 399.
42. Manzoori, J. L.; Bavali-Tabrizi, A.; Microchim. Acta 2003, 141, 201.
43. Lemos, V. A.; Novaes, C. G.; Lima, A. D. S.; Vieira, D. R.;
J. Hazard. Mater. 2008, 155, 128.
44. Xie, F.; Lin, X.; Wu, X.; Xie, Z.; Talanta 2008, 74, 836. 45. Lemos, V. A.; Baliza, P. X.; Santos, J. S.; Nunes, L. S.; Jesus,
A. A. D.; Rocha, M. E.; Talanta 2005, 66, 174.
46. Ferreira, S. L. C.; Dos Santos, W. N. L.; Lemos, V. A.; Anal. Chim. Acta 2001, 445, 145.
47. Beiraghi, A.; Babaee, S.; Roshdi, M.; Microchem. J. 2012, 100, 66.
48. Silva, E. L.; Roldan, P. S.; Gine, M. F.; J. Hazard. Mater. 2009,
171, 1133.
49. Chen, J.; Teo, K. C.; Anal. Chim. Acta 2001, 434, 325. 50. Safavi, A.; Abdollahi, H.; Nezhad, M. R. H.; Kamali, R.;
Spectrochim. Acta, Part A 2004, 60, 2897.
Submitted: May 18, 2013
![Figure 1. Effect of pH on the absorbance of Ni-DMG complex. Utilized conditions: 10 ng mL -1 nickel, 2 × 10 -4 mol L -1 dimethylglyoxime, 0.04% v/v Triton X-114, 55 mg of [Hmim][PF 6 ] and 45 µL of sodium hexafluorophosphate.](https://thumb-eu.123doks.com/thumbv2/123dok_br/18997071.462538/4.892.481.822.694.943/figure-effect-absorbance-complex-utilized-conditions-dimethylglyoxime-hexafluorophosphate.webp)