R
SK FACTORS FOR
THE PERSISTENCjE
OF WILD POLIOVIRUS
TRANSMISSION IN SINALOA, MEXICO,
1984-1986’
VZctor Manud Chdenas-Ayada, 2 Hugo Vid&&-Lic6n, 3 . Hamison C. StetZeq 4 Luis Cabera-CoeZZo, 5 James S. Koopman,4
Jose’ Luis VaZdespino-G6mez,5 Cuaubthnoc Ruiz-Matus, ‘y5
Roxana GuadaZupe Vega-Ramos, 6 and Maura Muro-Am&or6
I
NTRODUCTION
The Pan American Health Organization has set the goal of elimi- nating the transmission of wild po- liovirus in the Americas by 1990. Mexi- co’s current antipolio efforts, especially a National Vaccination Day strategy adopted in 1986, are directed toward this end. The aim of this National Vaccina- tion Day strategy is to administer one dose of trivalent polio vaccine to every child under five years of age during each of two designated National Vaccination Days each year. The strategy enjoys broad
’ Based on a paper presented at the Annual Conference of the Epidemiologic Intelligence Service held in At- lanta, Georgia, USA, in April 1987. This article will also be published in Spanish in the B&tin de la Ofi- &a San‘itana Panamekana, vol. 105, 1988. . 2 Resident in Aoolied Enidemioloev. General Director- && -,.
ate of Epidemiology, ‘Ministry of Health of Mexico. Current address: National Institute of Public Health, Center for Public Health Research, Francisco de P. Miranda 177 5’ piso, Mixico, 01600, D.E. Mexico. s General Directorate of Preventive Medicine. Ministrv
of Health, Mexico City, Mexico.
4 Global Epidemic Intelligence Service, United States Centers for Disease Control, Atlanta, Georgia. USA. I General Directorate of Epidemiology, Ministry of
Health and Welfare. Mexico Citv. Mexico. ,.
6 Headquarters, Coordinated Public Health Services, Sinaloa. Mexico.
national support as well as the support of international agencies (including PAHO) and the nongovernmental service organi- zation Rotary International.
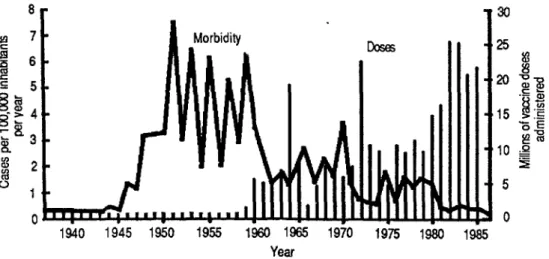
Figure 1 shows the great im-
pact that Mexico’s nationwide vaccina- tion programs have had on polio. These programs, begun in 1973, were intensi- fied in 1981. Subsequently, following the first National Vaccination Days on 18
January and 15 March 1986, the reported
annual incidence of paralytic polio de- clined from two new cases per million in- habitants in 1983-1985 to 0.8 per mil- lion in 1986.
During the first three months of 1986,ll new cases of paralytic polio in the state of Sinaloa were reported to the General Epidemiologic Directorate of Mexico’s Ministry of Health and Welfare. g An investigation was then conducted 1 that supplemented individual case stud- s ies already done in order to identify the 2 factors responsible for this high incidence .j$ of paralytic cases and to determine the 0 coverage being provided by polio vacci- B nation in this northwestern state. 2 s a,
FIGURE 1. Polio vaccinations and morbidii in Mexico, 1937-1986.
*r
1940 1945 1950 1955 1960 1965 1970 1975 1980
Year
Source: Secretariat of Health, General Directorate of Epidemiology and General Directorate of Preventive MedIcwe, Mexico
T
HE STUDY POPULATION
AND METHODS
Initially, the eleven 1986 cases
were studied individually; coverage sur- veys were conducted for about 30 chil- dren in dwellings near each case; and the clinical, epidemiologic, and laboratory diagnosis of each case was confirmed. Si- multaneously, a thorough review was made of health facility vaccination rec- ords going back over the preceding five years, and also of available epidemio- logic surveillance data on the frequency and distribution of the cases reported from 1980 to 1986-by the subjects’ age, 3
vaccination status, place of residence, and date of onset of illness.
2
..+$ Next came a coverage survey 0 designed to determine oral polio vaccina- Q a tion coverage by interviewing the moth-
2 ers and guardians of children under five
2
in the Sinaloa municipalities of Culia- can, Elota, and Guasave, and by examin- ing these children’s national vaccination cards. The three municipalities were cho-
228 sen because the numbers of polio cases
reported in them over the preceding five years indicated that they were high-risk areas. More specifically, it was decided that a cluster-sampling would be con- ducted in two stages, with the probabil- ity of selection being proportional to the size of the population in each city, town, and village covered. For this purpose, lo- calities were selected at random from among those listed in the 1980 census.
After that, dwellings within these locali- ties were selected by systematic random sampling. The requisite sample size was 630 children under five years old distrib- uted in 30 groups of 2 1. In actuality, 734 children within these 30 groups were se- lected, 678 of whom were over six months old.
Various data-including age, vaccination status, date of vaccination, and whether vaccine had been administered on a Na- tional Vaccination Day-were deter- mined for each child studied, and the source of the information (the person in- terviewed or the child’s vaccination card) was noted.
Finally, a case-control study was performed in an effort to ascertain whether vaccination history, socioeco- nomic status, residential sanitation, or certain attitudes and beliefs constituted poliovirus transmission risk factors in the same areas where the coverage survey had been conducted. The cases studied in this survey were drawn from local rec- ords, and controls were selected from among children of about the same age as the study subjects with polio ( + 3 months for the afflicted children under three years old and 2 6 months for those three to five years old). Only 18 of 30 eli- gible cases were included, because many of the afflicted children had moved or could not be found. An effort was made to obtain four controls for each case, two in homes neighboring that of the af- flicted child and two others selected at random from the list of children com- piled in the same locality for the Na- tional Vaccination Days.
The survey of attitudes and beliefs conducted as part of this effort was based on Likertt’s technique of sum- marized ranges, in which the survey sub- ject is presented with a favorable or unfa- vorable opinion on the matter involved (as if it had been expressed by a third party) and is asked whether he or she agrees or feels the opinion is true (or in some instances feels it is more or less true), or else whether he or she disagrees or feels it is not true. The options were read out in a different order for each re- spondent (I).
For purposes of conducting these two surveys, a team of 10 interview-
ers was trained in advance and supervised in the field (only half of this team was used to administer interviews in the case- control survey).
The field data obtained were recorded on preceded questionnaires, fed into a data base of the Data Base Management III computer program, and analyzed with the Statistical Package for the Social Sciences (SPSS) program. Con- tingency tables were constructed, and null hypotheses were tested by the chi- square and Fisher procedures. Coverage was assessed by calculating the point esti- mate and its 95% confidence limit. To assess the variables considered most rele- vant, an additional paired analysis was made of case and control histories. Some variables were stratified to test for con- founding variables. In addition, data on the controls were taken from the case- control study and analyzed to ascertain the distribution of test variables vis-a-vis the controls’ vaccination status. The
presence of interactions was determined (/, by loglinear models (2). Vaccine efficacy
was estimated with two models, one 2
based on the percentage of attributable ? risk (3) and the other on the model pro- 2 posed’by Smith et al. (4). The attribut-
able risk was estimated on a raw data ba- 3 (? sis (I) as well as on a matched-pair
basis (6).
SULTS
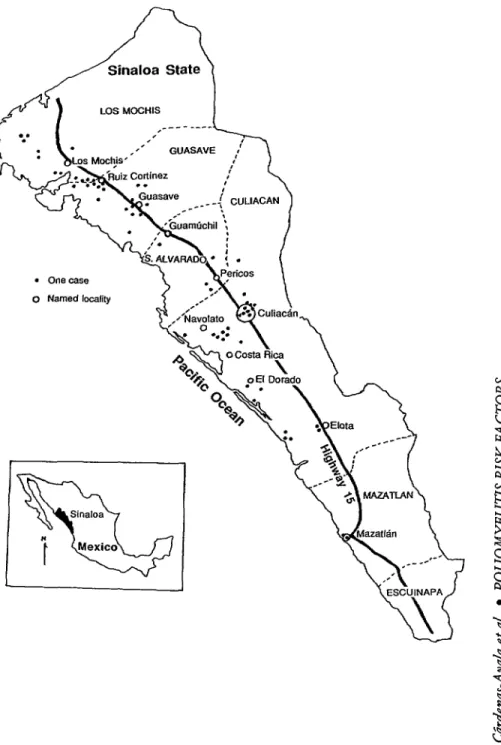
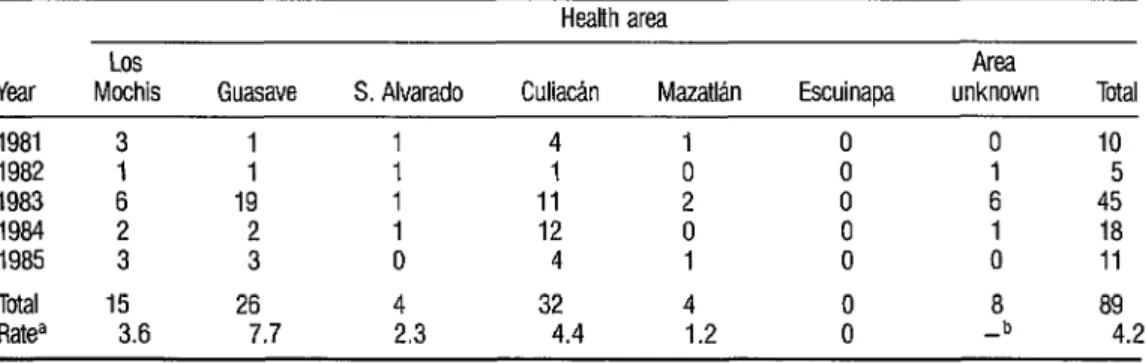
Of the probable paralytic po- lio cases reported in the state of Sinaloa from 1982 through 1985, 93.4% af- flicted children under three years old (lk ble 1). It is also noteworthy that of those children afflicted in 1983-1985, 80% had received fewer than three doses of polio vaccine (Table 2). In addition, the geographic distribution of both the 1981-1985 cases (Table 3) and the 61 1983-1985 cases mapped in Figure 2 shows pronounced clustering in certain central or northern municipalities,
TABLE 1. Probable paralytic polio cases reported in Sina- loa State, 1982-1985, by patient age.
Age of patient
(years) No.
Cases
% Cumulative %
<I 34 44.7 44.7 1 23 30.3 75.0 2 14 18.4 93.4 3 0 0 93.4 4 2 2.6 96.0 25 3 4.0 100.0 Total 76 100 100
TABLE 2. Vaccination status of patients with probable %
cases of paralytic polio reported in Sinaloa State, 1983- 2
1985. -
s Cases
2 Vaccination status Cumulative .s (No. of doses received) No. % %
9,
2 0 23 33.3 33.3 ?I - 2 1 16 16 23.2 23.2 79.7 56.5 3 3 IO 14.5 94.2 n, >3 4 5.8 100.0 Total 6ga 100 100 230 “The vaccination status of three cd the 72 repxted cases IS unknown.
mostly in ones that were readily accessi- ble and had over 2,500 inhabitants (see Figure 2). Overall, the rates in Table 3 show that far higher numbers of proba- ble cases per 100,000 inhabitants were reported in the municipalities of Guasave and Culiacan than were re- ported in the southern municipality of Mazatkn.
This clustering is even more apparent within smaller local “microre- gions.” For example, Figure 3 indicates that in the 1980-1986 time frame polio cases tended to recur within the same lo- calities in the municipality of Guasave. Thus, while the municipality of Guasave contained over 700 separate “microre- gions:’ 15 (39%) of the 38 paralytic po- lio cases reported from the area in 1980-
1986 occurred in just five of these. Vaccination coverage could account for most of these local variations. For example, a review of vaccination rec- ords showed a decline of vaccination cov- erage in the municipality of Guasave from 1984 to 1985, followed by a rise of morbidity in 1986 (see Figure 3). Thus, only 1,3 11 doses of vaccine were admin- istered in Guasave in 1985-down from 3,267 in 1984. Farther south, in the lo- cality of El Dorado (municipality of Cu- liacan), there was a similar but milder decline-from 772 doses in 1984 to 400 in 1985.
FIGURE 2. A map of Sinafoa State showing 61 of the 72 pmbabfe cases of paralytic polio recorded for 1983-1966 (black dots). Eleven cases are not shown because local health records listed their residences as variable. The location of named population centers is indicated by the circles shown.
l onecase
o Named localitv
Sinaloa
Q
N tMexico
TABLE 3. Geographic distribution of probable paralytic polio cases reported in Sinaloa State by municipality 1981-1985.
Los
Year Mochis Guasave S. Alvarado 1981 3 1 1 1982 1 1 1
1983 6 19 1
1984 2 2 1 1985 3 3 0
Total 15 26 4 Ratea 3.6 7.7 2.3
aReportedcasesperlOO,OOOinhabitants per year. Vopulation size unknown.
Health area Culiatin Mazatbn
4 1 1 0 11 2 12 0 4 1
32 4 4.4 1.2
Area
Escuinapa unknown Total 0 0 IO 0 1 5 0 6 45 0 1 18 0 0 11
8 89 -b 4.2
type 1 poliovirus); but in the other eight
cases the clinical diagnosis was well estab- lished. Also, children under five years old residing near the victims’ residences were found to have poor vaccination cov- erage, with as few as 10% having re- ceived three doses of vaccine. Indeed, a low level of local coverage in surrounding areas was a feature of all 11 of the study cases.
In the municipalities of Culia- can, Elota, and Guasave, 67.8% of the 734 study children under five years old were found to have received three or more doses of oral polio vaccine (Con- fidence Interval 0.05 = 64.9-70.7%)
through the ongoing regular vaccination campaign, a percentage that rose to
91.3% (C.I..05 = 88.4~94.2%) when
vaccinations provided on the two Na- tional Vaccination Days were included. While the limited precision of estimates
based on these 734 children does not
warrant inferences about smaller areas within the localities surveyed, a fairly ob- vious correlation was observed between low coverage in some areas during the ongoing vaccination campaign and mea- ger results obtained in these same areas during National Vaccination Days (Fig- ure 4). This correlation was found to have a coefficient of 0.56 and a value of p < 0.001. As Figure 4 indicates, the clusters of children studied were placed in three groups, as follows:
l Group 1, wherein at least
90% of the children had received three or more doses of oral polio vaccine, irre- spective of supplementary vaccinations provided on National Vaccination Days; a Group 2, wherein less than 90% of the children had received three doses through the regular program, al- though at least 90% had received three doses when those provided through the National Vaccination Days were in- cluded; and
FIGURE 3. Paralytic polio cases reported in localiis within the municipality of Guasave, Sinalaa State, in 1981-1986, by reporting period.
6
Approximate time of occurrence
q Campestre
n
Alfonso G. Calderbnq
Palas Blanco~ H El Mamote El GliiSSWq
OthersFIGURE 4. Vaccination status of the groups of children surveyed in three high-risk Sfnaloa munici- pal&s (Culiidn, Oota, and Guasave) in 1986. The horizontal axis shows coverage (% receiving 2 2 3 doses) provided by the regular program, while the vertical axis shows coverage (2 3 doses) provided by the regular pmgram plus National Vaccination Days. 8
a’
90 c
0
0
0
q
0 Group 1 (290% through regular program) + Group 2 b90% with regular program
plus National Vaccination Days) 0 Group 3 (<90% with regular program
plus National Vaccination Days)
01 I I I I I I I I I 1 0 10 20 30 40 50 60 70 80 90 100
in Figure 4 fell within this group; it ap- pears that the vaccination status of these Group 3 clusters was not greatly affected by the National Vaccination Days.
Another important point is that children under one year of age were found to have a significantly higher probability of being unvaccinated (odds ratro 2.8, C.I..Os = 1.7-4.8) than other children under five years old (Table 4).
The clinical efficacy of the oral trivalent polio vaccine used in Sina- loa over the preceding three years (1984- 1986) was estimated using the aforemen- tioned WHO model. Applying the vaccination coverage estimate of 67.8 % in the municipalities of Culiacan, Elota, and Guasave, and the fact that about 30% of the eighteen 1984-1986 cases se- lected for study in those three jurisdic- tions had been completely vaccinated (I 3 doses), the model indicates that the vaccine’s efficacy was most probably be- tween 80% and 90% (Figure 5). Using Smith’s alternative model (4), vaccine ef- ficacy was found similar to that indicated by the WHO model (Table 5, footnote a). Also, both the crude and paired anal- yses estimated the attributable risk at about 60% (C.I.,,, = 31.9-81.1%), a
finding that does not differ significantly from the previously cited risk and one that provides an interpretation of the di- rect protective effect of the vaccine.
In the case-control study, the mothers or guardians of the 18 children with cases who could be located and of
63 control subjects were interviewed. Comparison of the two childhood groups’ socioeconomic levels, schooling, home sanitation, and home attitudes and beliefs showed great similarity. In- deed, the only truly important difference was found in their vaccination histories. That is, in both the crude and paired analyses (Tables 5 and 6) the likelihood of not having received three or more doses of vaccine was over five times greater for the cases than for the controls (in the crude analysis the odds ratio = 0.19, C.I.,O~ = 0.05-0.67, p < 0.01; in the paired analysis the odds ratio = 0.18,C.I.,,, = 0.05-0.56,~ < 0.0005). There was some tendency for the presence of “newcomers” (people with less than seven years’ residence in the locality or children under seven who were not born there) and also for low so- cioeconomic status to be associated with the occurrence of polio. However, strati- fication showed this same occurrence of
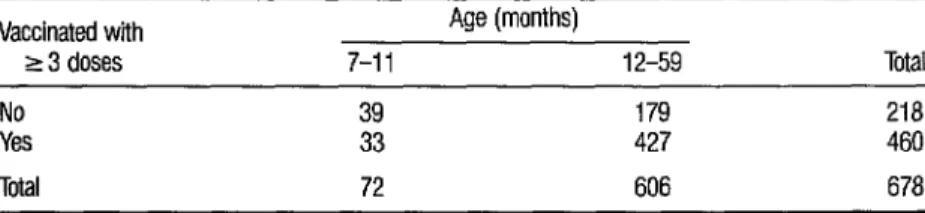
TABLE 4. A comparison of adequate polio vaccination (receipt of 2 3 doses) among the 678 cover- age survey children 7-11 months old and l-4 years old. (Children under the minimum age were excluded from this analysis.) The comparison shows a significantly higher rate of adequate vaccina- tion among the older children (odds ratio = 2.8, C.l.,05 = 1.7-4.8, p < 0.0001).
Vaccinated with
r3 doses
Age (months)
7-11 12-59 Total No 39 179 218
Yes 33 427 460
FIGURE 5. Estimated efficacy of the Sabin vaccine administered in the Sinaloa municipalities of Curitin, Elota, and Guasave, based on coverage (2 3 doses) and the proportion of polio cases vaccinated with 2 3 doses in 1984-1986.
Estimated vaccine efficacy curves
% Vaccination coverage Q 3 doses)
.SWce: Adapted from the World Health Organization Week/yEpiidernro/ogW R.?cord(O.
TABLE 5. Crude comparison of study cases and controls grouped according to whether they had mived three or more doses of polio vaccine. Sinaloa, Mexico, 19S4-19S5.a~b
Vaccination status
(B 3 doses) Cases Controls Total Vaccination completed
Unvaccinated or vaccination incomplete
Total
5 42 47 13 21 34 18 63 81
aVaccineefffcacyindicatecl by SmithSattematiiemethod (4) = 13/21-5142 = 80.8%. 13121
bOdds ratio = 0.19 (C.Lo5 = 0.05-0.67; p < 0.01).
TABLE 6. Paired comparison of polio exposure based on vaccination status of the 18 study cases and the 63 control subjects. Sinaloa, Mexico, 19S4-19B6.a
Control status
Exposed Not exposed Case status (< 3 vaccine doses) (2 3 vaccine doses) Exposed (c 3 vaccine doses) 16 27 Not exposed
(L 3 vaccine doses) 5 15 Total 21 42
aOdds ratio = 0.18 (C.Los = 0.05456; p < 0.0005).
Total 43 19 63
polio to be due to insufficient vaccina- tion. Analysis with the hierarchical log- linear model did not warrant a conclu- sion as to the presence or absence of interaction between socioeconomic status and the occurrence of polio in the com- munities involved.
Once it had been established that the vaccine being administered had reasonable clinical efficacy and that the factor generating the greatest risk of de- veloping poliomyelitis under current conditions in Sinaloa was incomplete vaccination or nonvaccination, the fac- tors influencing immunization were ex- amined. To arrive at an unbiased assess- ment, the 18 study cases were excluded from the analysis, and the variables tested were crossed with the controls’ vaccination status in the ongoing (regu- lar) campaign. (All those who had re- ceived less than three doses of vaccine were considered unvaccinated.)
Unvaccinated status was found to be associated with the following indicators of low socioeconomic status, among others: incomplete primary schooling (33% of the vaccinated sub- jects versus 68% of the unvaccinated
TABLE 7. A comparison dr risk factors potentially influencing vaccination status in vaccinated versus unvaccinated control subjects. (Vaccinated subjects had received at least three doses of vaccine; all others were placed in the unvaccinated ~9or)r)
Risk factor Parental education
5 6th grade No home refrigerator Onebedrwm home Home lacking piped water Interview subject believed
vaccinations harmful Interview subject believed
that disease is God’s punishment
Subject had never received vaccine during any of the National Vaccination Days
No. + or - for indicated risk factor among control
subjects who were:
Unvaccinated Vaccinated
+ + Odds ratio (C.l.,os) Value of p 13 6 13 26 4.3 (1.2 - 16.7) < 0.05 13
; 13 27 3.9 (1 .I - 14.1)
< 0.05 15 14 27 5.8 (1.5 - 23.2) <O.Ol 15 5 15 26 5.2 (1.3 - 20.7) <cl.01 4 15 0 39 Not calculable < 0.01 6 13 1 38 17.5 (1.7 - 134.7) co.01 4 16 1 38 9.5 (0.9 - 112.9) co.07
D
ISCUSSION
The most important factor re- sponsible for persistence of polio in the study areas is lack of vaccination (low coverage) rather than any vaccine short- coming (such as low potency attributable to defects in the cold chain). Indeed, the present data suggest that such lack of vaccination could account for the persis- tent polio problem in certain areas (re- ferred to by Mexican epidemiologists since the 1960s as “poliomyelitogenic”) where the disease has been hyper- endemic.
It is striking that even with relatively “good” vaccination coverages, such as around 70% through the regular campaign, the virus is able to circulate within the coverage gaps and cause out- breaks such as that of 1986 in Guasave. However, it may be inferred from the oc- currence of cases in only certain specific localities that the coverages in those lo- calities are quite low or almost nil.
Certain factors connected with the availability of services and com- munity perception of vaccination pro- grams appear to account for the fact that the proportions of unvaccinated children among the very poorest socioeconomic sectors are relatively high. In these sectors the vaccination program may be said to have achieved little penetration. This, in turn, could partly account for the correla- tion between areas receiving low cover- age through the regular vaccination pro- gram and areas receiving low coverage through the National Vaccination Days.
respiratory and diarrhea1 infections- episodes very frequent among infants- could partly account for this low infant coverage. In any case, the fact that the probability of being properly vaccinated (receiving three or more doses) rises as a child grows older could help to explain the greater concentration of cases among children under three years of age as well as the undeniable fact that many chil- dren in the areas involved acquire immu- nity very young at the high price of natu- ral infection.
The method proposed by WHO-using attributable risk to evalu- ate vaccine efficacy from coverage data and the proportion of cases occurring among vaccinated subjects-yields an es- timate similar to the one obtained with the method proposed by Smith et al. (4) for evaluating the protective efficacy of vaccines against common diseases in ana- lytical epidemiologic studies. Though it has been said that such evaluation is hampered by the frequency of asympto- matic cases, the results of the present study support the use of the WHO model for field evaluation of polio vac- cine under the conditions prevailing in national programs seeking to eliminate the disease by 1990. It should be noted, in addition, that a number of vaccine po- tency studies done between 1983 and
1986 by Mexico’s General Epidemiologic Directorate indicate that the cold chain has adequately conserved the potency of biologicals (7).
The study of risk factors failed to find any direct association between the subjects’ socioeconomic and health sta- tus on the one hand and the occurrence
of polio on the other. However, the data do point to at least an indirect association that varies with the probability of being vaccinated. Also, it is clear that the abil- ity of this study to detect such an associa- tion is rather low, the potential being only about 30 % for a relative risk of 2 .’ In addition, it should be noted that we would be barely 90% sure of finding a relative risk of 8 or more with a sample such as the one examined in this study. It is likewise apparent that the relative risk (odds ratio) and attributable risk data yield estimates with large confidence in- tervals resulting from the small size of the study samples-a size consonant with polio’s wane in recent years and with the relative scarcity of paralytic cases.
C
ONCLUSIONS
We conclude from these data that the persistence of wild poliovirus transmission in the state of Sinaloa has resulted from the vaccination program’s failure to provide complete coverage.
Although the new National Vaccination Day strategy paves the way for a major increase in coverage associ- ated with broader community support, difficulties encountered by the ongoing program have also been encountered by the new strategy. While these difficulties need to be more clearly defined, they ap- pear linked to indicators of low socioeco- nomic status and poor health education.
All in all, it appears advisable to stratify the country for risk factors on the basis of surveillance and sociodemo- graphic data so that priority can be as- signed to high-risk areas, vaccination
coverages can be extended, and the goal of eradication can be attained. It may also be necessary to evaluate the vaccine’s efficacy for every new polio case that oc- curs and to increase the sensitivity of our epidemiologic surveillance system.
A
CKNOWLEDGMENTS
We wish to thank Ms. Noemi Ales Gatti of the Universidad de Occi- dente for her collaboration in devising an attitude measurement instrument and Drs. Jose Luis Bobadilla of the Public Health Research Center of Mexico and Silvia Hartman of the PAHO Country Office in Mexico City for their valuable comments on the manuscript.
S
UMMARY
A case-control study was con- ducted to determine preventable risk fac- tors for development of poliomyelitis in Sinaloa, a northwestern state of Mexico that has consistently had a high inci- dence of reported cases. All reported
1984-1986 cases in selected high-risk areas of this state were matched by age with neighborhood controls. The cases were found significantly less likely than the controls to have received three or more doses of oral poliovirus vaccine.
The efficacy of the vaccine re- ceived was estimated at SO-90% based
on vaccination histories of the cases and on data obtained from a vaccine coverage survey conducted in the same area. An
analysis of control children showed that unvaccinated status (receipt of < 3 doses) was strongly associated with low income (p < O.OOl), low educational level (p < O.OS), poor housing (p C
O.O5), and parental attitudes that might lead to refusal of vaccination. Another important finding was that communities with low coverage rates in the routine vaccination program tended to have low coverage rates in intensive campaigns. Overall, this study supports the view that continuing transmission of polio in Mex- ico is not due to failings of the vaccine provided but rather to gaps in coverage. Accordingly, it appears advisable to strat- ify the country for risk factors on the basis of surveillance and sociodemographic data so that priority can be assigned to high-risk areas, vaccination coverages can be extended, and the goal of eradication can be attained.
RE
FERENCES
NadeIsticher, A. Tcc?zicaJ de construcci& de cuedonarios de opci& mZ&ble y me&&n de a&&es. Instituto de Investigaciones Penales, Mexico City, 1985.
Schesselman, J. J. Case-controlStudies. Oxford University Press, New York, 1982.
World Health Organization. Expanded pro- gram on immunization: Field evaluation of vac- cine efficacy. Weekly Epidemio/ogical’ Record 60:133-135, 1985.
Smith, I? G., L. C. Rodriguez, and I? E. M. Fine. Assessment of the protective efficacy of vaccines. I&J Epiu’emioL 13( 1):87-93, 1984. Levy, I?, and S. Lemeshow. .Samp& for Health ProfesJionah. Lifetime Learning, Belmont, 1980.
Kuritz, S. J., and R. J. Landis. Attributable risk ratio estimation from matched pairs case-con- trol data. Am J Epidemiol 125(2):324-328, 1987.