Carlos Pestana Barros & Nicolas Peypoch
A Comparative Analysis of Productivity Change in Italian and Portuguese Airports
WP 006/2007/DE _________________________________________________________
Tanya Araújo and Francisco Louçã
Tribes under Threat – The Collective Behavior of Firms
During the Stock Market Crisis
WP 28/2008/DE/UECE
Department of Economics
W
ORKINGP
APERSISSN Nº0874-4548
School of Economics and Management
Tribes under Threat
- The Collective Behavior of Firms
During Stock Market Crises
Tanya Ara´
ujo
∗and Francisco Lou¸c˜a
ISEG (School of Economics and Management)
Technical University of Lisbon (TULisbon)
Rua do Quelhas, 6 1200-781 Lisboa Portugal
Research Unit on Complexity in Economics (UECE)
†May 5, 2008
Abstract
Due to their unpredictable behavior, stock markets are examples of complex systems. Yet, the dominant analysis of these markets as-sumes simple stochastic variations, eventually tainted by short-lived memory. This paper proposes an alternative strategy, based on a stochastic geometry defining a robust index of the structural dynamics of the markets and based on notions of topology defining a new coef-ficient that identifies the structural changes occurring on the S&P500 set of stocks. The results demonstrate the consistency of the random hypothesis as applied to normal periods but they also show its in-adequacy as to the analysis of periods of turbulence, for which the emergence of collective behavior of sectoral clusters of firms is mea-sured. This behavior is identified as a meta-routine.
∗Corresponding author: tanya@iseg.utl.pt
1
Introduction
The evolution of stock markets has been eluding many established models, which interpret its dynamics according to the hypotheses that such markets behave as a simile of Brownian motion. We follow an alternative strategy, assuming a complex system: first, we look for evidence of structure as a generator of perturbations, and not of white noise shocks devoid of any in-formation; second, we argue that an empirically based interpretation of this dynamics is possible and effective in the detection of patterns of change, and, third, we identify this formation of patterns as a meta-routine. The an-alytical method, based on empirically oriented and computationally highly demanding techniques, is guided by these choices.
This paper develops and applies a stochastic geometry approach designed to describe the dynamics of the object emerging from the collective behavior of the complex system. In the current case, the market is analyzed according to the evolution of the population of two examples: the first one considers 253 stocks of the S&P500 index including all the surviving firms for the whole period from August 1988 to January 2008. In the second example, we consider the 424 stocks of the S&P500 including all the surviving firms for the more recent period from January 1998 to March 2008.
We define a metric and use a properly defined distance, computed from the correlation coefficients between daily returns of all these firms, and then proceed to the identification of the geometric object formed by the set of distances among such firms. The results prove that the resulting ellipsoid is a cloud of points, which is uniformly distributed along its first leading directions, whenever business-as-usual predominates, but that it is suffers severe distortions along several dimensions whenever a crisis occurs. The geometric and topological properties of the dynamics of this market can be measured and guide an empirically oriented interpretation of its evolution ([1], [2]).
The approach we suggest allows for:
1. the identification of the minimum number of relevant dimensions de-scribing the evolution of the market;
2. the identification of the dimensions along which the distortion occurs;
4. the identification of the patterns of change in the market and, namely,
5. of its sectoral dynamics.
The last point is the theme for this paper, in which we argue for a more general concept of sectoral routines based on these patterns of change.
2
The behavior of tribes under threat
The existence of a large number of degrees of freedom in the action of spec-ulative markets, as well as in others, was discussed in economic theory from two opposed points of view. One is reminiscent of the early social statis-tics of Adolphe Quetelet: although there are many individuals, order reigns supreme given the averaging out of their characteristics and actions. The ”homme moyen” of Quetelet and the ”representative agent” of Alfred Mar-shall and neoclassical economics meet in the forest of intentions and actions in the market. In that framework, determinism is recapitulated as com-manding laws of behavior and economic theory postulates the dominance of an ordered structure, eventually with simple random shocks impinging upon the course of the system and whose distribution follows a Gaussian law, the language of perturbations in Nature.
Another view was proposed by Trygve Haavelmo as he proposed the re-construction of economics according to the probability approach. In this case, all economic variables are redefined as stochastic processes: order itself is randomness. The degrees of freedom describe the uncertainty of agents in their actions, of the scientist in her measurement and of the model it-self in its omissions. The currently dominating models for the analysis of stock markets are distant inheritors of the generalized probability approach. In spite of evidence of stable distributions and heteroskedasticity, they were able to define sophisticated models of analysis and prediction based on these premises.
looking for shocks but for the evolution of the structure itself and, since this view is also inspired by the evolutionary and institutional reconsideration of economic theory, we intend to highlight both identifiable factors of mutation and the role of routines in the functioning of the markets.
One of such institutional factors is the sector itself. Of course, for a purely stochastic interpretation, the returns of stocks in highly competitive environment would be expected to evolve under the influence of so numerous factors that a random trajectory could be supposed to result. We prove that this is not the case in the periods of turbulence, although in normal periods the random hypothesis holds satisfactorily. In other words, our thesis is that the tribes are constituted under threat.
3
The stochastic geometry approach
Unless the proportion of systematic information present in correlations be-tween stocks in a complex system is relatively small, the corresponding man-ifold is a not a low-dimensional entity and therefore its understanding is virtually unreachable. But the evidence of alternate states of apparent ran-domness and the emergence of structured collective dynamics suggests it may correspond to a low-dimensional object. The rationale for this intuition is as follows: considering the existence of competition among multiple agencies, firms, information and strategies, the response by the agents to the multiple signals can create an object comparable to that obtained from random pro-cesses, which is a powerful analogy for such markets except when collective behavior emerges and dominates its dynamics. If this is the case, the relevant point is to capture this evolution and we are reduced to an embedding ques-tion, the definition of the smallest manifold that contains the set of points describing the market. In that case, its dynamics can be observed as its form is shaped by the occurrence of bubbles and crises.
The stochastic geometry strategy is simply stated in the following terms.
3.1
The metric and the definition of a distance
From the set of returns of the stocks 1 and their historical data of returns
over the time interval, and using an appropriate metric ([3],[4]), we compute
the matrix of distances between the stocks. Considering the returns for each stock,
r(k) = log(pt(k))−log(pt−1(k)) (1)
a normalized vector
−→ρ(k) = −→r(k)−h−→r(k)i
q
n(hr2(k)i−hr(k)i2) (2)
is defined, where n is the number of components (number of time labels)
in the vector −→ρ. With this vector the distance between the stocks k and l is defined by the Euclidian distance of the normalized vectors.
dij =
p
2 (1−Cij) = k−→ρ(k)− −→ρ(l)k (3)
as proposed in [3] and [4], withCij being the correlation coefficient of the
returns r(i),r(j).
3.2
Identification of the relevant directions and the
in-dex
S
As the distance is properly defined, it is possible to obtain, from the matrix of distances, the coordinates for the stocks in a Euclidean space of dimension
smaller than N. Then the standard analysis of reduction of the coordinates
is applied to the center of mass and the eigenvectors of the inertial tensor are computed.
The same technique is applied to surrogate data, namely to data obtained by independent time permutation for each stock and these eigenvalues are compared with those obtained in from the data, in order to identify the directions for which the eigenvalues are significantly different.
The procedure is straightforward. After the distances (dij) are calculated
for the set of N stocks, they are embedded in RD, where D < n, with
coor-dinates −→x(k). The center of mass −→R is computed and coordinates reduced to the center of mass.
− →
R = Σ−k→x(k)
k (4)
−
→y(k) = −→x(k)−−→R (5)
and the inertial tensor
Tij = Σk−→yi(k)−→yj(k) (6)
is diagonalized to obtain the set of normalized eigenvectors{λi,−→e i}. The
eigenvectors −→ei define the characteristic directions of the set of stocks. The
characteristic directions correspond to the eigenvalues (λi) that are clearly
different from those obtained from surrogate data. They define a reduced
subspace of dimension f, which carries the systematic information related to
the market correlation structure. In order to improve the decision criterion on how many eigenvalues are clearly different from those obtained from surrogate
data, a normalized difference τ is computed:
τ(i) =λ(i) + 1−λ′(i) (7)
and the number of significantly different eigenvalues is given by the high-est value of i to which (τ(i)−τ(i−1))>3(τ(i+ 1)−τ(i)).
It was empirically found that markets of different sizes, ranging from 70 to 424 stocks, across different time windows (from one year to 35 years) and
also from different market indexes2 have only six effective dimensions ([5],
[1], [2]).
This corresponds to the identification of empirically constructed variables that drive the market and, in this framework, the number of surviving eigen-values is the effective characteristic dimension of this economic space. Taking the eigenvalues of order smaller or equal than the number of characteristic dimensions, the difference between eigenvalues from data and those obtained from surrogate data are computed. The normalized sum of those differences
is the index S, which measures the evolution of the distortion effect in the
shape of the market space.
St= Σ6i=1
λt(i)−λ′t(i)
λ′
t(i) = Σ
6
i=1
λt(i)
λ′
t(i) −1 (8)
where λt(1), λt(2), ..., λt(6) are the six largest eigenvalues of the market
space and λ′
t(1), λ′t(2), ..., λ′t(6) are the largest six eigenvalues obtained from
surrogate data. In computingS, at a given timet, bothλtandλ′tare obtained
over the same time window and for the same set of stocks.
4
The 1998-2008 History
The proposed approach is applied to the history of 424 stocks of the S&P500 index that includes all the surviving firms for the period under consideration. We presume this population to be representative of the dynamics of the stock market and its behavior to be a symptom of the evolution of the economy of the US.
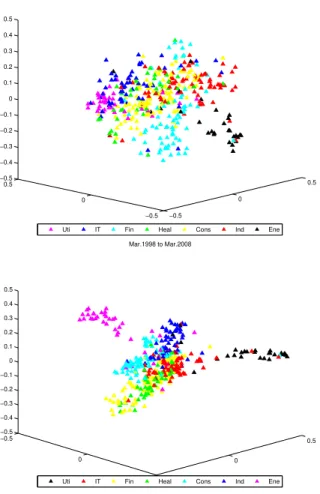
The changing patterns for this long period are notorious. In Figure 1, we show the object describing the evolution of the market as replicated in the three dominant directions, as obtained following the method indicated in the last section, and the object of a period of business-as-usual is compared to another formed in a period of crash. The differences are imposing, since in the latter type of situation the clustering of firms (colored accordingly to the sector they belong) and the deformation of the market space are obvious.
The object has a characteristic dimension, which allows for a description projecting its typical shape and the identification of the patterns of its
evolu-tion. The index S is useful for this identification of shapes and patterns and
This is graphically evident in Figure 2 and is confirmed by the rigorous mea-surement of the distortion of the shape of the object describing the market. In Figure 2, the seismography of crashes is depicted, registering those crashes attaining S > 5.
As compared to the previous periods, the results suggest that a new regime emerges after 1997 and it is a regime of frequent storms. In this sense, this period combines some of the features of the 1920s and some of those characteristics of the manias for canals and railways, which accompanied earlier waves of technical change in the nineteenth-century ([6]).
5
Networks under Threat
The previous results suggest that, as the markets suffer a crash, there is a distortion in the dominant directions representing its leading variables. But our data prove as well that such distortion follows a sectoral pattern. Conse-quently, we discuss in this section the form of collective dynamics emerging under threat, using a graph representation of the network of stocks.
To characterize the additional information on the structure of the market
spaces, we define the coefficient R, which quantifies the distribution of the
intensity of correlation among stocks present in the S&P500 market space along the last 10 years.
From the matrix of distances between stocks (equation 1) computed in
the reduced six dimensional space (D6) over a time window of 22 days, we
apply the hierarchical clustering process to construct the minimal spanning
tree (MST) that connects the N securities. Then the boolean graph BD6 is
defined by setting b(i, j) = 1 if d6(i, j) ≤ L
D6/2 and b(i, j) = 0 if d6(i, j)> LD6/2, whereLD6 is the smallest threshold distance valued6(i, j) that assures
in the Industry, Utilities, Financial and Energy sectors.
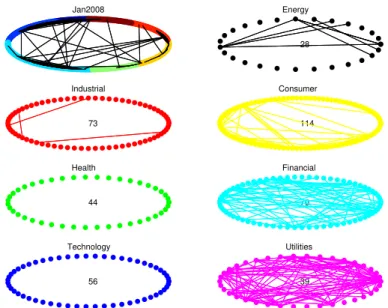
It is also obvious that the nature of the shock and the evolution of the market produce different sectoral dynamics. As Fig.4 highlights, for the Winter 2008 crisis, the dominant impacts were in the Financial and Utilities sectors, whereas for the case of the 2001 crisis the impacts were more intense on Technologies, Industry and Energy, as Fig.5 shows.
The figure shows the structure of each crisis, as measured according to the density of relations among sectors; the subprime crisis is concentrated in the financial and utilites sectors, in contradistinction to other episodes of turbulence, such as the crash after 9.11, concentrated in the energy and in-dustry sectors. The profile of each of the crisis can consequently be described and measured following the indications of this topology.
Improving our investigation on the topological aspects of the stocks be-haviour, leads to the definition of the coefficient R, which captures the rela-tive distribution of the distance values below and above the smallest
thresh-old distance value (LD6) that insures connectivity of the whole network of
companies.
Rt= P
d6t(i,j)≤L D6
d6
t(i,j) P
d6
t(i,j)>LD6
d6t(i,j) (9)
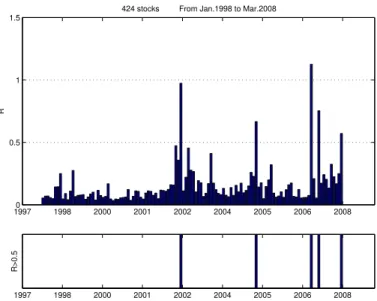
Results, as indicated in Fig.6, show that the amount of highly correlated (short-distant) fluctuations whenever a crash occurs is very large. These networks display a large amount of distances whose values are below the endogenous threshold value. This is due to the emergence of a relevant set of highly correlated fluctuations of the stock returns during market shocks
forcing several weak correlated fluctuations to leave this category. Although
the values of the overall network distances decrease with crashes, the emer-gence of highly correlated groups of stocks occupying the prominences in the market distorted shape leads to an increase of the value of the endogenous thresholdLD6. As a consequence, the number of distances belowLD6 tend to
be much higher than the number of those that remain above the endogenous threshold, leading to a significant increase of the values of R.
During the Subprime Crisis, R reaches 1.4, while the same coefficient
computed for normal periods rests below 0.5 (computing R from surrogate
data yields typical values around 0.025). The evolution of R confirms our
previous results, identifying the major crashes in the period and detecting how peculiar it is the Winter 2008 crisis. The Subprime Crisis constitutes one
Futhermore, using theLD6/2 threshold to filter the distances, we describe
a network of companies whose stocks are required to be close enough in order to be connected. The notion of ’state’ is then defined according to the connectedness of different companies, with those sharing the same state displaying synchronous behavior.
From the boolean graph BD6 we define s(i) = 1 if ∃j|b(i, j) = 1 and
s(i) = 0 otherwise. In so doing, we are able to identify, along different
periods of observation, those companies that are connected (being closer than the threshold distance) to at least one other companies in the whole network of companies.
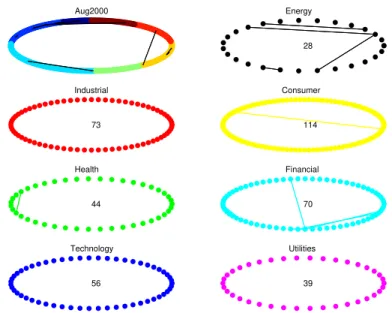
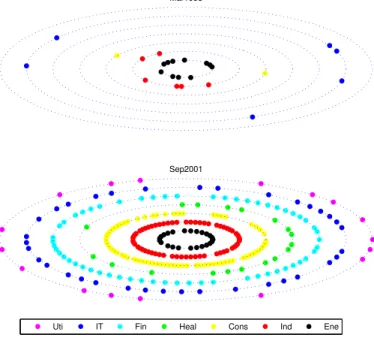
The space of the synchronous companies in our population is described in Figures 7 to 9. Stocks are disposed on seven rings, whose color is determined accordingly to each specific sector (Energy, Industry&Materials, Consumer, Health Care, Finance, Information Technology and Utilities). Over the rings, the position of each stock is determined by its order number. However, those
evidencing a non-synchronous (s(i) = 0) evolution are missing, otherwise
(s(i) = 1) they are indicated with colors accordingly to the corresponding
sector. Figure 7 to 9 exhibit monthly observations.
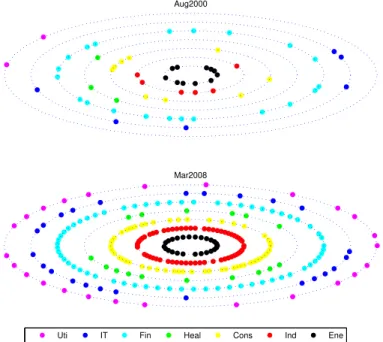
The plots in Fig.7 show that in March 1998, a period of ’business as usual’ there are few synchronous companies, in almost every sectors, except in the Energy one. Conversely, in September 2001, almost every sector dis-plays a highly synchronous set of stocks. The last plot in Figure 8 orders the synchronous movements evidencing the sectoral dynamics as showed in March 2008, where synchronization prevails in Industry, Utilities, Financial and Energy sectors. On the contrary, in August 2000, a period of ’business as usual’ there are few synchronous companies, in almost every sectors.
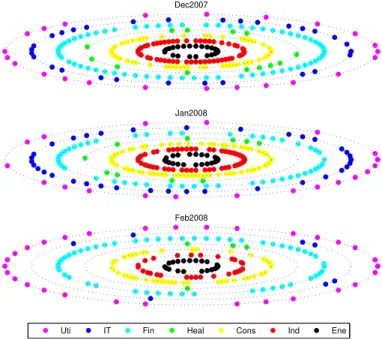
The three plots in Fig.9 show the strong synchronization pattern among stocks in the last 3 months of the Winter 2008 crisis. As they clearly demon-strate for the case of the subprime crisis, synchronization is related to the occurrence of market shocks and, furthermore, the dynamics of the stocks of firms tend to follow sectoral patterns.
6
Conclusion
The previous results can be interpreted from an evolutionary perspective, namely the two emergent properties here discussed.
Collective dynamics is the first emergent property in these markets. It is a property of the structure itself and it allows for the compatibility between the randomness hypothesis, which provides a fair description of the market in normal periods, and the highly structured response to the major crashes as the market space is distorted, which reveals the working of its fundamentals. Indeed, the market exhibits a large number of degrees of freedom under normal circumstances but tends to a very reduced number of degrees of freedom under crises.
Synchronization is the second emergent property of the stock markets. The results show that synchronization is a rule of behavior and that it follows sectoral patterns. Therefore, routines apply at the firm level but also as part of the configuration of the space of the market itself. This is an intuition going back to the path-breaking work of Nelson and Winter ([7]), who pointed out the organizational and institutional role of routines. Our method and results prove the emergence of meta-routines of social behavior of populations of agents in the speculative market, as a response to signals of turbulence: the meta-routine organizes the routines of agents and firms. Consequently, not only the structure of the firm but also the structure of the market itself generates patterns of behavior, through the formation of expectations and the choice of actions, that define the collective dynamics.
Competition creates routines that create bonds, and the collective dy-namics of the reactions of firms and the markets to the crashes is a case in point. Tribes tend to reunite whenever the bell tolls.
References
[1] Ara´ujo T., Lou¸c˜a, F. (2007), The Geometry of Crashes - A Measure of
the Dynamics of Stock Market Crises, Quantitative Finance, 7(1).
[2] Ara´ujo T., Lou¸c˜a, F. (2008), The Seismography of Crashes in Financial
Markets, Physics Letters A, Vol. 372.
[4] Mantegna, R.N., Stanley, H.E. (2000), An Introduction to Econophysics: Correlations and Complexity in Finance, Cambridge, Cambridge Uni-versity Press.
[5] Vilela Mendes, R., Ara´ujo, T. and Lou¸c˜a, F. (2003), “Reconstructing an Economic Space from a Market Metric”, Physica A, 323, 635-50.
[6] Freeman, C. and Lou¸c˜a, F. (2002), As Time Goes By, Oxford University Press: Oxford.
−0.5
0
0.5
−0.5 0
0.5 −0.5 −0.4 −0.3 −0.2 −0.1 0 0.1 0.2 0.3 0.4 0.5
Jul.1998 to Jul.2000
Uti IT Fin Heal Cons Ind Ene
−0.5
0
0.5 −0.5
0
0.5 −0.5
−0.4 −0.3 −0.2 −0.1 0 0.1 0.2 0.3 0.4 0.5
Mar.1998 to Mar.2008
Uti IT Fin Heal Cons Ind Ene
88 89 90 91 92 93 94 95 96 97 98 99 00 01 02 03 04 05 06 07 08 0
2 4 6 8 10 12 14 16 18
253 stocks A new regime after 1997
S
S>5
Figure 2: The evolution of the index S measuring the evolution of the
S&P500 structure for the surviving firms for 1988-2008 and the
Seismog-raphy of crashes for the same period, considering those attaining S > 5
Aug2000
28 Energy
73 Industrial
114 Consumer
44 Health
70 Financial
56 Technology
39 Utilities
Jan2008
28 Energy
73 Industrial
114 Consumer
44 Health
70 Financial
56 Technology
39 Utilities
Figure 4: The networks of stocks obtained for January 2008, when connec-tivity inside each sector is the dominant behaviour
Sep2001
28 Energy
73 Industrial
114 Consumer
44 Health
70 Financial
56 Technology
39 Utilities
19970 1998 2000 2001 2002 2004 2005 2006 2008 0.5
1 1.5
424 stocks From Jan.1998 to Mar.2008
R
1997 1998 2000 2001 2002 2004 2005 2006 2008
R>0.5
Figure 6: The evolution of the coefficient Rcaptures the emergence of highly
Sep2001
Uti IT Fin Heal Cons Ind Ene
Mar1998
Mar2008 Aug2000
Uti IT Fin Heal Cons Ind Ene
Dec2007
Jan2008
Feb2008
Uti IT Fin Heal Cons Ind Ene