Setembro 2015
Diogo Alexandre Castro Vaz
Licenciatura em Ciências de Engenharia de Micro e Nanotecnologias
Magnetotransport properties of metal/LaAlO3/SrTiO3
heterostructures
Dissertação para obtenção do Grau de Mestre em Engenharia de Micro e Nanotecnologias
Orientador: Dr. Manuel Bibes, Senior Scientist, Unité Mixté de Physique CNRS/Thales, Paris, France
Co-orientador: Dr. Rodrigo Martins, Professor Doutor, Faculdade de Ciências e Tecnologia da Universidade Nova de Lisboa, Portugal
Júri:
Presidente: Doutor Hugo Manuel Brito Águas, Professor Auxiliar do Departamento de Ciência dos Materiais da Faculdade de Ciências e Tecnologia da Universidade Nova de Lisboa
Vogais: Doutor José Paulo Moreira dos Santos, Professor Associado com Agragação do Departamento de Ciência de Física da Faculdade de Ciências e Tecnologia da Universidade Nova de Lisboa Doutor Rodrigo Ferrão de Paiva Martins, Professor Catedrático
Magnetotransport properties of metal/LaAlO3/SrTiO3 heterostructures.
Copyright © Diogo Alexandre Castro Vaz, Faculdade de Ciências e Tecnologia, Universidade Nova de Lisboa.
“I am not discouraged, because every wrong attempt
discarded is another step forward.”
Acknowledgements
I would firstly like to thank Manuel Bibes for the guidance, help and friend-ship throughout this project. Although this was a completely new subject to me, he made sure that I always felt at home. To Agnès Barthélémy for being my unofficial supervisor and for her experience and fruitful discussions. To Edouard Lesne for all the help and encouragement. Without him and his PdD work I would have probably spent the full six months just trying to grow one good LaAlO3/SrTiO3 sample. To all the friends from the oxide group for putting up
with my basic questions, cheering me up in the worst possible days and teaching me how to deal with French bureaucracies.
Um especial agradecimento ao professor Rodrigo Martins. Sem a sua ajuda e orientação não teria sido possível sequer começar este projecto. Um obrigado também a todo o corpo docente que me acompanhou durante os últimos cinco anos. Todos os relatórios, discussões e difíceis aulas às 8 da manhã revelaram-se bastante úteis.
Um enorme obrigado a todas os colegas do mestrado integrado. Creio que não teria sido possível acabar o curso e manter um estado mental saudável sem a vossa presença.
To all the amazing friends and neighbors from Maison de Norvège. For the cultural exchange, for the amount of weird stuff that happened in the house, for the pleasure of having a beer/glass of wine in the end of a long day of work, for the dramas with the Cité night security, for the “deer incident” and for those unforgettable long dinners in the balcony. These six months passed by so fast because of you guys.
Abstract
The quasi two-dimensional electron gas (q2DEG) hosted in the interface of an epitaxially grown lanthanum aluminate (LaAlO3) thin film with a TiO2
-termi-nated strontium titanate (SrTiO3) substrate (001) has been massively studied in
the last few years. The confinement of mobile electrons to within a few nanome-ters from the interface, superconductive behavior at low temperatures and elec-tron mobility exceeding 1000 cm2/(V.s) make this system an interesting
candi-date to explore the physics of spin injection and transport. However, due to the critical thickness for conduction of 4 unit cells (uc) of LaAlO3, a high tunneling
resistance hampers electrical access to the q2DEG, preventing proper injection of spin polarized current.
Recently, our group found that depositing a thin overlayer of Co on LaAlO3
reduces the critical thickness, enabling conduction with only 1 uc of LaAlO3. Two
scenarios arise to explain this phenomenon: a pinning of the Fermi level in the metal, inducing charge transfer in the SrTiO3; the creation of oxygen vacancies at
the interface between LaAlO3and the metal, leading to an n-type doping of the
SrTiO3.
In this dissertation, we will report on magnetotransport of metal/LaAlO3/SrTiO3(metal: Ti, Ta, Co, Py, Au, Pt, Pd) heterostructures with 2
uc of LaAlO3 studied at low temperatures (2 K) and high magnetic fields (9 T).
We have analyzed the transport properties of the gas, namely, the carrier concen-tration, mobility and magnetotransport regime and we will discuss the results in the light of the two scenarios mentioned above.
Resumo
O gás de electrões quase bidimensional (q2DEG) alojado na interface de um filme fino de aluminato de lântanio (LaAlO3) epitaxialmente crescido num
substrato de titanato de estrôncio (SrTiO3) com terminação TiO2 (001) tem sido
intensamente estudado nos últimos anos. O confinamento de electrões móveis a poucos nanometros da interface, superconductividade a baixas temperaturas e mobilidades (de electrões) superiores a 1000 cm2/(V.s) tornam este sistema um
candidato interessante para exploração da física de injecção e transporte de spin. No entanto, devido à espessura crítica para condução de 4 células unitárias (uc) de LaAlO3, uma alta resistência elétrica de tunelamento impede o acesso ao
q2DEG, impossibilitando injecção adequada de correntes de spin polarizado. Recentemente, o nosso grupo descobriu que a deposição de uma fina camada exterior de cobalto (Co) reduz a espessura crítica, permitindo condução com apenas 1 uc de LaAlO3. Dois cenários surgem para explicar este fenómeno:
um pinning do nível de Fermi no metal que induz transferência de cargas para o SrTiO3; a criação de vazios de oxigénio na interface entre LaAlO3 e o metal que
conduz a uma dopagem tipo n do SrTiO3.
Nesta tese, vamos apresentar resultados de magnetotransporte em heteroestruturas metal/LaAlO3/SrTiO3 (metal: Ti, Ta, Co, Py, Au, Pt e Pd) com 2
uc de LaAlO3, estudadas a baixas temperatures (2K) e altos campos magnéticos
(9T). A análise das propriedades do q2DEG formado terá em conta a concentração de portadores, mobilidade e regime de magnetotransporte e a sua formação será discutida em função dos dois cenários mencionados acima.
Contents
INTRODUCTION ... 1
1.1. The LaAlO3/SrTiO3 Interface... 2
1.2. Devices and Suppression of the Critical Thickness ... 6
METHODS ... 9
RESULTS AND ANALYSIS ... 13
3.1. Surface Morphology ... 13
3.2. Transport Properties ... 16
3.2.1. Van der Pauw Method ... 16
3.2.2. Hall Effect ... 18
3.2.3. Quantum Corrections ... 19
3.2.4. Band Structure and Spin-Orbit Interaction ... 20
3.2.5. Results of Magnetotransport Experiments ... 23
3.2.5.1. LaAlO3/SrTiO3 Heterostructures ... 23
3.2.5.2. Metal/LaAlO3/SrTiO3 Heterostructures ... 25
3.3. q2DEG Formation ... 33
3.3.1. Critical Work Function Scenario ... 33
3.3.2. Metal-Induced Oxygen Vacancies Scenario ... 38
3.3.3. Influence of ϕMand ΔH0 on Transport Properties ... 39
CONCLUSION AND PERSPECTIVES ... 43
REFERENCES ... 47
ANNEXES ... 53
Annex 1 – Growth Modes ... 53
Annex 2 – Antisymmetrization and Symmetrization Method ... 54
vii
Table of Figures
Figure 1 – The metallic LaAlO3/SrTiO3 interface. a) 2D atomic stacking of LaAlO3 layers over a
SrTiO3 substrate in the (001) direction. On the right side, the unit cell (uc) for both
materials is represented. b) Sheet conductance at room temperature as a function of the number of LaAlO3 unit cells. A clear insulator-metal transition is observed at 4 uc [9]. ... 3
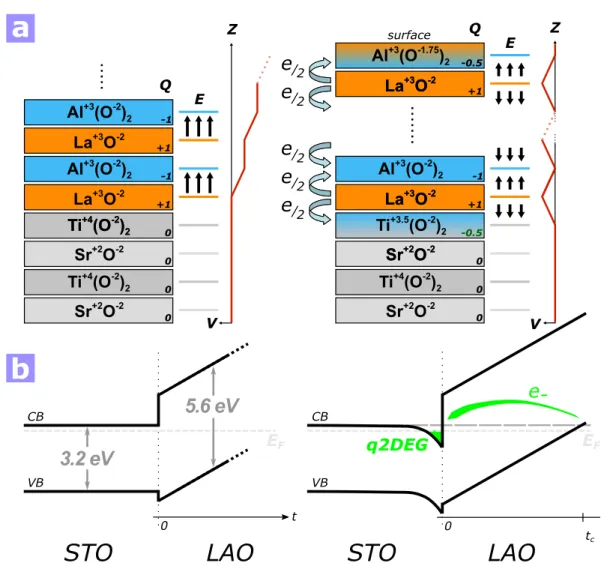
Figure 2 – Electrostatic reconstruction scenario. a) Schematic representation of the polar discontinuity at LaAlO3/SrTiO3 heterointerfaces. On the left side the unreconstructed
n-type LaO/TiO2 interface. Along the (001) direction SrTiO3 shows neutrally charged planes
(Q=0) while LaAlO3 planes have an associated charge of Q=1 and Q=-1. The electrostatic
potential V therefore starts building up at the interface and keeps increasing with LaAlO3
film thickness. On the right side a polar catastrophe is avoided through the transfer of half an electron to the TiO2 interfacial plane. The potential remains finite since the electric field
oscillates around E=0 along the (001) direction. b) Simplified band structure of
LaAlO3/SrTiO3 interface. The increasing thickness raises the internal potential allowing the
LaAlO3 valence band (VB) to shift until it reaches the SrTiO3 conduction band (CB). At this
critical thickness tc, Zener breakdown occurs and electrons are able to travel into Ti 3d
states at the interface where the q2DEG appears. ... 4 Figure 3 – The role of oxygen vacancies. a) Conductive-tip atomic force microscopy (CT-AFM)
resistance mapping around the interface. In the left case conduction spreads in depth through the SrTiO3 substrate most likely due to oxygen vacancies formed during growth
process. An oxygen annealing fills these vacancies and interfacial conduction is achieved. (Modified from [6]) b) Band diagram of an interface between a polar film and nonpolar substrate. Donor states are created through the appearance of vacancies at the surface leading to electron transfer. The reconstruction also attenuates the film’s internal field. (Modified from [21])... 6 Figure 4 – Co capped LaAlO3 (<4uc)/SrTiO3 transport measurements. Experimental longitudinal
sheet resistance and Hall effect measurements for capped structures with different LaAlO3
viii
reference LaAlO3/SrTiO3 with 4 uc (black curved) which proves that a q2DEG can be
induced below the 4 uc critical thickness. The inset on the right shows the small
contribution of the Co layer for the Hall effect experiments. (Modified from [30]) ... 7 Figure 5 – Experimental PLD system. a) Schematic illustrating the PLD system used. Four
different targets are available inside the chamber. The KrF excimer laser shoots the desired target, creating a plume of material to be deposited. The substrate holder is heated with an infrared laser and the temperature is measured by two pyrometers (one on the top and another on the bottom measuring the sample directly). The turbomolecular pump (TMP) and rough pump (RP) allow a vacuum inside the chamber of around 10-9 mbar. b) The
beam geometry is firstly defined by a slit. It goes through a variable attenuator and an optical stage composed by two converging lenses (focal lengths fo1=100 mm and fo2=150
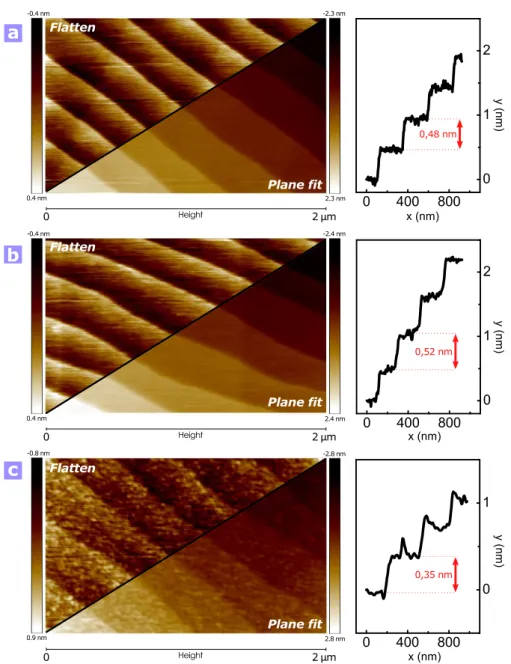
mm) to define the spot size. Additional deflecting mirrors for beam guidance are not shown for clarity [64]. c) Typical time dependent RHEED intensity oscillations. Each peak represent one monolayer deposited. ... 11 Figure 6 - Surface morphology analysis using AFM with both flatten and plane fit treatment. a)
Bare TiO2 terminated SrTiO3 as received from Crystec. b) LaAlO3 (4uc)/SrTiO3 c)
AlOx/Py/LaAlO3 (1uc)/SrTiO3. The Al was used to protect the Py layer and most likely
takes the form of AlOx due to surface oxidization. ... 14
Figure 7 - Miscut and RHEED patterns. a) Schematic exemplifying the step terrace morphology observed in Figure 6. b) Different RHEED patterns from electron diffraction to
demonstrate the progression of crystalline quality with the LaAlO3 and metal deposition.
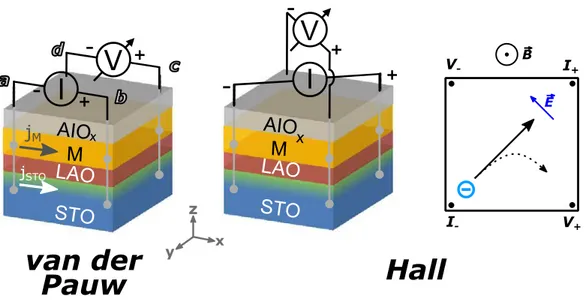
... 16 Figure 8 - Schematic of the connection in van der Pauw and Hall configuration. The aluminum
wire is buried deep in the heterostrucure so that two current density are measured: jM and
jSTO, contributions from the metal and q2DEG respectively. An additional schematic from
the top view of the Hall effect (right side) demonstrates the deviation of injected electrons due to an electric field E generated by the application of an out-of-plane magnetic field B. ... 17 Figure 9 - Theoretical magnetoconductance curves in the weak localization (black) and weak
antilocalization regime (blue) [65]. ... 20 Figure 10 - Band structure and spin-orbit interaction. a) Energy levels of the Ti 3d orbitals in
spherical, cubic, tetragonal and non-inverted symmetry. The cubic to tetragonal transition distorts the TiO6 octahedra and lifts degeneracy of the eg and t2g multiplets. The inverted
symmetry in the system leads to completely modified eg and t2g multiplets due to the
confining potential created with interface formation. Specific values taken from x-ray absorption spectroscopy for the amplitude of the splitting can be found in [33]. b)
Interfacial d-orbital energy bands of LaAlO3/SrTiO3 aligned at the Γ point. As shown in a)
ix
interaction at the bottom of dxz and dyz bands. d) ASO strenght along the Fermi surface.
The green area represent the first two bands (dxy and heavy dxz/dyz) while the purple
represents the third band (light dxz/dyz). Modified from [34]. e) Modulation of the
magnetoconductance of LaAlO3/SrTiO3 interface at low temperatures and under external
electric and magnetic field. Modified from [35]. ... 22 Figure 11 - Transport properties of a LaAlO3 (5uc)/SrTiO3 sample. a) Sheet resistance as a
function of temperature. b) Hall trace and magnetoresistance (inset) at 2 K for an external out-of-plane magnetic field of 9 T to -9 T. c) Sheet carrier concentration as a function of temperature taken from the high field regime slope of Hall experiments (from 2 K to 300 K). Although the uncertainties are not shown they are less than 1% (error associated with the linear fitting at high fields). d) Carrier mobilities as a function of temperature. ... 24 Figure 12 - Sheet resistance as a function of temperature using different metal cappings on
LaAlO3 (2uc)/SrTiO3. Measured longitudinal resistance 𝑅𝑥𝑥𝑚𝑒𝑎𝑠 (strong colored curve) and
𝑅𝑥𝑥𝑞2𝐷𝐸𝐺 (light colored curve) extracted with the parallel currents of the metal and q2DEG
(inset) for a) Ti b) Ta c) AlOx/Co and d) AlOx/Py. The sheet resistance of the previous LaAlO3 (5uc)/SrTiO3(black curve) is used for comparison. The metallic layer’s sheet
resistance is assumed to be equal to 𝑅𝑥𝑥𝑚𝑒𝑎𝑠 at room temperature and to have no
dependence over the temperature sweep. ... 27 Figure 13 - Hall effect measurements using different metal cappings on LaAlO3 (2uc)/SrTiO3.
For all samples, a) Ti b) Ta c) AlOx/Co and d) AlOx/Py, the room temperature hall effect is
dominated bt the metal (red) while at low temperatures a non-linear hall trace appears with different hall coefficients (high field regime) for each sample. Magnetoresistance is also represented in the inset of each figure. ... 29 Figure 14 - Hall effect measurements using Au, Pd and Pt as metal cappings on LaAlO3
(2uc)/SrTiO3 and corresponding magnetoresistance (inset). The linear Hall effect and the
low values of magnetoresistance at high fields show that there is no formation of a
q2DEG. ... 32 Figure 15 - Magnetoconductance calculated for metal/LaAlO3 (2uc)/SrTiO3 (metal: Py, Ta, Ti,
Co). The bar at the top situates the sample's magnetotransport regime according to the sheet conductance at zero field 𝜎2𝐷0 (modified from [39]). The high 𝜎2𝐷0 obtained indicate that the metal capped LaAlO3/SrTiO3 samples measured are in the Anomalous Metal
regime, characterized by large carrier concentrations. ... 32 Figure 16 - Schematic energy band diagram of metal/LaAlO3 (n)/SrTiO3 with n<tc=4uc. a) Band
diagram prior to contact between the metal and LaAlO3. XSTO and XLAO are the insulator's
electron affinity, 𝐸𝑔𝑆𝑇𝑂 and 𝐸𝑔𝐿𝐴𝑂 the band gap, EF and V0 the Fermi level and vacuum level,
x
Fermi level will lie inside the SrTiO3 bandgap and no charge transfer occurs. The interface
remains therefore insulating. ... 35 Figure 17 - Influence of the metal on the carrier concentration calculated for each sample. a)
Metals with lower work function allow the formation of a q2DEG. An experimental critical work function can be estimated (green/red boundary). b) The tendency of the metal to oxidize given by the enthalpy of formation ∆𝐻0 also influences the formation or not of a q2DEG. Metals with larger (negative) ∆𝐻0 form more oxygen vacancies at the LaAlO3
xi
Table of Acronyms
q2DEG Quasi Two-Dimensional Electron Gas
CB Conduction Band
VB Valence Band
TMP Turbo Molecular Pump
RP Rotary Pump
IR Infrared
CCD Charge-Coupled Device
AFM Atomic Force Microscopy
CT-AFM Conductive Tip Atomic Force Microscopy
PLD Pulsed Laser Deposition
RHEED Reflection High-Energy Electron Diffraction
WL Weak Localization
WAL Weak Antilocalization
SOI Spin-Orbit Interaction
ASO Atomic Spin-Orbit
MIGS Metal-Induced Gap States
PWD Potential Well Depth
MR Magnetoresistance
MC Magnetoconductance
xiii
Table of Symbols
Q Charge
V Electrostatic Potential
E Electric Field
uc Unit Cell
tc Critical Thickness
fo Focal Length
Rq Root Mean Square Surface Roughness
j Current Density
Rxx Longitudinal Resistance
RS Sheet Resistance
f Van der Pauw Correction Factor
F Lorentz Force vector
q Carrier Charge
E Electric Field vector
v Carrier Velocity vector
B Magnetic Field vector
ρxy Transverse Resistivity
VH Hall Voltage
I Current
xiv
𝝆 Tensor of Resistivity
j Current Density vector
RH Hall Coefficient
ns Sheet Carrier Concentration σxx Longitudinal Conductivity
d Thickness
μH Hall Mobility
𝜎2𝐷0 Sheet Conductance at Zero Magnetic Field
χ Electron Affinity
Eg Bandgap
EF Fermi Energy
VO Vacuum Level
ϕSB Schottky Barrier Height
ϕ Work Function
1
Introduction
Our lives have been completely overrun by technology. The fact that now-adays the average consumer spends more time using their phone or laptop than sleeping is encouraging the electronics industry to invest more and more each year into new developments. So far, silicon has been the backbone of the entire industry, but an inevitable mitigation of its usage has always been clear. Further component downsizing will compromise performance and new solutions must be found. Oxide electronics has shown remarkable properties and capabilities way beyond silicon. Specifically, interfaces between complex oxides exhibit new and unusual electronic phases that can be used to develop spintronic devices, where spin polarized electrons are used to carry information. This dissertation is devoted to the study of the high mobility electron gas present at the LaAlO3/SrTiO3 interface. Although this system has been heavily studied in the
last decade, a great number of question are still unanswered. In order to make progress on the understating of this system, we used different metal cappings to induce a quasi two dimensional electron gas (q2DEG) at low thicknesses of LaAlO3 (<4 uc) and we studied the associated magnetotransport properties. This
study will additionally pave the way for future spin injection/detection and spin transport devices.
2
1.1.
The LaAlO
3/SrTiO
3Interface
In 2004, Ohtomo and Hwang discovered that the interface between an in-sulating LaAlO3 layer and an insulating SrTiO3 substrate shows a metallic
behav-ior [1]. Both materials share a perovskite structure and have a similar a lattice constant of 3.79 Å for LaAlO3 and 3.905 Å for SrTiO3 (Figure 1a), so that an
LaAlO3 structure stacked on top of a (001)-oriented SrTiO3 experiences a tensile
strain of 3%. Although there are two possible interfaces within the system, LaO/TiO2 (n-type) and AlO2/SrO (p-type), we will focus entirely on the first one,
being the p-type interface insulating [1–3].
The conducting interface exhibits a metal to superconductor transition at about 200 mK [4] (controllable by gate voltage), magnetism [5], confinement within 7 nm from the interface [6,7] and a strong Rashba spin-orbit interaction [8]. Additionally, a critical thickness of LaAlO3 for conduction exists for 4 uc [9],
as shown in Figure 1b. This key component will be discussed in detail in the next chapters.
Although 11 years passed after its discovery, due to the complexity of the materials there is still no theory that perfectly describes the inherent mechanisms for the q2DEG formation in this system, albeit a few scenarios have been pro-posed.
A first scenario relies on the intrinsic polar discontinuity present in LaAlO3/SrTiO3 interface. In Figure 2a we see that the planes present in SrTiO3
are both neutral along the (001) direction ((SrO)0 and (TiO2)0). The planes of
LaAlO3 however have an associated charge ((LaO)+1 and (AlO2)-1) that will
intro-duce an electric field within each unit cell. An electrostatic potential is then ex-pected between the interface and the top surface. With increasing number of LaAlO3 layers this potential will unfavorably increase and, at 4 uc of LaAlO3, the
system goes through electronic reconstruction to avoid a polar catastrophe [3,10,11]. The critical thickness for conduction of 4 uc, represented in Figure 1, can also be explained by this scenario.
At this thickness, the potential introduced by LaAlO3 is large enough for
3 Since Ti ions at the interface are able to change their valence from +4 to +3, Zener breakdown occurs and electrons may travel into the SrTiO3 and stay
con-fined. This electron transfer generates an opposite electric field that counterbal-ances the inner potential of the LaAlO3 layer. The field can only be completely
canceled for thick LaAlO3, where a transfer of half an electron per uc is expected
from the LaAlO3 top layer to the interface, resulting in a (maximum) carrier
con-centration of 3.3 × 1014 cm−2 in the system. Although the extraction of the car-rier concentration has to be made with caution (as we will discuss in the chapters ahead), the typical experimental values extracted are around 2 × 1013 cm−2, much lower than predicted by the electronic reconstruction scenario but possibly justified by Anderson localization of interfacial charges and the existence of more than one type of electrons contributing to conduction [10]. It is also debated that the built-in electric field is in fact much weaker than what the polar discontinuity scenario proposes and consequently the band bending will not be enough to pull the LaAlO3 valence band over the SrTiO3 conduction band [12,13].
Figure 1 – The metallic LaAlO3/SrTiO3 interface. a) 2D atomic stacking of LaAlO3 layers over
a SrTiO3 substrate in the (001) direction. On the right side, the unit cell (uc) for both materials
4 Using a pure electrostatic approach is still not satisfying, which indicates that extrinsic mechanisms may be involved in the formation of the q2DEG.
Figure 2 – Electrostatic reconstruction scenario. a) Schematic representation of the polar dis-continuity at LaAlO3/SrTiO3 heterointerfaces. On the left side the unreconstructed n-type
LaO/TiO2 interface. Along the (001) direction SrTiO3 shows neutrally charged planes (Q=0)
while LaAlO3 planes have an associated charge of Q=1 and Q=-1. The electrostatic potential
V therefore starts building up at the interface and keeps increasing with LaAlO3 film
thick-ness. On the right side a polar catastrophe is avoided through the transfer of half an electron to the TiO2 interfacial plane. The potential remains finite since the electric field oscillates
around E=0 along the (001) direction. b) Simplified band structure of LaAlO3/SrTiO3
inter-face. The increasing thickness raises the internal potential allowing the LaAlO3 valence band
5 Since the idea of an atomically abrupt interface is too risky to be considered in a real system, cation intermixing at the interface may indeed form a metallic La-doped SrTiO3 just below the interface, as suggested by some authors [3,14].
This scenario however fails to explain the rigorous critical thickness of LaAlO3
for conduction.
Oxygen vacancies in bulk SrTiO3 could also be a possible explanation, being
the SrTiO3 so sensitive to stoichiometric deviations [15,16]. Indeed since the
growth of LaAlO3 is made at low oxygen pressures (𝑃𝑂2 < 10−5 mbar) a
contri-bution of oxygen vacancies to the total carrier density should be present. A clear influence of the annealing process can be observed in Figure 3a. On the left side we see a sample without annealing, exhibiting a 3D-like conduction that extends throughout SrTiO3 bulk with sheet carrier densities around 1017 cm−2 at low
tem-peratures. To achieve interfacial conduction (right side) a high temperature an-nealing in a high oxygen pressure (200 mbar) after growth is required in order to fill oxygen vacancies. This way, the total carrier density decreases to values around 1013 cm−2 [6,17–20].
In Nakagawa’s scenario [3] it is assumed that half an electron is missing from the uppermost AlO2 layer. According to some authors [21–23] this half
elec-tron comes from the ionization of oxygen atoms at the surface of LaAlO3. The
creation of donor states at the interface depends on the internal field and conse-quently on the thickness of the grown film. With the formation of these vacancies, in-gap states will appear close to the conduction band of LaAlO3 and the
elec-trons released are transferred to the interface, reducing the film’s electric field
and enabling conduction, as shown in Figure 3b. A critical thickness is also ex-pected, directly related with the formation energy of an oxygen vacancy at the surface.
6 leads to an increase of the internal polar field, which will favor thermodynami-cally the formation of shallow donors and deep acceptor states. This approach however has to be carefully interpreted, since it regards a system in a non-equi-librium state (during growth).
1.2.
Devices and Suppression of the Critical Thickness
Aside from the questions left unanswered about the behavior of this system another issue rises. For the use of LaAlO3/SrTiO3 in spintronic devices, it is of
the upmost importance to control the tunnel barrier resistance. Tuning the thick-ness of the barrier is one solution, but as we saw previously, a minimum of 4 uc of LaAlO3 is imperative for conduction. In [25] the resistance imposed by this
thickness, is extremely beneficial for spin injection. Indeed, the conductivity mis-match problem discussed in [26] is inherently solved by the LaAlO3, since it acts
as a tunnel barrier [27,28]. The problem here is in terms of spin detection. A dras-tic reduction of the barrier resistance is required.
Figure 3 – The role of oxygen vacancies. a) Conductive-tip atomic force microscopy (CT-AFM) resistance mapping around the interface. In the left case conduction spreads in depth through the SrTiO3 substrate most likely due to oxygen vacancies formed during growth
pro-cess. An oxygen annealing fills these vacancies and interfacial conduction is achieved. (Mod-ified from [6]) b) Band diagram of an interface between a polar film and nonpolar substrate. Donor states are created through the appearance of vacancies at the surface leading to electron
7 Density functional theory (DFT) calculations showed that by introducing a metal overlayer on top of LaAlO3/SrTiO3 structures, the LaAlO3 critical
thick-ness can be suppressed [29]. Taking the example of a Ti capping, besides the ap-pearance of a Schottky barrier between the metal and oxide film, a total attenua-tion of the internal field in the LaAlO3 and an enhanced carrier concentration in
the n-type interface is obtained. For a Fe capping the film shows a similar field, but for other metals like Cu, Ag, or Au the field is large, even larger than in the uncapped LaAlO3/SrTiO3 in the case of Au. Arras et al. [29] also made an analogy
between the work function of each metal and the observed calculations, since different metals show their own influence on the electrostatic boundary condi-tions. Higher work functions might preclude charge transfer to the interface and prevent the formation of the q2DEG.
Figure 4 – Co capped LaAlO3 (<4uc)/SrTiO3 transport measurements. Experimental
longitu-dinal sheet resistance and Hall effect measurements for capped structures with different LaAlO3 thicknesses at low temperature. All curves gathered are rather similar to the behavior
of a reference LaAlO3/SrTiO3 with 4 uc (black curved) which proves that a q2DEG can be
8 This critical thickness reduction was experimentally demonstrated in our lab using a Co overlayer [30]. Figure 4 shows a strikingly similar behavior be-tween LaAlO3 (4uc)/SrTiO3 and the Co/LaAlO3 (n)/SrTiO3 with n=1, 2 and 4 uc.
Additionally, the carrier concentrations extracted from the Hall measurements are indeed larger1 than the uncovered structures, just like Arras et al. predicted.
Nevertheless, in order to viably use the metal has a modulator of the properties of the q2DEG at the interface, further tests and evaluations must be made. In this dissertation we will focus on the magnetotransport of metal/LaAlO3/SrTiO3
(metal: Ti, Ta, Co, Py2, Pt, Pd and Au) heterostructures. We will also discuss two
mechanisms behind the formation of the q2DEG for these types of structures and look at the magnetotransport data gathered.
1 As we will see ahead, the carrier concentration can be estimated by the slope of the Hall curve at high
fields. A smaller slope translates in a higher carrier concentration.
9
Methods
The growth of oxides is a task that involves extremely well defined param-eters. Three aspects must be thoroughly investigated in order to have a hetero-structures with the desired properties: the substrate, the target and the growth conditions. For this work, (001)-oriented SrTiO3 substrates with TiO2 termination
from CrysTec GmbH were used. The 7 x 7 mm2 substrates are terminated (with a
miscut of 0.05°– 0.1°) by Crystec, shipped to the lab and then cutted by us with Diamond Wire Saw Cutting in four 3 x 3 mm pieces. The termination is then in-vestigated with atomic force microscope (AFM) before starting the growth. A quality check was additionally done in between each process3. Also, SrTiO3
sub-strates were at first terminated by us, following the Kawasaki method [31], which led to identical topography and transport properties as the ones terminated by
Crystec.
In order to grow the LaAlO3 layer we used pulsed laser deposition (PLD)
as it is the preferred technique to grow high quality oxide structures. A schematic of the process can be seen in Figure 5a. A single crystal of LaAlO3 was ablated by
a KrF (248 nm) excimer laser at a repetition rate of 1 Hz and with a fluence of 0.7 J/cm2. The laser passes through a slit, which defines its beam size. The beam is
guided though deflecting mirrors, focused on the target with two converging
3 For the heterostructures, the metal deposition is made in-situ with a connected sputtering chamber, which
prevents us from checking the quality with AFM between growths. Nevertheless, LaAlO3/SrTiO3 without
metal were extensively investigated before stepping onto the metal heterostructures, to ensure that the PLD step was producing high quality samples.
10 lenses and then passes through a quartz window before reaching the target. The energy was tuned with a regulated attenuator placed between the slit and the lenses making the energy that reaches the target variable, while maintaining a laser source voltage constant at 21 kV. It is also worth mentioning that the energy was measured using an energy sensor placed between the converging lenses and the quartz window4. A sketch of the optical path is shown in Figure 5b. During
ablation the target was rotated in an inward circular like motion to avoid melting and subsequent change of the target stoichiometry. Moreover, the target was pol-ished with sandpaper and pre-ablated at a laser fluence of 1 J/cm2 at a repetition
rate of 5 Hz for a total of 20000 pulses. The background pressure was kept at 2 × 10⁻⁴ mbar of oxygen. This process was done every 20 growths to ensure a good
surface for ablation.
The TiO2 terminated substrates, glued to a substrate holder using silver
epoxy, were kept at 730 °C under a partial oxygen pressure of 2 × 10⁻⁴ mbar and with a substrate-to-target distance of 5 cm. The layer-by-layer growth allows us to have a precise control over the LaAlO3 thickness through real-time monitoring
of reflection high-energy electron diffraction (RHEED) intensity oscillations. An electron gun generates a beam (30 kV) that irradiates the surface of the target at an incident angle of 1-2⁰ . Reflected electrons are collected with a phosphor screen and imaged by a CCD camera. In Figure 5c we can see the layer by layer growth of samples with different LaAlO3 thicknesses.
The intensity starts dropping when the first species arrive at the substrate and as they form a new layer of material the signal gets back (or close) to the initial intensity (further explanation in Annex 1 – Growth Modes). Therefore, each peak represents exactly one unit cell grown, with around 20 pulses required per unit cell (for the fluence previously mentioned). After the desired thickness is achieved the temperature of the sample is lowered to 550 °C at a rate of 20 °C/min. and put at a pressure of 0.1 mbar of O2.
4 This measured energy does not take into account the attenuation imposed by the quartz window. Since
this window is in contact with the deposition chamber, it will eventually get “dirty” over time. A fluence of 0.7 J/cm2 enabled good LaAlO3/SrTiO3 samples for a clean window (97% transmission) but the transmission
can get down to 70% with a few tens of deposition processes. Regarding this issue, the window was cleaned regularly, or a generic LaAlO3/SrTiO3 sample was made from time to time, in order to adjust the energy
11
Figure 5 – Experimental PLD system. a) Schematic illustrating the PLD system used. Four different targets are available inside the chamber. The KrF excimer laser shoots the desired target, creating a plume of material to be deposited. The substrate holder is heated with an infrared laser and the temperature is measured by two pyrometers (one on the top and an-other on the bottom measuring the sample directly). The turbomolecular pump (TMP) and rough pump (RP) allow a vacuum inside the chamber of around 10-9 mbar. b) The beam
ge-ometry is firstly defined by a slit. It goes through a variable attenuator and an optical stage composed by two converging lenses (focal lengths fo1=100 mm and fo2=150 mm) to define the
spot size. Additional deflecting mirrors for beam guidance are not shown for clarity [64]. c)
12 The samples are then annealed at 550 °C for 60 min at a partial oxygen pres-sure of 200 mbar, to fill oxygen vacancies (as suggested in [9]). Finally, they were cooled down at 25 °C/min, at the same pressure, until they reach room temper-ature.
Several samples of 5 and 10 uc were made to ensure that a q2DEG was pre-sent in all of them. After growth, the room temperature sheet resistance of each sample was checked using four-wire van der Pauw configuration. As we will see ahead the values achieved were around 100 kΩ/□, indicating good sample qual-ity.
With the process optimized, 1 and 2 uc structures were made for metal dep-osition. Magnetron sputtering was used to deposit different metals. This process was made in-situ and right after PLD to prevent contaminants in between the LaAlO3 and the metal layer. The specific deposition parameters, like partial
chamber pressure, power and excitation current had to be changed for each metal, depending on their wetness and adhesion on the LaAlO3 surface.
Additionally, SrTiO3 substrates were carried through the whole cycle
de-scribed (skipping the laser shooting and the metal deposition) to ensure that an observed conductive interface was not due to doping of the substrates during the growth process. All SrTiO3 substrates measured after this test were insulating.
The samples were contacted with aluminum wire using ultrasonic wire wedge bonding in four-wire van der Pauw and Hall configuration. The magne-totransport properties of the heterostructures were measured with Quantum
De-sign’s Physical Property Measurement System (PPMS) Dynacool with tempera-ture ranging from 300 to 2 K and magnetic fields ranging from 0 to 9 T. The meas-ured raw curves were antisymmetrized accordingly to the method described in Annex 2 – Antisymmetrization and Symmetrization Method, to avoid unwanted contribution of potential misalignment of the contacts during bonding.
13
Results and Analysis
We performed topographical and magnetotransport experiments on LaAlO3/SrTiO3 samples and metal/LaAlO3/SrTiO3 using different metals.
Atomic force microscopy (AFM) was used to analyze surface morphology, to en-sure good growth and deposition quality. The transport data was analyzed using van der Pauw method and Hall effect in order to give further insight on the be-havior of the q2DEG at a wide range of temperature and magnetic fields and for different electrostatic boundary conditions induced by a top layer. The strong spin-orbit interaction known to be present in the q2DEG is also taken into ac-count. A comparison is made between structures with different capping layers and two mechanism are proposed regarding the formation of the q2DEG.
3.1.
Surface Morphology
Structural quality is one of the most essential steps to achieve quality LaAlO3/SrTiO3 interfaces. Given the sensibility of conditions for the formation
of a q2DEG, making sure that the growth process leads to high quality surfaces is a challenge. Fortunately vast theoretical and experimental studies have been carried in the past, which enables us to save a lot of time. We will therefore not focus on the variation and consequences of these conditions, but rather on the analysis of the good samples.
14 We have performed a brief AFM topography study of TiO2 terminated
SrTiO3 substrates, LaAlO3/SrTiO3 and metal/LaAlO3/SrTiO3 heterostructures.
On the left side of Figure 6 we show the topography of each of these structures. Each image was split in two different post acquisition processes, the first one be-ing a flattenbe-ing and the second a plane fit. These treatments are usually done in
Figure 6 - Surface morphology analysis using AFM with both flatten and plane fit treat-ment. a) Bare TiO2 terminated SrTiO3 as received from Crystec. b) LaAlO3 (4uc)/SrTiO3 c)
AlOx/Py/LaAlO3 (1uc)/SrTiO3. The Al was used to protect the Py layer and most likely takes
15
order to remove background “bow” and “tilt” due to the movement of the tip. On the right side we plotted the height progression (y), slicing the plane fit image (x).
Starting with the bare SrTiO3, a good surface with step terrace is shown
(Figure 6a). The step has an approximate height of 0.48 nm which is fairly similar to the 0.39 nm lattice parameter for SrTiO3 (see fig. 1). We estimated the root mean
square surface roughness value (𝑅𝑞) averaging over three 2 x 1 μm images from different locations across the sample. For the bare SrTiO3 we obtained 𝑅𝑞 =
0.70 Å. These surface roughness values are in fact mainly dominated by the steps and terraces of the substrate. The scan done after a LaAlO3 growth is shown in
Figure 6b. The roughness 𝑅𝑞= 0.81 Å is quite similar to the one obtained previ-ously. This suggests smooth and continuous full coverage of the LaAlO3 layer
grown. Moreover, both the surface topography and the step height are very sim-ilar to the former. Lastly, we look at AlOx/Py/LaAlO3 (1uc)/SrTiO3. We should
first note that this sample does not come from a metal deposition on the LaAlO3/SrTiO3 analyzed in Figure 6b (check footnote 3). Nevertheless we
simi-larly extracted 𝑅𝑞= 1.56 Å. It is also important to note that the metal tends to oxidize over time. The sample shown in Figure 6c was measured one month after metal deposition. The AFM image shows a slight formation of what possibly is aluminum oxide which might explain the increasing roughness. The characteris-tic step terrace surface of the underlying LaAlO3 is however still clearly visible,
which demonstrates a uniform metal deposition.
Additionally, a sketch of the step terrace surface is displayed in Figure 7a for a clearer understating of the analysis done above.
As mentioned in Methods, RHEED was used to track real time the growth evolution. The plot shown in Figure 5c comes from the intensity of the RHEED patterns obtained by the diffraction of electrons in the sample structure. Patterns are shown for the three different structures. Since the main point of this disserta-tion is not the study of LaAlO3 growth, will not go too deep into the study of
these patterns. However, we can see that for both SrTiO3 and LaAlO3/SrTiO3,
sharp Bragg diffraction rods and Kikuchi lines are observed, which is indicative of a high crystalline quality. For a metal capping on top of LaAlO3/SrTiO3 the
16 seen for polycrystalline films, where there is no preferential orientation.
3.2.
Transport Properties
3.2.1.
Van der Pauw Method
The van der Pauw method has been used for the last fifty years to accurately measure the electrical properties of samples with any arbitrary shape. Through these measurements, physical properties such as the doping type, sheet carrier density and sheet resistance can be determined. As a requirement, the sample must have uniform thickness, homogeneous composition and isotropic electrical properties. The contacts must be placed on the perimeter of the structure and be much smaller than the whole area measured. The schematic on the left side of Figure 8 shows the four-point van der Pauw configuration used in our samples. A current I is applied through contacts a and b and a voltage drop V is measured between contacts d and c, which results in a resistance given by:
17 𝑅𝑎𝑏,𝑑𝑐 = 𝑉𝐼𝑑𝑐
𝑎𝑏 (1)
Since 𝑅𝑎𝑏,𝑐𝑑 = 𝑅𝑐𝑑,𝑎𝑏 accordingly to the reciprocity theorem (interchangea-ble current/voltage contacts), average values for 𝑅𝑥𝑥 = (𝑅𝑎𝑏,𝑐𝑑+ 𝑅𝑏𝑎,𝑑𝑐)/2 and 𝑅𝑦𝑦 = (𝑅𝑎𝑑,𝑐𝑏+ 𝑅𝑑𝑎,𝑏𝑐)/2 can be determined. From [32] we can represent the
re-sistivity ρ as:
𝜌 =ln(2)𝜋𝑑 𝑅𝑥𝑥+ 𝑅2 𝑦𝑦𝑓 (2)
where d is the thickness of the sample and f is the van der Pauw correction factor that relates with the ratio 𝑅𝑥𝑥/𝑅𝑦𝑦. Since the samples have a square shape and the bonding is done in the corners, we assume that 𝑅𝑥𝑥 ≈ 𝑅𝑦𝑦, within a few per-centage of error. Therefore, 𝑓 ≈ 1 and eq. (2) can be reduced to:
𝑅𝑠 = 𝑅𝑥𝑥ln (2)𝜋 (3)
Figure 8 - Schematic of the connection in van der Pauw and Hall configuration. The alumi-num wire is buried deep in the heterostrucure so that two current density are measured: jM
and jSTO, contributions from the metal and q2DEG respectively. An additional schematic from
18 where 𝑅𝑠 (Ω/□) represents the ratio 𝜌/𝑑 for a two-dimensional electron gas of unknown thickness.
3.2.2.
Hall Effect
When an out-of-plane magnetic field B is applied to a conductor, charged particles in motion will be deflected. This phenomenon can be described in a semi-classical approach with a Lorentz force 𝑭 given by:
𝑭 = 𝑞(𝑬 + 𝒗 × 𝑩) (4)
where q and vare the charge and velocity of the carriers and Eis the electric field. On the right side of Figure 8 a top-view scheme illustrates an applied current between 𝐼+and 𝐼− where the trajectory of electrons is bended due to B, and a voltage between 𝑉𝐻+and 𝑉𝐻− develops.
For a 2D conductor the resistance is dimensionally equivalent to a resistivity for an unknown thickness, so that the transverse resistivity can be written as:
𝜌𝑥𝑦2𝐷 = 𝜌𝑥𝑦3𝐷. 𝑑 =𝑉𝐻 −− 𝑉
𝐻+
𝐼−− 𝐼+ = 𝑅𝑥𝑦𝑠ℎ𝑒𝑒𝑡 (5)
The current density induced by an electric field perpendicular to an applied
uniform magnetic field can be expressed by Ohm’s law as:
𝝆𝒋 = 𝑬 (6)
where the tensor of resistivity has the form of:
𝝆 = ( 𝜌𝑅 −𝑅𝐻𝐵
𝐻𝐵 𝜌 ) (7)
Since the Hall coefficient is given by 𝑅𝐻= −1/𝑛𝑞, where 𝑛 is the total charge carrier concentration, the transverse resistance of the q2DEG only can be written in terms of the q2DEG charge carrier density 𝑛𝑆 and the current 𝐼∗ that flows in the q2DEG as:
𝑅𝑥𝑦∗ = −𝑛𝐵 𝑆𝑞 =
𝑉𝐻
19 With 𝑉𝐻 = 𝑅𝑥𝑦𝐼𝑇 (subscript T meaning total = q2DEG + metal contribution) and knowing 𝐼𝑇 and 𝐼∗, 𝑛𝑆 given in cm−2, can be written as:
𝑛𝑆 = 𝑅 𝐼∗
𝐻𝑞𝐼𝑇 (9)
where 𝑅𝐻= − 𝑅𝑥𝑦⁄𝐵 and is equivalent5 to the slope obtained from a linear fit to
the transverse magnetoresistance 𝑅𝑥𝑦(𝐵). A positive 𝑛𝑆 comes from a negative slope of the curve and corresponds to electron-based conduction.
Additionally, from Drude formula the conductivity comes:
𝜎𝑥𝑥3𝐷 =𝜌1
𝑥𝑥3𝐷= 𝑞𝑑𝜇𝐻𝑛
3𝐷 (10)
Again, since we are dealing with a 2D conductor, 𝑛3𝐷⇔ 𝑛2𝐷. Finally, the Hall mobility 𝜇𝐻, given in cm2/(V. s), can be written as:
𝜇𝐻 =𝑞𝑅1
𝑠𝑛2𝐷 (11)
3.2.3.
Quantum Corrections
Although the semi-classical approach is able to provide us reasonable in-sights, dealing with two dimensional systems at low temperatures requires also a quantum mechanical approach.
For an electron traveling in a disordered system closed time reversed paths have to be considered, due to elastic scattering events. Constructive interference between pairs of these paths will increase the probability to find a particle at a given position and time, thus enhancing localization. This phenomenon is called weak-localization (WL) and will eventually lead to a quantum reduction of con-ductance. An external magnetic field is expected to suppress weak-localization,
5 This equivalence is valid when only one type of carrier contributes for conduction. As we will see ahead,
20 since it will break time-reversal symmetry, and conductance increases. However, in the presence of spin-orbit coupling6, the spin of the electron cannot be
ne-glected. Along two time-reversal paths the electron will suffer opposite spin ro-tation, and ultimately, destructive interference between these two events reduce the probability to find the electron, and conductance increases. This is known has weak-antilocalization (WAL). Yet again, the presence of an external magnetic field will preferentially influence the spin rotation mechanism. The WAL positive contribution is suppressed and therefore magnetoconductance decreases. The ef-fect of both WL and WAL on the magnetoconductance is displayed in Figure 9.
3.2.4.
Band Structure and Spin-Orbit Interaction
As mentioned before, Ti atoms in the system will be able to host electrons in their 3d conduction band. In the schematic of Figure 10a we consider Ti atoms in cubic SrTiO3 where the quintuplet of states of an isolated Ti atom breaks into
a two-fold 𝑒𝑔 and three-fold 𝑡2𝑔 set. In bulk, the three 𝑡2𝑔 bands have an
ellipsoi-dal Fermi surface and are centered at the Γ point. At the LaAlO3/SrTiO3 interface
6 Spin-orbit coupling can be seen as an additional contribution to the Hamiltonian of the system that
de-scribes the interaction between the particle spin and its motion.
21 the degeneracy is lifted due to tetragonal distortion and broken inversion sym-metry. The 𝑑𝑥𝑦 band is therefore shifted to a lower energy relative to the 𝑑𝑥𝑧/𝑦𝑧 bands [33], as we can see in Figure 10b. For lower carrier densities, we can con-clude that all electrons are expected to reside in the 𝑑𝑥𝑦 band and only one type of carries is present in the system. With increasing carrier density the 𝑑𝑥𝑧/𝑦𝑧 bands are populated and conduction is expected to be held by multiple types of carriers. It is important to notice here how the transport analysis regarding a sin-gle band model is insufficient to describe the system at high carrier densities alt-hough it might give us a glimpse of some basic electronic features. This point will be addressed in the next section.
Yet again, adding spin-orbit interactions (SOI) furthers increases the com-plexity. In [34], it is discussed that most spin-orbit effects in the system come from atomic spin-orbit (ASO) coupling. From Figure 10c, the main effect of ASO to the band structure is the band mixing at the Γ point seen in the bottom of the 𝑑𝑥𝑧/𝑦𝑧 bands. Since the Rashba SOI present in the system is closely connected with ASO interaction, the Rashba SOI strength will also peak at the bottom of 𝑑𝑥𝑧/𝑦𝑧 bands, as seen in Figure 10d. It is worth to say that the large SOI existing within the q2DEG at LaAlO3/SrTiO3 interface originates from either or both the Rashba SOI
[35,36] and ASO interaction [34].
22 is observed (when 𝑑𝑥𝑧/𝑦𝑧 bands begin to be populated). Further increase of the carrier concentration might eventually lead to a regime that Fête et al. calls Anom-alous Metal [39]. As we will see ahead it is indeed possible that the metal capped structures are in this regime, since a higher carrier concentration is expected for this specific system [29].
Figure 10 - Band structure and spin-orbit interaction. a) Energy levels of the Ti 3d orbitals in spherical, cubic, tetragonal and non-inverted symmetry. The cubic to tetragonal transition distorts the TiO6 octahedra and lifts degeneracy of the eg and t2g multiplets. The inverted
symmetry in the system leads to completely modified eg and t2g multiplets due to the
confin-ing potential created with interface formation. Specific values taken from x-ray absorption spectroscopy for the amplitude of the splitting can be found in [33]. b) Interfacial d-orbital energy bands of LaAlO3/SrTiO3 aligned at the Γpoint. As shown in a) the dxy is lower in
energy than the dxz and dyz bands. c) Band mixing caused by ASO interaction at the bottom
of dxz and dyz bands. d) ASO strenght along the Fermi surface. The green area represent the
first two bands (dxy and heavy dxz/dyz) while the purple represents the third band (light
dxz/dyz). Modified from [34]. e) Modulation of the magnetoconductance of LaAlO3/SrTiO3
23
3.2.5.
Results of Magnetotransport Experiments
3.2.5.1. LaAlO3/SrTiO3 Heterostructures
Before stepping onto the metal capped heterostructures a brief overview of LaAlO3/SrTiO3 samples with more than 4 uc should be made. In Figure 11 we
display the analysis of a 5 uc LaAlO3/SrTiO3 sample, grown at 730 °C with a
fluence of 0.7 J/cm2 at a partial oxygen pressure of 2 × 10⁻⁴ mbar (with the
rec-ommended post annealing at 200 mbar of O2 and 550 °C to ensure the filling of
oxygen vacancies).
The sheet resistance, calculated using eq. (3), is represented in Figure 11a. A reduction of about two orders of magnitude is observed, which indicates me-tallic behavior, with a low temperature resistance of ~70 Ω/□, a value that goes along with what is found in the literature for a q2DEG in this system. The data showed only reflects measured values during cooling, however, similar results were obtained when measuring in the warming procedure. In Figure 11b we plot the Hall magnetoresistance at 2 K with magnetic fields in the range of 9 T. Alt-hough there is a slight non linearity observed, since we are dealing with carrier concentrations of about 3 × 1013 cm−2 we assume that carriers in the 𝑑𝑥𝑦 band dominate the transport readings. We are then in conditions to use the equations obtained in 3.2.1 and 3.2.2. We start by extracting the dependence of carrier con-centration over temperature. 𝑛𝑆 for each temperature is calculated with eq. (9) where 𝐼𝐼∗
𝑇 = 1 (all current going to the q2DEG) and 𝑅𝐻 equals the slope of the Hall trace for high magnetic fields. As we will see ahead this consideration will be of extreme importance for a correct extraction of the carrier concentration in the system. Contrary to the great dependence of the sheet resistance with tempera-ture, the same dependence is not observed in the carrier concentration, as ob-served in Figure 11c. A weak dependence with temperature is only observable between 100 K and 300 K. The variation in sheet resistance is in fact due to an increase of electron mobility for lower temperatures, as we will discuss ahead, and possibly due to the cubic to tetragonal transition around 105 K in bulk SrTiO3, which is known to lift orbital degeneracy (see Figure 10a). We
24 𝑀𝑅 =𝑅𝑥𝑥(𝐵) − 𝑅𝑅 𝑥𝑥(0)
𝑥𝑥(0) (12)
We achieved an MR of about 20% for 9 T magnetic fields at low tempera-tures, values that are again along the ones seen in the literature for similar LaAlO3/SrTiO3 samples.
The carrier concentration achieved is much lower than the 3.3 × 1014 cm−2 predicted by the polar catastrophe model. This discrepancy has been ascribed to
Figure 11 - Transport properties of a LaAlO3 (5uc)/SrTiO3 sample. a) Sheet resistance as a
25 carrier localization due to charge trapping by defect states. Hall measurements will not take into account carriers that are not contributing to conduction. Only mobile carriers are considered, which might explain the low carrier concentration observed. We should also note that the measured carrier densities vary from sam-ple to samsam-ple (approximately from 1013 to 5 × 1013 cm−2 ). Using only RHEED as the thickness probing technique might lead to two 5 uc samples with different thicknesses. Additionally, since samples are taken from vacuum to be measured, and some of them stay stored in boxes for long periods for time, adsorbates at the LaAlO3 surface may also incite electrostatic doping.
The temperature evolution of the q2DEG mobility is displayed in Figure 11d. Values range from 5 cm2/(V. s) at high temperatures to 4000 cm2/(V. s) at 2 K. This high temperature dependence might be attributed to fundamental behav-ior of SrTiO3 crystals. Increasing phonon-electron scattering is expected with
in-creasing temperature, which ultimately results in a decrease of electron mobility. On the other hand, the low temperature mobilities are suspected to be reduced by impurity scattering. This problem can be lessen with better interface crystal-line quality, mainly controllable by taking more carefully into account the SrTiO3
substrate termination and how good is the arrival of the initial species at the sub-strate. Finally, given the huge temperature dependence of the dielectric constant of bulk SrTiO3 (four orders of magnitude), the potential well where mobile
carri-ers evolve may also change. Although the internal electric field observed in the system is known to damp the dielectric constant [40], the effects on the band structure should also be taken into consideration.
3.2.5.2. Metal/LaAlO3/SrTiO3 Heterostructures
With the analysis above we conclude that our samples show a q2DEG with properties very similar to the ones described in the literature. A good platform can now safely be used to further analyze the behavior of LaAlO3 (n<4
uc)/SrTiO3 structure with different metal capping layers.
26 include the contribution of both conductive paths, one through the q2DEG and the other through the metal. In order to isolate the gas contribution a simple par-allel resistance model gives the evolution of the resistance in the gas with tem-perature (𝑅𝑥𝑥𝑞2𝐷𝐸𝐺), taking into account the resistance of the metal contribution (𝑅𝑥𝑥𝑀) and the total resistance measured (𝑅𝑥𝑥𝑚𝑒𝑎𝑠):
𝑅𝑥𝑥𝑞2𝐷𝐸𝐺(𝑇) = 𝑅𝑥𝑥
𝑀(𝑇) · 𝑅
𝑥𝑥𝑚𝑒𝑎𝑠(𝑇)
𝑅𝑥𝑥𝑀(𝑇) − 𝑅𝑥𝑥𝑚𝑒𝑎𝑠(𝑇) (13)
The preferred procedure to extract the metal contribution 𝑅𝑥𝑥𝑀(𝑇) with tem-perature is to fabricate metal/SrTiO3, metal/LaAlO3 or even metal/SiO2
hetero-structures and measure the longitudinal transport properties7. Unfortunately,
these samples were not grown along with the samples analyzed ahead. To pre-serve a consistency between the metal thickness of metal/SrTiO3 and respective
metal/LaAlO3/SrTiO3 the samples should be made consecutively. Due to time
constrains, repeating the whole set of samples turned out to be impossible during this master’s dissertation. However, in [30] the Co/SrTiO3 sheet resistance shows
almost no variation with temperature. Although it might be risky to generalize this occurrence for all the metals used here, the variation over temperature will hardly be in the variation range of the q2DEG (two order of magnitude against a few tens of ohms). We will then make two assumptions in our analysis regarding this matter. Since the usual resistance of the q2DEG at room temperature is much larger than the resistance of the metal, we shall say that 100% of the current in the system is flowing in the metal at room temperature. This room temperature metal resistance will also be assumed to have no dependence with temperature. At this point it is important to note that these assumptions give our analysis a more qualitatively character than a quantitatively one.
But is it safe to use this simple parallel conduction model? Since we are sim-ultaneously sourcing the two metallic layers, other effects regarding the
7 We believe that the transport properties of the three configuration would be similar, however it is possible
that in the SrTiO3 case, oxygen vacancies would form at the interface, and again two contributions would
27 proximity of both conductive paths, like tunneling of electrons through the ex-tremely thin LaAlO3, do not need to be regarded.
Inspired by Figure 4 [30], we plot in Figure 12 the sheet resistance for four different metal/LaAlO3/SrTiO3 heterostructures, using Ti, Ta, Co and Py as
metal cappings and a LaAlO3 thickness of only 2 uc. LaAlO3/SrTiO3
heterostruc-tures (without cappings) with less than 4 uc are known to be insulating, however
Figure 12 - Sheet resistance as a function of temperature using different metal cappings on LaAlO3 (2uc)/SrTiO3. Measured longitudinal resistance 𝑅𝑥𝑥𝑚𝑒𝑎𝑠 (strong colored curve) and
𝑅𝑥𝑥𝑞2𝐷𝐸𝐺 (light colored curve) extracted with the parallel currents of the metal and q2DEG
(in-set) for a) Ti b) Ta c) AlOx/Co and d) AlOx/Py. The sheet resistance of the previous LaAlO3
(5uc)/SrTiO3 (black curve) is used for comparison. The metallic layer’s sheet resistance is
28 we can see that the light colored curve of each plot (q2DEG contribution only) is very similar to the 5 uc LaAlO3/SrTiO3 sample measured before (black curve).
These results suggest that not only the theoretical predictions on the formation of a q2DEG made by Arras et al. were correct, but also that the critical thickness suppression observed by Lesne et al. in Co capped LaAlO3 (n<4 uc)/SrTiO3
ex-tends to other metals. An additional inset in each plot shows the current distri-bution within the two metallic paths over temperature, calculated with the re-sistance relation showed by eq. (13) and taking into account the assumptions made previously. Ti, Ta and Co capped structures show a dominance of the q2DEG current over the metal current at lower temperatures. Interestingly, the q2DEG current in the Py capped structure never goes above the metal current, which hints for the possible importance of a deeper analysis of the electrical char-acterization of metal (only) samples.
Regarding Hall measurements, the curves were antisymmetrized following the procedure described in Annex 2 – Antisymmetrization and Symmetrization Method in order to remove possible misalignment of contact geometry. For the 5 uc sample analyzed previously (Figure 11), the Hall trace is reasonably linear at low temperatures and shows a total carrier concentration of 3 × 1013 cm−2. How-ever, as depicted in Figure 13 the Hall trace for metal capped structures shows a clear non-linear behavior. Moreover, at 300 K we only see a contribution of the metal, an effect that is very clear especially in Figure 13c, where the Co anoma-lous Hall effect is observed for magnetic fields below 1.2 T (characteristic of a ferromagnetic metal) and a weak negative slope is present for magnetic fields above 1.2 T. This slope of -23 mΩ/T translates in a carrier density of ~1023 cm−3, typical for a (3D) metal.
29 to determine separate carrier concentrations and mobilities. This model takes the form of [42]:
𝑅𝑥𝑦(𝐵) = 𝐵𝑅𝐻 = 𝐵1𝑞(𝑛1𝜇1 2+ 𝑛
2𝜇22) + (𝑛1+ 𝑛2)(𝜇1𝜇2𝐵)2
(𝑛1𝜇1+ 𝑛2𝜇2)2 + (𝑛1 + 𝑛2)2(𝜇1𝜇2𝐵)2 (14)
where (𝑛1, 𝜇1) and (𝑛2, 𝜇2) are transport coefficients for two different bands. As we see the complexity increases compared to the simple approach of eq. (9) and (11). A number of publications use this model to fully extract carrier concentra-tion and mobilities for two bands contributing to conducconcentra-tion in the system [43–
Figure 13 - Hall effect measurements using different metal cappings on LaAlO3
(2uc)/SrTiO3. For all samples, a) Ti b) Ta c) AlOx/Co and d) AlOx/Py, the room temperature
30 47]. However, as briefly discussed in [34] supplementary, the model has to be used with caution. Eq. (14) assumes that 𝑅𝑥𝑦 behaves similarly in both low and high magnetic field regimes, yet, further consideration need to be made.
In the low magnetic field regime (<1 T), the slope of the Hall trace takes the form of:
𝑅𝐻0 = −(𝑛1𝜇1 2+ 𝑛
2𝜇22)
𝑞(𝑛1𝜇1+ 𝑛2𝜇2)2 (15)
This slope, contrary to the simple inverse relation with carrier concentration (eq. (9)), represents a mobility-dependent mean carrier concentration in the sys-tem. Joshua et al. [34] noted that while extracting transport parameters using the two band model and gate dependence, the total carrier concentration decreases with increasing gate voltage (increasing doping), a clear non-physical behavior. Rewriting the model using three bands instead of two, more realistic Fermi sur-faces or including the effect of ASO could maybe reduce deviations from real values, but the complexity of calculation would increase exponentially.
For a large magnetic field regime (≫1 T), the slope can be written as:
𝑅𝐻∞ = −𝑞(𝑛 1
1 + 𝑛2) (16)
In this case the total carrier concentration in the system 𝑛𝑆 = (𝑛1+ 𝑛2) can be extracted. Although the above equation was deduced at the limit of large mag-netic field regime, the +-9T used in our experiments should suffice to extract fairly acceptable parameters. In the four plots displayed in Figure 13 the slope decreases with increasing magnetic field. Arras et al. predicted higher carrier con-centrations for metal capped LaAlO3/SrTiO3 structures. This might be due to
doping from the metal, since the electrostatic boundary conditions at the LaAlO3
surface are different from bare LaAlO3/SrTiO3 samples. Accordingly, from the
31 of simplicity that the contribution of the very thin metallic films for the Hall re-sponse is negligible, since 𝜇𝑀 should be less than 1 cm2/(V. s). Mobilities of 280, 134, 121 and 1.35 cm2/(V. s) for Ti, Ta, Co and Py capped structures, respectively, were obtained. These values are lower than the 4000 cm2/(V. s) of the 5 uc LaAlO3/SrTiO3 sample analyzed. However, these are nothing but a balanced
mo-bility of both types of carriers (maybe three if the metal is considered). It is pos-sible that carriers in one of the bands are in fact much slower while the other type reaches mobility values near the ones achieved for LaAlO3/SrTiO3 samples. MR
values (inset of Figure 13) calculated for each sample show yet again that at room temperature only the metal is conducting, hence the flat MR observed for all sam-ples. At low temperatures MR ranges between 30% and 60%, which reinforces our belief regarding the presence of a q2DEG and its dominance in the parallel conduction model.
Although all the metals used above seem to induce a q2DEG in the system, another scenario is observed for a second set of metal cappings. Figure 14 shows the Hall trace for Au, Pt and Pd capped LaAlO3 (2uc)/SrTiO3. Both longitudinal
resistance values and slopes achieved are shockingly different from the previous four samples. The Hall trace is also perfectly linear for the range of magnetic field used, with 𝑅𝐻 of 20, 17 and 5 mΩ/T for Pd, Au and Pt capped structures respec-tively. These values lead to 3D-like carrier concentration of ~1023 cm−3 support-ing the fact that we are only measursupport-ing the Hall trace of the metallic layer, and therefore no q2DEG is present in the system. The extremely low MR further strengths this conclusion.
In addition, a parallel can be made with the analysis of Caviglia et al. [35] seen in fig. 10e. The magnetoconductance of the four samples of the first series is shown in Figure 15. 𝜎2𝐷0 was calculated with Drude’s formula from eq. (10) adapted for 2D system. A small bar on the top indicates the magnetotransport regime according to 𝜎2𝐷0 (adapted from [39]). It seems that for the calculated val-ues, our samples are on what Fête et al. calls the “Anomalous Metal regime”. In this regime the carrier concentration is larger than in the WL and WAL, which is exactly what we saw previously. We can also say that these curves are analogous to a highly electrostatic doped LaAlO3 (n>4 uc)/SrTiO3 where high positive gate
32
Figure 14 - Hall effect measurements using Au, Pd and Pt as metal cappings on LaAlO3
(2uc)/SrTiO3 and corresponding magnetoresistance (inset). The linear Hall effect and the
low values of magnetoresistance at high fields show that there is no formation of a q2DEG.
Figure 15 - Magnetoconductance calculated for metal/LaAlO3 (2uc)/SrTiO3 (metal: Py, Ta,
Ti, Co). The bar at the top situates the sample's magnetotransport regime according to the sheet conductance at zero field 𝜎2𝐷0 (modified from [39]). The high 𝜎2𝐷0 obtained indicate that the metal capped LaAlO3/SrTiO3 samples measured are in the Anomalous Metal regime,


![Figure 9 - Theoretical magnetoconductance curves in the weak localization (black) and weak antilocalization regime (blue) [65]](https://thumb-eu.123doks.com/thumbv2/123dok_br/16694440.743763/42.892.203.637.167.459/figure-theoretical-magnetoconductance-curves-localization-black-antilocalization-regime.webp)

