UNIVERSIDADE DE LISBOA
FACULDADE DE CIÊNCIAS
DEPARTAMENTO DE FÍSICA
!
Mestrado Integrado em Engenharia Biomédica e Biofísica
Perfil em Engenharia Clínica e Instrumentação Médica
Computer Aided Method for 3D Assessment of the Lower Limb
Alignment for Orthopedic Surgery Planning
Tomás Augusto Esteves Ferreira
Dissertação orientada por:
Prof. Doutor Hugo Alexandre Ferreira, Faculdade de Ciências
Jalil Jalal, M.Sc., Technical University of Munich
__________________________________________________________________________
A
CKNOWLEDGEMENTS
__________________________________________________________________________
I would like to start by thanking both my supervisors, Hugo Ferreira and Jalil Jalali, for their support and encouragement, their valuable advice and guidance and also for their friendliness trough all my time as their student. Both of them are excellent professionals and I was lucky to have them as my teachers and supervisors.
I would also like to thank Dr. Julian Fürmetz for teaching me and guiding me trough all the medical aspect of my work and for always being more than helpful.
Completing this work would have been a lot more difficult were it not for my coworkers at the CAPS group: thank you Christina for all the time you spent explaining me everything I needed and for always being availabe to help me with anything; Thank you Andreas for showing me how to proper segment with all your skill and for giving my days a good dose of fun; and thank you Thekla for keeping me company at the office day after day, hearing my problems and, most of all, for being my friend! Vielen Danke!
I would also like to express my deep gratitude to my family, for trusting me, believing in me and encouraging me to always follow my dreams and to always to my best. None of this would have been possible without you and I hope this work makes you proud!
Also, a big thank you to all my friends. My academic experience would have been a total different thing without you. We laughed together, we had fun together, but also worked a lot together, and all your support throughout the years is something I will never forget.
__________________________________________________________________________
R
ESUMO
__________________________________________________________________________
Os membros inferiores são responsáveis por fornecer suporte à totalidade do corpo humano e são essenciais nas mais variadas tarefas como estar de pé, andar e correr. Por vezes, e devido a diversos motivos, podem existir defeitos ou deformações nos membros inferiores que têm um impacto direto na qualidade de vida de uma pessoa, quer por se ver afetado o lado estético pessoal ou por condicionar significativamente a mobilidade. Uma característica da estrutura do membro inferior que é diretamente afetada por estas deformações é o seu alinhamento, isto é, a posição relativa dos ossos e articulações que compõem o membro. Graças à evolução da medicina moderna, corrigir estas deformações é agora uma prática bastante comum no campo da cirurgia ortopédica. No entanto, antes de qualquer cirurgia corretiva e até de qualquer planeamento que esta exija, a deformação tem de ser corretamente analisada, o que é feito através da chamada avaliação do alinhamento do membro inferior. Atualmente, num contexto clínico, esta avaliação é feita manualmente num espaço de trabalho bi-dimensional, normalmente utilizando apenas imagens de raios-X da perna inteira no plano anatómico frontal.
Uma revisão ao estado da arte no que toca a métodos de planeamento cirúrgico dedicados ao membro inferior permite concluir que de facto existe software capaz de realizar este planeamento, mas que, no entanto, para além de terem custos elevadíssimos associados, nenhum utilizada modelos 3D como fonte de informação, o que traria imensos benefícios, especialmente ao nível da informação acerca da rotação e da inclinação dos ossos. Existem no entanto algum software a um nível mais experimental que utiliza modelos 3D para realizar a avaliação do alinhamento do membro inferior, sendo que nenhum deles passou ainda a estar disponível comercialmente.
Numa perspetiva de implementar um método automático baseado em computador para realizar o planeamento pré-cirurgico da cirurgia de correção para ser utilizado em contexto clínico, foi proposto um projeto para o desenvolvimento de um novo software capaz de efetuar a avaliação do alinhamento do membro inferior em modelos 3D dos doentes. O projeto foi dividido em quatro etapas distintas que se desenrolaram ao longo de um estágio de sete meses.
Na primeira etapa, o objetivo consistiu em gerar diversos modelos 3D dos membros inferiores de diferentes pacientes. Para tal, recorreu-se ao software de segmentação de imagens médicas Mimics
14.0 e utilizaram-se imagens de tomografia computorizada dos pacientes. Após o processo de
segmentação, obtiveram-se os modelos 3D cuja qualidade teve de ser assegurada através de um processo de remeshing e cuja correta orientação espacial teve de ser também assegurada, já que a avaliação do alinhamento é sensível à orientação da perna. Para tal, utilizou-se o software de renderização 3D Geomagic Studio 14. Optou-se ainda por separar os modelos dos ossos nas suas porções proximal e distal, de modo a reduzir futuramente os tempos de computação. Findo todo este
processo, assegurou-se que diferentes utilizadores poderiam gerar estes modelos sem grande variabilidade ou erro no resultado final através da comparação dos modelos obtidos de um mesmo paciente por três utilizadores distintos, sendo que os modelos obtidos apresentavam volumes com diferenças inferiores a 1% relativamente ao valor médio e com um baixo desvio padrão.
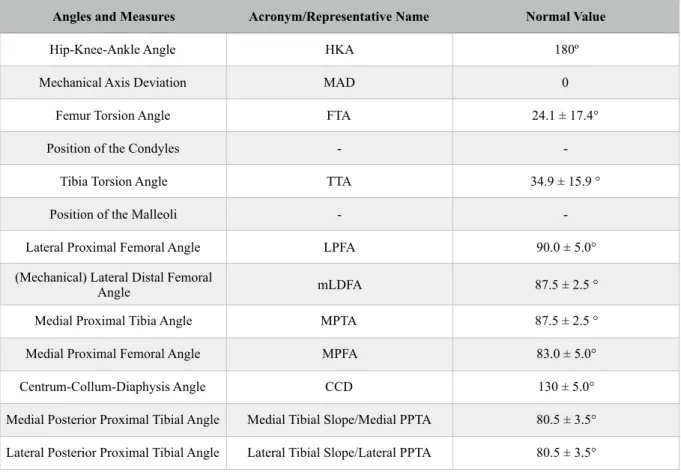
Numa segunda etapa, os ângulos e medidas consideradas necessárias para uma avaliação adequada foram definidos, apresentando os valores esperados para estas medidas de acordo com a literatura. Assim, foi possível definir também os pontos anatómicos que são necessários para a definição destes mesmos ângulos e medidas e que portanto têm de ser encontrados pelo software.
Na terceira etapa, fez-se então o desenvolvimento propriamente dito do software. Encontravam-se já disponíveis alguns métodos automáticos desenvolvidos no contexto projeto, contudo, estes métodos exigiam que o utilizador conhecesse as ferramentas do Geomagic de modo a obter algumas informações, e que depois fosse capaz de utilizar estas informações para editar os scripts de modo a que estes funcionassem para cada paciente em específico. Para além disso, apenas pontos muito específicos podiam ser encontrados. Nesse sentido, isto é, de modo a que todo o processo de encontrar os pontos anatómicos relevantes pudesse ser feito diretamente pelo utilizador, no programa, e sem exigir quaisquer conhecimentos de programação, um conjunto de técnicas foi implementado, dando ao programa uma grande componente gráfica.
Para os diferentes pontos, foi necessário recorrer a diferentes metodologias, algumas desenvolvidas propositadamente para o efeito e implementadas em linguagem de programação Python "pura", e algumas adaptadas de outras já existentes e disponíveis no próprio Geomagic. Foi ainda assegurado que existiam métodos alternativos caso os métodos padrão não fossem os mais adequados devido a uma estrutura diferente da esperada dos próprios modelos 3D.
De todo este processo resultou um programa que usa os modelos 3D gerados e, da maneira mais automática possível e com uma interface do utilizador fácil de usar, fornece todos os ângulos e medidas, efetuando assim a dita avaliação do alinhamento do membro inferior em 3D.
Uma análise ponderada aos resultados obtidos permitiu identificar quais os pontos anatómicos que estarão a ser obtidos de maneira menos ideal e por isso a levar a alguns resultados não tão bons como o esperado. A dependência criada da seleção e limitação de certas áreas nas quais ocorre uma iteração que permite encontrar certos pontos é possivelmente a maior falha do programa desenvolvido que se torna assim demasiado sensível ao input do utilizador. Note-se, contudo, que os próprios testes apresentam algumas falhas que podem influenciar os resultados obtidos, tal como não ter sido definido um roteiro de teste que obrigasse a uma utilização uniforme por parte de todos os utilizadores, e também os diferentes níveis de experiência com o programa por parte dos utilizadores de teste.
No entanto, a maioria das medidas obtidas apresenta valores constantes ao longo de diversas utilizações, igualando os valores que seriam obtidos manualmente, mas com o potencial de os obter em metade do tempo. Pode concluir-se então que, no momento, a avaliação do alinhamento 3D é possível utilizando o software desenvolvido.
É possível ainda apontar algumas limitações e fazer algumas sugestões de modo a que estas sejas ultrapassadas. Algumas limitações partiram do facto da experiência a programar em Python ser bastante limitada, e outras partiram do software utilizado para fazer o desenvolvimento. Por exemplo, o método que teria sido o mais indicado para encontrar um certo número de pontos na Tibia não foi possível de implementar devido a um bug interno do software.
Existe ainda muita coisa que pode ser feita no que toca ao software desenvolvido e ao objetivo final de desenvolver um método de planeamento pré-operativo: em primeiro lugar, é necessário realizar mais testes, de modo a aumentar o tamanho da amostra e o intervalo de confiança dos testes; em segundo lugar, eliminar a dependência do Geomagic para utilizar o programa seria o ideal; finalmente, de modo a completar o plano inicial, deve ser implementada a possibilidade de visualizar o resultado da cirurgia nos modelos 3D.
Palavras-chave: Alinhamento do Membro Inferior; Avaliação 3D do Alinhamento; Software
__________________________________________________________________________
A
BSTRACT
__________________________________________________________________________
The lower limbs are responsible for supporting the body and are essential for several tasks such as standing, walking and running. Sometimes, and due to various reasons, defects or deformities can be found on the lower limbs and this has an impact on a person’s quality-of-life. One characteristic of the structure of the lower limb that is affected by these deformities is its alignment, i.e. the relative positions of the bones and joints that it includes. Thanks to the evolution of modern medicine, fixing these deformities is now a common practice in the orthopedics' surgical field. Before any corrective surgery and its respective planning, the deformity needs to be properly analyzed, which is accomplished by the assessment of the alignment of the whole lower limb. Currently, in clinical setting, this assessment is carried out manually in the two-dimensional space, normally using whole-leg X-ray images of the anatomical frontal plane, but complex deformities can not be assessed properly in a 2D image.
In a desire to create an automatic computer-based method for the preoperative planning of deformity correction and knee surgery, a project consisting of developing a new software for assessing the lower limb alignment based on 3D models was proposed. The project was comprised of four stages: In the first stage, 3D models of different patients’ lower limbs were generated using both segmentation and 3D rendering software, and it was ensured that these models could be generated by any user without significant variability/error in the final outcome; In the second stage, the exact angles and measures needed for a proper assessment were defined, as well as the anatomic landmarks required to calculate them that should then be found by the software; During the third stage, the software development took place, from which resulted a program that uses the generated 3D models and, in the most automatic way possible and with an easy-to-use interface, returns all the needed angles and measures; The final stage of the project was to ensure that the program is reliable and consistent in its results in both intraobserver and interobserver domain, and that it composes an improvement when compared with the manual procedure, while also ensuring that the results obtained by using the program match those obtained manually.
A lot can still be done and improved regarding the developed software and the ultimate goal of fully developing a preoperative planning method, but, so far, the 3D alignment assessment that results from the program has been considered to perform its task properly and in an improved way when compared to the traditional technique, even though some limitations can be observed.
Keywords: Lower Limb Alignment; 3D Alignment Assessment; Computer-based Preoperative
__________________________________________________________________________
T
ABLE
OF
C
ONTENTS
__________________________________________________________________________________ Acknowledgements i Resumo iii Abstract vii Table of Contents ix List of Figures xiList of Tables xiii
List of Abbreviations xv
1. Introduction 1
2. Background 3
2.1. Lower Limb Alignment 3
2.1.1. Structure of the Lower Limb 3
2.1.2. Deformities 5
2.2. Malalignment/Deformity Correction 5
2.2.1. Deformity Analysis/Alignment Assessment Overview 6
2.2.2. Surgery and Planning Overview 6
3. State-of-the-art 9
3.1. Clinically Used Osteotomy Planning Methods 9
3.2. Research on Novel Methods 10
3.2.1. 2D vs. 3D Methods 10
3.2.2. Experimental 3D Software for Alignment Assessment 12
4. Project Overview 15
4.1. Motivation 15
4.2. Objectives 15
5. 3D Modeling of the Lower Limb 17
5.1. Segmentation 17
5.2. Optimization and Preparation 19
6. Program Conception & Design 23
6.1. Definition of Desired Angles and Measures 23
6.2. Definition of Desired Landmarks 26
6.2.1. Landmarks on the Femur 26
6.2.2. Landmarks on the Tibia 28
6.3. Script Development 31
6.4. Graphical User Interface 34
7. Program Testing 41
7.1. Intraobserver Reliability Testing 42
7.1.1. Method 42
7.1.2. Results 42
7.1.3. Analysis 43
7.2. Interobserver Reliability Testing 44
7.2.1. Method 44 7.2.2. Results 44 7.2.3. Analysis 45 7.3. Functionality Testing 46 7.3.1. Method 46 7.3.2. Results 46 7.3.3.Analysis 49
7.4. Time Efficiency Testing 50
7.4.1. Method 50
7.4.2. Results 50
7.4.3. Analysis 50
7.5. Discussion of the Results 51
7.6. Errors and Further Statistical Analysis 52
8. Limitations and Suggestions 55
9. Future Work 57
10. Conclusion 59
__________________________________________________________________________
L
IST
OF
F
IGURES
__________________________________________________________________________________ 2.1. Major bones, anatomical landmarks and joints of the lower limb.
2.2. Mechanical and anatomical axis of the lower limb. 2.3. Mechanical Axis of the Lower Limb on normal and deformed lower limbs.
2.4. Schematics of the results of opening wedge and closing wedge osteotomy. 2.5. Schematics of osteotomy planning and result using the ACA-CORA concept. 2.6. Schematics of an example osteotomy surgery using the Ilizarov circular fixator.
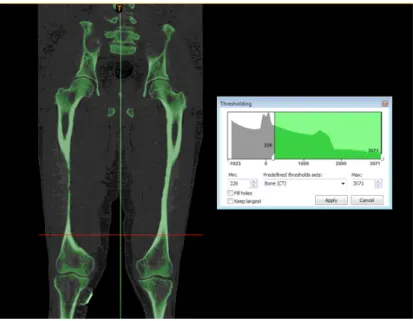
5.1. Threshold segmentation result on Patient 1 using the dedicated tool and “Bone (CT)” setting in Mimics.
5.2. Completed segmentation of Patient 1 and resulting 3D models in Mimics. 5.3. The mesh over the Femur head before (Above) and after (Below) remeshing. 5.4. Patella model before (Left) and after (Right) reorientation.
5.5. Example of bone (here, the left Femur) separation into the proximal (in red) and the distal (in blue) sections.
6.1. Further angles for alignment assessment defined by D. Paley. 6.2. Landmarks on the proximal end of the Femur.
6.3. Landmarks on the distal end of the Femur. 6.4. Landmarks on the shaft of the Femur. 6.5. Landmarks on the proximal end of the Tibia. 6.6. Landmarks on the distal end of the Tibia. 6.7. Landmarks on the shaft of the Tibia.
6.8. User interface displayed to the user (Left) and an example of the selectable options for a bone section (Right).
6.9. Method selection displayed to the user (Left) and an example of a user’s Femur Head selection (in red) (Right).
6.10. Example of a user’s Femur Neck selection (in red).
6.11. Example of user’s selections (in red) for the Right Tibia Distal, in a Torsion CT (Left) and a normal CT (Right).
6.12. Example of a user’s Intercondylar Notch selection (in red) on the Right Femur Distal. 6.13. Example of a user’s Medial Side selection (in red) on the Right Tibia Proximal. 6.14. Example of a user’s Outer Points selection (in red) on the Right Tibia Distal. 6.15. Example of a user’s MPTBA selection (in red) on the Right Tibia Proximal. 6.16. Auxiliary buttons available on the User Interface.
6.17. Example of a 3D model after finding every landmark.
7.1. Points on the Tibia plateau obtained from best fit circles to the condyles.
7.2. Attempt to use the best fit circle methodology to find the landmarks on the Tibia plateau.
4 4 5 7 7 8 16 16 17 18 19 22 24 25 26 27 28 29 32 33 34 34 35 35 36 36 37 37 51 52
__________________________________________________________________________
L
IST
OF
T
ABLES
__________________________________________________________________________________ 5.1. Comparison of the generated model’s volume. 5.2. Comparison of the generated model’s element number after remeshing. 6.1. Necessary angles and measures and respective normal values 7.1. Intraobserver results of the automatic 3D calculation for the left leg of Patient 1. 7.2. Intraobserver results of the automatic 3D calculation for the right leg of Patient 1. 7.3. Interobserver results of the automatic 3D calculation for the left leg of Patient 1. 7.4. Interobserver results of the automatic 3D calculation for the right leg of Patient 1. 7.5. Interobserver results of the manual 3D calculation for the left leg of Patient 1. 7.6. Comparison of the interobserver results and the expected values for the left leg of Patient 1. 7.7. Interobserver results of the manual 3D calculation for the right leg of Patient 1. 7.8. Comparison of the interobserver results and the expected values for the right leg of Patient 1. 7.9. Comparison of the times for the interobserver manual and automatic results of Patient 1.
20 20 23 39 40 42 43 44 45 46 47 48
__________________________________________________________________________
L
IST
OF
A
BBREVIATIONS
__________________________________________________________________________________ CAPS LMU MAD CORA ACA 3D CT MRI 2D BPR FTA HKA TTA M.A.D. LPTA mLDFA MPTA MPFA CCDComputer Aided Plastic Surgery Ludwig-Maximillian University Mechanical Axis Deviation Center of Rotation of Angulation Angulation Correction Axis Three-Dimensional
Computed Tomography Magnetic Resonance Imaging Two-Dimensional
Biplanar Radiography Femur Torsion Angle Hip-Knee-Ankle Angle Tibia Torsion Angle Mean Absolute Deviation Lateral Proximal Femoral Angle
(Mechanical) Lateral Distal Femoral Angle Medial Proximal Tibia Angle
Medial Proximal Femur Angle Centrum-Collum-Diaphysis Angle
__________________________________________________________________________
1. I
NTRODUCTION
__________________________________________________________________________________
The research group CAPS - Computer Aided Plastic Surgery - from the Klinikum Rechts der
Isar of the Technical University of Munich (TUM), and the 3D Chirurgie group from the Klinik für Allgemeine, Unfall- und Wiederherstellungschirurgie of the Ludwig-Maximillian University (LMU),
also located in Munich, plan to develop a novel method for the preoperative planning of deformity correction and knee surgery to be used in a real-life clinical context.
As a starting point, a project consisting of developing and validating a new software for assessing the lower limb alignment based on three-dimensional (3D) models of patients’ bones, was proposed and carried out during a 7-months internship. The stages, results and outcome analysis of this project/internship are presented in this thesis over the following chapters.
In Chapter 2, some background information is exposed in order to familiarize the reader with some concepts and also to introduce the need for the work developed. In Chapter 3, the state-of-the-art relevant to this work is explored. Chapter 4 then presents the motivation for this work and the specific objectives that were proposed. The next chapters address these objectives: Chapter 5 focuses on the generation of patient’s 3D models, Chapter 6 explores the design of the alignment assessment program and Chapter 7 focuses on testing the program. In Chapter 8, the limitations of the development process are discussed. Chapter 9 offers a perspective on possible future work. Finally, Chapter 10 serves as the conclusion of this work.
__________________________________________________________________________________
2. B
ACKGROUND
__________________________________________________________________________
This chapter aims to introduce basic concepts on lower limb deformities and respective corrective orthopedic surgery. A particular interest is put on the need for better, more precise, surgery planning techniques.
2.1. L
OWERL
IMBA
LIGNMENTThe lower limb, or lower extremity, of the human body can be defined in a more rigorous, human anatomical way, or in the general sense. While the first refers to the lower limb as extending from the knee to the ankle, the second way of defining it includes the entire lower extremity of the human body, which includes the foot, thigh (the portion between hip and knee) and even the hip. The common usage is followed.
The lower limbs are responsible for supporting the body and are essential for standing, walking and running, among other things. Therefore, the structure of the lower limb reflects its function in body support and movement, and changes to this structure have direct consequences on how primary functions are executed, ultimately damaging a person’s quality of life.[1]
One characteristic of the structure of the lower limb is its alignment, i.e. the relative positions of the bones and joints that it includes.
2.1.1. S
TRUCTUREOFTHEL
OWERL
IMBEach lower extremity has 30 bones. The major bones of the lower limb are the Femur, Tibia and Fibula.[1] These bones are the ones considered relevant for the rest of the work. The Patella, also a major bone, is the bone in front of the knee. They can be seen in Figure 2.1.
The Femur, the most proximal bone of the three, is the longest and strongest bone in the body, being easily identified for its prominent and round head, part of the hip joint, its well defined neck and its two condyles (rounded protuberances). Worth mentioning are also the two trochanters (also bony protuberances, but not rounded) on the upper extremity and the intercondylar fossa/notch of the Femur between the two condyles.[1]
The Tibia, the second largest bone in the body, connects the knee with the ankle bones and it can be characterized by its two slightly concave condyles on the proximal end and the intercondylar eminence, forming the tibial plateau, a critical weight-bearing area which articulates with the Femur; and by the medial malleolus, which is part of the ankle joint.[1]
Finally, the Fibula is the smallest and slenderest of the three bones, having a small upper extremity, placed toward the back of the head of the Tibia and below the knee joint, and a lower extremity, the lateral malleolus, which is also part of the ankle joint.[1]
Normally, the large joints of the lower limb are aligned on a straight line, which is the mechanical longitudinal axis of the leg (also identified as the Mikulicz line). This line stretches from the hip joint, through the knee joint and down to the center of the ankle, as can be seen in Figure 2.2. The distance between the mechanical axis of the lower limb and the center of the knee joint is called the Mechanical Axis Deviation (usually identified as MAD).[2]
Figure 2.2. Mechanical and anatomical axis of the lower limb (from [B]) Figure 2.1 Major bones, anatomical landmarks and joints of the lower limb (from [A]).
2.1.2. D
EFORMITIESSometimes, defects or deformities can be found on the lower limb and this can be due to many different causes. These defects are congenital (present at birth), causing alterations in the shape and appearance of the legs, and sometimes the deformities may occur at a later stage as a result of trauma.
The exact cause of the congenital deformities is not known. There are several factors such as genetic factors which influence the fetal growth in the womb and drugs that can cause congenital deformities. Also, a fetus’ position in the womb or vitamin/nutrition deficiencies in its development might also play a role in the formation of these deformities.[3]
The most common malformations, or malalignments, of the lower limb result from an axial deviation in the frontal plane: it is a case of genu varum (or Varus Deformity) if the mechanical axis is medial to the center of the knee joint, or of genu valgum (or Valgus Deformity) if the mechanical axis is lateral to the center of the knee joint.[2] These deformations can be observed in Figure 2.3.
Figure 2.3. Mechanical Axis of the Lower Limb on normal and deformed lower limbs (from [C]).
These deformities have an impact on a person’s quality-of-life, either by affecting the general aesthetic of the body or by affecting the mobility. They lead to unphysiological stresses on the affected joints and can thus cause pain and damage to the joint, so diseases such as arthrosis may arise as a consequence. In account of the possible consequences, it is normal that techniques have been developed in the surgical field that are capable of fixing these problems.
2.2. M
ALALIGNMENT/D
EFORMITYC
ORRECTIONThanks to the evolution of modern medicine, fixing the deformities in the lower limb is now a common practice in the orthopedics' surgical field. Some deformities are easier to fix than others, but
they all require a very specific and personalized surgery planning in order to perform the needed corrections successfully and with as high a precision as possible.
2.2.1. D
EFORMITYA
NALYSIS/A
LIGNMENTA
SSESSMENTO
VERVIEWBefore any corrective surgery and its respective planning, the deformity needs to be properly analyzed, i.e. the alignment of the lower limb needs to be assessed.
Varus and Valgus deformities can occur both on the Femur and Tibia, which lead to a MAD outside its normal range. To determine whether MAD results from a femoral or tibial deformity, the mechanical joint orientation angles of both Femur and Tibia are measured and compared with the normal acceptable range (85º–90º). Obtained values outside of this normal range indicate the source of MAD to be femoral, tibial, or both. Performing this comparison is what is called doing a malalignment test.[4]
These deformities also affect the normal value of the femorotibial angle, and measurements can also be performed to access its value and compare it to the normal acceptable range.
The intersection point of the proximal and distal anatomical axes lines of a deformed bone is the Center Of Rotation of Angulation (usually identified as CORA). Since a change in the axes and joint angles is possible in all three planes, extremely complex dislocations can be found with simultaneous deviation of several parameters, making the identification of the CORA harder.[4]
Once the source of the deformity is identified as being femoral, tibial or both (by using the MAD or the femorotibial angle), the CORA can be found on the corresponding bone (or considering both bones, if that is the case).
Finding other angle values, e.g. in the sagittal or axial plane, that are out of normal range will also have an impact on what corrections need to be planned.
Currently, the alignment assessment is carried out manually in the two-dimensional space, normally using whole-leg X-ray images of the anatomical frontal plane. Deviations in the sagittal plane can be determined with lateral X-ray images and in the transversal plane via the evaluation of axial computed tomographic images.
2.2.2. S
URGERYANDP
LANNINGO
VERVIEWOsteotomy literally means “cutting of a bone” and it refers to any surgical operation in which a bone is cut to allow for modifications. In the present context, it is the surgery that allows the realignment of the lower limb, performed on the Femur or the Tibia. As a result of this surgery, the course of the axes and thus also the stress profile in the joints can be shifted to physiological values.
There are two basic types of osteotomy for angular deformity correction: angulation-only osteotomies, which can be opening wedge or closing wedge types, as can be seen on Figure 2.4.; and angulation with translation osteotomies, which can be straight cut or circular cut (dome). Having an osteotomy with translation means that, besides having its angle corrected, the bone is also moved (translated) in order for the deformity to be properly corrected.[4]
Figure 2.4. Schematics of the results of opening wedge and closing wedge osteotomy (from [D]).
The Angulation Correction Axis, known as ACA, is the axis line around which the correction is to be performed. Ideally, the ACA passes trough the CORA, resulting in what is called the ACA-CORA point, and performing the osteotomy cut trough this point results in a surgery with no undesired secondary deformities.[4] This concept can be seen on Figure 2.5.
Figure 2.5. Schematics of osteotomy planning and result using the ACA-CORA concept (from [E]).
With the knowledge of the needed deformity correction and the optimal cutting point, the surgery can be performed. In a simple way, the common practice is to use the Ilizarov circular fixator to fixate the bone to be corrected, as in the example on Figure 2.6, then cut the bone as close to the ACA-CORA point as possible and then use the fixator to set the bone to the proper alignment.
Figure 2.6. Schematics of an example osteotomy surgery using the Ilizarov circular fixator (from [F]).
In case of an external fixation osteotomy, like the one in the given example, performing the corrective osteotomy close to the ACA-CORA point is (mostly) possible and fairly easy, but in the case of a internal fixation osteotomy, there are several limitations due to the specific implant.
During the 20th century, these surgeries were performed using the “eyeball” technique, with no previous planning and a lot of improvisation from the surgeon who would just operate based on what he saw and previous experiences, which, in the 21st century, is no longer acceptable. Many innovative osteotomy techniques have been proposed over the years, with subjectively acceptable results, but objectively inaccurate, with secondary deformities resulting from primary correction. Although these secondary deformities are asymptomatic initially, they lead to degenerative changes and disability over time.[4]
Concepts like CORA are recent and allow for a better surgery planning. Nevertheless, there still is a lot of work that can be done and the planning of these types of surgery can still be improved. The further development of imaging techniques and the possibility of intraoperative navigation techniques can allow for better planning, visualization, and facilitation of the surgery.
__________________________________________________________________________
3. S
TATE
-
OF
-
THE
-
ART
__________________________________________________________________________
This chapter aims at exploring relevant literature concerning this dissertation’s work.
3.1. C
LINICALLYU
SEDO
STEOTOMYP
LANNINGM
ETHODSPreoperative planning of osteotomy (and other deformity correction and knee surgeries) has always been necessary. When the surgery first started to be performed, this planning used to be done in a fully manual way by the surgeons, requiring the use of a ruler, scissor, goniometer and the radiograph[5]. Then, the planning evolved as templates started to be used. The surgeon would have a set of conventional templates and impose them on radiographs on the basis of best fit.
This type of planning has become less and less common as digital formats for imaging have become the standard[5] and as researchers have shown the advantages of a computer-based preoperative planning over the traditional template planning, especially when deformed anatomies are involved[6]. The accuracy and the repeatability that can be attained using this planning software is described as being the same (or better) as when planning the operation with the conventional templates.
Several software programs have been developed over the years as an alternative to the template planning, but there is little consensus on the ideal medical imaging technology that should be used[7], with CT (Computed Tomography) images being mainly used in these programs[8]. MRI (Magnetic Resonance Imaging) is not a standard in preoperative procedure, even when it has been proven that MRI scans provide the same results as CT scans for the assessment of the lower alignment[7], the first step in the preoperative planning.
A 2015 study[5] has compared 5 different well-established commercial software programs that are widely used to perform preoperative planning High Tibial Osteotomy (HTO): TraumaCad, MediCAD, Sectra, Medweb and Photoshop. Several aspects of each program were compared: the image type that can be used, the capability (or need) to use templates, the control and features offered to the user (such as automatic axis, presentation of the CORA or angle automatic calculations) and the possibility of visualizing the correction, among other things.
The study does not come to a conclusion on which software is the best, only pointing out what can be considered the strengths and weaknesses of each program. Nevertheless, one can notice that, for now, none of these popular software programs uses 3D models for the assessment of the alignment or to plan and pre-visualize results of the osteotomy.
MediCAD Knee 3D is a software developed my MediCAD that uses 3D models from patients with the purpose of supporting doctors in better planning of knee endoprosthesis. It is equipped with a measuring tool that is capable of performing what is called “traditional mesures” on the lower limb and also some other measurements that can only be performed in 3D, such as the tibial torsion and the femur torsion values, making this a clear advantage of using 3D planning software, as this type of information can not be extracted from 2D planning methods. It then allows the user to assemble the individual implant components using the implant configurator and place them into the 3D model (the patient's CT images). The implants can be adjusted, rotated, moved or changed to another implant type, in a fully interactive way, all in a 3D environment. Nonetheless, this software, as said, is only applied to the planning of knee endoprosthesis and not osteotomy, and there is no information regarding plans to adapt this software to this end.
PeekMed is a commercially available 2D/3D hybrid software system that helps orthopedic surgeons to plan their surgeries, including High Tibial Osteotomy. It is capable of automatically calculating the angle needed for the correction, while it also allows the simulation of fixation hardware implantation and the actual osteotomy. However, while the simulation can be performed using the 3D environment, no clear information can retrieved about the ability of the software to use the same 3D environment for the alignment assessment.
The fact that PeekMed was developed by a small startup company might also explain why this software is not widely known and used, and also why is also hard to find information about it. Only in August 2017 the software achieved the ISO 13485 certification, which represents the requirements for a comprehensive quality management system for the design and manufacture of medical devices, often seen as the first step in achieving compliance with European regulatory requirements, and also the CE mark, which allows PeekMed to be sold for clinical use in the European Economic Area (EEA) and Switzerland. The company is yet working on getting FDA approval in order to sell in the US market.
The fact that these more advanced softwares are still not being used to their full potential or that they are still relatively unknown in a global scale is still motivating a lot of research on novel methods worldwide.
3.2. R
ESEARCHONN
OVELM
ETHODS3.2.1. 2D
VS. 3D M
ETHODSAccording to [9], measuring the lower limb alignment using two-dimensional (2D) methods can cause several issues. An improper positioning and orientation of the lower extremity while obtaining the scans often lead to ambiguous and inaccurate images, and this can’t be overcome on a two-dimensional (2D) setting. Also, deciding the best slice from hundreds of slices for marking reference axes is a hard task.
3D is specially useful to evaluate the extent of variation of lower limb alignment due to limb rotation and inclination, since these 2 factors can change the anatomic angles of the proximal Tibia in 2D imaging studies. 3D allows the rotation and inclination to be accounted for[10][11].
Researchers[12] have then concluded that 3D tools make for a better planning in comparison to
2D tools, but that the interaction with these 3D tools require some additional practice, which can be a disadvantage. The 2D tools do allow for a faster and more correct evaluation of the patient’s situation than current 3D tools, but this does not erase the pointed disadvantages.
Some papers about using 3D models for osteotomy planning may be found[9][10][12][13], but, apart from the stating that they were based on CT scans, they lack an exact description of how these models were generated. One study[11] does describe importing the DICOM data from CT scans into
Mimics (Materialise, Leuven, Belgium) to create a 3D model of the proximal Tibia, and then,
exporting it to Geomagic (Geomagic, Research Triangle Park, North Carolina) to get the measurements.
However, CT scanning exposes patients to a greater amount of radiation (when compared with a standard X-ray for 2D planning), and if you weigh this “cost” against the “benefits”, it might not be worth it to expose the patient to this radiation in order to get a 3D model.
In that sense, a 2012 study[8] was conducted to see if measurements obtained with 3D models based on low-dose biplanar radiographs (BPR) were similar to those obtained by CT. The study found the measurements to be interchangeable, meaning that the 3D models could be obtained from a lower dose imaging system.
More recently, in 2016, researchers[14] created bone 3D models using a new acquisition protocol for BPR, the BMicroDose, that represents a combination of protocol optimization and dedicated new image processing, resulting in a much lower radiation exposure for the patient. They concluded that the osteotomy required lower limb measurements made on 3D models based on micro-dose BPR are as reliable as measurements based on low-micro-dose BPR images, with the advantage of exposing the patients to 10-times less radiation. This study made use of the EOS X-ray machine and of the SterEOS software by EOS to reconstruct the 3D models of the lower limb.
The EOS X-ray machine is capable of performing a simultaneous capture of biplanar X-ray images by slot scanning of the whole body in an upright, physiological load-bearing position, using really low radiation doses. The images are captured in a spatially calibrated manner and allow for a precise 3D surface reconstruction of vertebrae, pelvis and other parts of the skeletal system using SterEOS.[15]
The reconstruction procedure is based on the virtual automatic manipulation of a normal human skeleton that is virtually deformed to fit the new images. The bones in the virtual 3D skeleton are shaped/deformed according to 3D coordinates of specific points on the bone surface. This procedure has been validated for various bones (vertebrae, Femur, Tibia) first using dried anatomical preparations in vitro, and then in vivo.[15]
Another study[16] has demonstrated that the alignment measurements on 3D modeling produced by the EOS system allows for a more accurate evaluation than the 2D measurements that are routinely used in clinical practice, again because the errors due to wrong limb positioning are eliminated. Once again, it is pointed out that one of the major advantages of EOS technique is that it avoids a CT scan acquisition. The main issue with SterEOS is that it is only available to owners of the EOS System, which limits its use by doctors and technicians worldwide.
There are some other commercially available 3D tools that can be used during surgery: VectorVision is an intraoperative planning and navigation system for high tibial osteotomy capable of the 3D simulation of the expected osteotomy result[12]; navigation systems provided by TraumaCad and MediCad can provide real-time information, which is revolutionary for orthopedic surgeons who
correct alignment during surgery[11]. These systems are an example of the trust on software that uses 3D simulation.
But with the high cost compared to the number of patients per year, most hospitals in development countries cannot afford to buy these highly advanced software programs[5], which can be considered not necessary as of now on a software for osteotomy.
One can then come to the conclusion that using 3D models for the assessment of the lower limb alignment and for osteotomy planning is an advantage, and, as stated before, there have been some software programs developed. The main problem with these is that they are still too expensive and maybe difficult to use, so development of cheaper easy-to-use new software has a lot of potential.
3.2.2. E
XPERIMENTAL3D S
OFTWAREFORA
LIGNMENTA
SSESSMENTThe 3D method described on [10] can be used for the assessment of lower limb alignment. It uses thin-slice CT images to recreate a 3D model and relies on geometrical manipulation of the model to find a limited number of angles and axis. It was developed to study the effect of rotation on the assessment of the lower limb alignment and actual clinical usage for the assessment is not discussed.
This method uses models of the Femur, Tibia, and patella, created using Analyze PC 3.0, a surface rendering software. The program requires four landmark points to be plotted on the 3D surface models: the first point is the center of the femoral head, obtained by finding the center of the best-fit sphere; the second and third points are the top of the medial and lateral femoral epicondyles; and the fourth point is the centroid of a series of points on the distal tibial joint surface that were surrounded by a manually drawn circle. They are used for anatomic reference and also to access orientation.
The software then projects the 3D model on the 2D XZ-plane and calculates the Femur Torsion Angle (FTA) and the Hip-Knee-Ankle angle (HKA) as indices of lower limb alignment, where FTA is the lateral angle at the intersection between the femoral shaft axis and the tibial shaft axis, and HKA is the medial angle deviation from 180º at the intersection between the mechanical axes of the Femur and Tibia. Additional points need to be found in order to access all the axes. They are manually identified by creating cross-sections on the bones and finding the centroids of these sections.
The software described on [9] was developed using the C++ language and it uses 3D bone models reconstructed from CT scan images to fully automatically extract six specific anatomical landmarks on the lower limb. The program integrates volumetric data and triangular meshes of bone models together to recognize the anatomical landmarks. While the triangulated surface model data is necessary for geometric landmark localization and rapid rendering, the volumetric data is important for axis computation.
The first landmark is the center of the Femur head and it is found by automatic recognition of Femur head mesh by a volume-based shape function and then, using four points on its surface, a sphere is created and the point corresponds to its center. The femoral anatomical axis, the Femur neck axis and the Tibia anatomical axis, are three landmarks found by an algorithm that generates the mid-diaphyseal (medial) curve of the bones and then finds points on this curve that allow for the generation of the landmarks. The Femur condyle axis is found by automatically finding the medial and lateral most distal points of the Femur and connecting these to the femoral condyle center (which is obtained by the intersection of the femoral anatomical axis with the model surface), resulting in a single point.
The last landmark, the Tibia plateau axis, is found my calculating the lowest points on the two concave of the Tibia pleateu and connecting them.
With the landmarks found, the software then calculates the FTA and the Tibia Torsion Angle (TTA), that are then used for the assessment of the alignment.
Another group of researchers[13] developed computer-aided methods for automatically measuring anatomical deformities on the lower limb using 3D bone models reconstructed from CT scan data.
The overall procedure of this method goes as follows: first, the 3D models of the lower limb are reconstructed from CT scan images; then, the required anatomical landmarks are identified; the third step is to compute the medial axis of long bones; this then allows for the reference axes to be computed from anatomical landmarks and medial axes; after this, the reference centres from anatomical landmarks are identified; the sixth step is to measure the torsional deformation using the reference axes; then, the angular deformation angles can be measured using the anatomical and mechanical axes; and finally, the long bone curvature deformation can be calculated in the medial axis. The landmarks on the Femur and Tibia bone models are said to be automatically identified based on their intrinsic geometric characteristics, using geometric algorithms, specifically curvature derivatives, one for each landmark. The landmarks are then identified and labelled based on their unique spatial-adjacency configuration with other landmarks. These methods were developed using C# language .
None of the above described software programs is known to have become commercially available.
The advantage of a fully automatic approach is the elimination of the variability and human induced errors in measurements in manual methods. But such approach might increase the time needed for the evaluation of a patient to a point it could surpass the time needed for an experienced surgeon to do a manual “standard” evaluation.
__________________________________________________________________________
4. P
ROJECT
O
VERVIEW
__________________________________________________________________________
After an introduction to the topic of lower limb deformities and osteotomy planning, and the state-of-the-art on methods for such planning, the dissertation’s motives and goals are defined in this chapter.
4.1. M
OTIVATIONThis project results from a cooperation between the research group CAPS - Computer Aided Plastic Surgery - from the Klinikum Rechts der Isar of the Technical University of Munich (TUM), and the 3D Chirurgie group from the Klinik für Allgemeine, Unfall- und Wiederherstellungschirurgie of the Ludwig-Maximillian University (LMU), also located in Munich.
The two groups plan to develop a method for the preoperative planning of deformity correction and knee surgery to be used in clinical context by the 3D Chirurgie group, which is responsible for the planning of osteotomies on a regular basis, but still uses a manual method for the alignment assessment. The LMU group wishes to make use of new available technology and modernize its planning methods. For this, 3D models of patients’ bones using CT/MRI data should be generated and, ultimately, a semi-automated workflow for planning the needed osteotomy surgery should be developed and validated.
Following these plans, a project consisting of developing a new software for assessing the lower limb alignment based on 3D models was proposed and carried out during a 7-months internship, resulting in the work on which this dissertation is ultimately based on.
4.2. O
BJECTIVESFor the completion of this project, a number of objectives was set in order to allow for a more logical and sequential workflow and also to ensure the best outcome possible. Each objective can be considered as a stage of the project. The objectives, in the order they were to be achieved, were the following:
• To generate best possible quality 3D models of different patient’s lower limbs, using both segmentation and 3D rendering software. Also, to ensure that these models can be generated by any user and that this will not cause a source of massive variability/error in the final outcome;
• To understand the exact angles and measures desired by the 3D Chirurgie group and the therefore needed anatomic landmarks for the alignment assessment;
• To design a program that uses the generated 3D models and, in the most automatic way possible and with an easy-to-use interface, returns all the needed angles and measures. • To ensure that the program is reliable and consistent in its results in both intraobserver
and interobserver domain and that it can replicate the manual assessment by comparing the results obtained by using the program with manual assessment results.
__________________________________________________________________________
5. 3D M
ODELING
OF
THE
L
OWER
L
IMB
__________________________________________________________________________
The first step for the 3D alignment assessment is to create the 3D anatomical model of the patient. Several models were reconstructed from anonymized 2D CT scans provided by the 3D
Chirurgie group using the Mimics 14.0 software. This software was used due to its availability, to the
fact that it had been used before by other members of the research group, and also because previous research[11] had also used it.
For the development of the alignment assessment software, the goal was to have models that were relatively different from each other regarding their quality (models based on different quality CTs) and their anatomical contents (models made from female and male patients, with different types of deformities). Having different models to use to develop the software would guarantee that it could be used on different scenarios.
The following sections of this chapter explore how the 3D models were obtained and prepared to be used by the developed software. A specific example from a patient, from now on Patient 1, is followed throughout the chapter. Patient 1 is deceased, so it was possible to obtain a very high resolution CT (1691 slices with a layer thickness of 0.62 mm), since radiation exposure didn’t need to be considered. Due to the expected high accuracy of the resulting 3D model, this case was to be used for the development of the software after successful segmentation.
5.1. S
EGMENTATIONAs previously stated, the Mimics 14.0 software was used to create the models, more specifically, to segment the CT images and then calculate the 3D models. The software displays the data in all three anatomical views (transverse, sagittal and coronal) simultaneously and, by moving the mouse wheel with the cursor over one of the views, the user can scroll through all the different slices. It also allows the user to work on a specific view on full screen mode, which eases certain tasks.
After the previously anonymized CT images were imported into Mimics, a threshold segmentation was performed using the dedicated tool. The “Bone (CT)” presetting, which limits the HU values to the interval 226 - 3071, was used. This allowed to automatically separate all bony structures, as can be seen in Figure 5.1.
It was decided that creating a separate mask for each section/bone (i.e., the Femur, the patella, and the Tibia and fibula together) would be useful further on. For this, the “Region Growing” function was used to select contiguous sections on different slices and create one unique separate section. However, all other connections that should not be part of the model but were created by using this tool,
had to be removed manually. To this end, the “Edit Mask” function was used, by which the user can delete incorrectly marked areas or select/mark desired areas, adding to the mask.
Since only the surface of the bone is relevant to the alignment assessment, structures like the hole inside the Femur shaft don't need to be considered, and therefore were ignored to simplify the model generation.
After the segmentation was complete, various default settings for the “3D Calculation” tool were available - Low, Medium, High and Optimal - which differ in the fineness of the resulting model. The “Optimal” setting is the one recommended by the program, so it was used.
In Figure 5.2, three fully segmented CT slices can be seen, one per anatomical view. The different masks created are represented in different colors. On the lower right square, the calculated 3D models can be seen. These models were then exported under the STL format.
5.2. O
PTIMIZATIONANDP
REPARATIONAfter the segmentation step, 3D models are obtained, but they are still not ready to be used: their quality needs to be confirmed and optimized if needed, and they need to be set up in a certain way in order to be efficiently used by the software, so that computation time is minimized and so that the accuracy is the best possible. For this end, the Geomagic Studio 14 software was used, again due to the program availability, to the fact that it had been used before by other members of the research group, and also because previous research[11] had also used it.
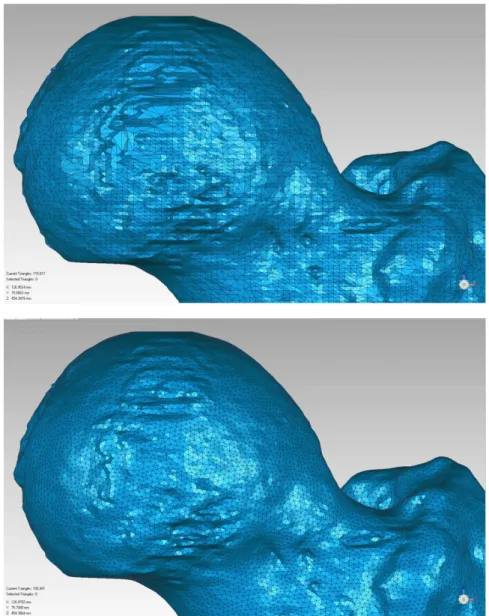
After loading the generated models into Geomagic, the first step on this optimization and preparation process was to check the mesh quality and remesh the model if needed. The finer the mesh, i.e., the smaller the triangles that constitute the model are, the better quality it has. In this sense, it was decided that the maximum edge length accepted would be 1 mm. As a consequence, any model that presented an edge length larger than this value was remeshed using the dedicated tool, preserving all edges and boundaries. An example of remeshing can be seen in Figure 5.3.
Figure 5.3. The mesh over the Femur head before (Above) and after (Below) remeshing. The number of elements was raised from 115 817 to 199 461, with the triangle edge length changing from 1.256 mm to 0.905 mm on the Femur model. The mesh
In present-day clinical context, the alignment assessment is based on conventional long standing leg X-ray acquisitions, in which the patella is aligned in a way so that it lies centrally between the femoral epicondyles, with its anterior face facing forwards. For this reason, it was decided that the alignment of the models within the coordinate system has to correspond to the alignment of the leg in this acquisition method.
Furthermore, since the assessment process is based on anatomical landmarks that can be/are found trough methods that are geometry-dependent, a proper orientation of the models is crucial. For example, if one wants to find the most anterior point on a model, which would correspond to the maximal/minimal value on a certain world-axis, having the anterior surface of the bone correctly positioned in relation to this axis is needed (in this case, the most perpendicular possible), or the wrong point would be found.
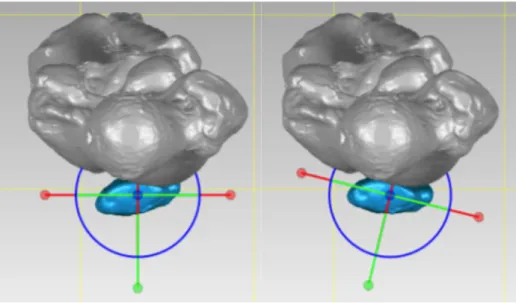
Thus, the patella model was rotated using the “Object Mover” tool so that its anterior face would be correctly positioned, as can be seen in Figure 5.4 and a rotation matrix was automatically created by Geomagic. This matrix was then used to rotate the other bones/models using the “Transform” tool.
Figure 5.4. Patella model before (Left) and after (Right) reorientation.
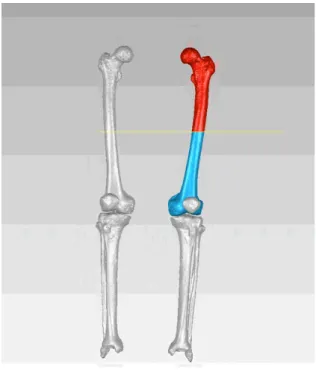
With the models properly aligned, the final step of the preparation step could take place. In order to standardize the process, the bones must be named in a certain specific way. Also, it was decided that it is best to separate the proximal and distal portions of the bones, creating two separate models, so that the program has less triangles to go trough to find each point. An example of this separation procedure using the “Trim” tool can be seen in Figure 5.5.
It was decided that the following naming order would be used: firstly, the leg side must be identified, i.e., “Left” or “Right”; secondly, the specific bone is identified, the options being “Femur” and “Tibia”; and finally, the portion of the bone is identified, which can be “Proximal” or “Distal”. It is not important to properly name the patella as it will not be used by the program and it’s also not relevant to separate the Tibia from the fibula, so the name of the first is used to describe the two. In this way, the proximal part of the left Femur bone must be named “Left Femur Proximal”.
Figure 5.5. Example of bone (here, the left Femur) separation into the proximal (in red) and the distal (in blue) sections.
5.3. U
SERI
NFLUENCEONM
ODELG
ENERATIONThe program is being/was developed to be used in a real-life context. This means that, unless someone is made responsible to create every single 3D model, which is unlikely, different users will have to create different models. Therefore, testing the influence of different users on the model generation is necessary.
Three different users created their version of a 3D model of Patient 1 following the steps previously described. All users had previously worked with Mimics, but User 1 has virtually no experience segmenting medical images, User 2 has some experience, and User 3 is very used to segment this type of images, particularly with the used software.
For comparison, it is best to evaluate the models of the individual bones and not the whole model of the lower limb. Consequently, in Table 5.1 the volume of the different models generated by the three different users can be analyzed. The average volume was calculated from the three users and the percentual individual difference from each user to this average was calculated.
One can observe that every model has a difference of less than 1% from the average value, which means they are very similar. The same conclusion can be drawn from the more usual statistical concepts calculated: the standard deviation and the mean absolute deviation (M.A.D.), which gives the average distance between each data point and the mean. Both of them take very small values for every model, indicating that they are indeed very similar to each other.
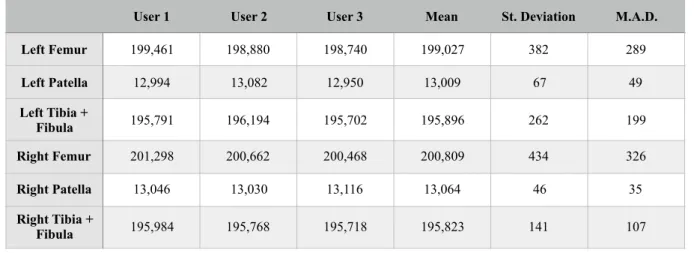
In Table 5.2 the number of elements on each model can also be compared. From the values of the standard deviation and specially the M.A.D., once again, one can come to the conclusion that the models are very similar.
This means that different users, even with different backgrounds of expertise, will create very similar models to be further used for the alignment assessment. It can not be said that the user influence is non existent, but the models generated were similar to the point the results won’t probably be very affected by these small differences.
Table 5.1. Comparison of the generated model’s volume.
Table 5.2. Comparison of the generated model’s element number after remeshing. Mean (cm3) User 1 (cm3) % Diff. from Mean - User 1 User 2 (cm3) % Diff. from Mean - User 2 User 3 (cm3) % Diff. from Mean - User 3 St. Deviation M.A.D. Left Femur 4,371.898 4,364.697 0.165 4,371.434 0.011 4,379.563 0.175 7.444 5.110 Left Patella 54.255 54.253 0.004 54.257 0.003 54.256 0.001 0.002 0.002 Left Tibia + Fibula 3,472.971 3,444.943 0.807 3,485.264 0.354 3,488.706 0.453 24.334 18.685 Right Femur 3,609.250 3,605.911 0.093 3,605.704 0.098 3,616.135 0.191 5.963 4.590 Right Patella 53.320 53.282 0.071 53.212 0.203 53.466 0.274 0.131 0.097 Right Tibia + Fibula 3,395.724 3,391.993 0.110 3,394.448 0.038 3,400.732 0.147 4.507 3.338
User 1 User 2 User 3 Mean St. Deviation M.A.D. Left Femur 199,461 198,880 198,740 199,027 382 289 Left Patella 12,994 13,082 12,950 13,009 67 49 Left Tibia + Fibula 195,791 196,194 195,702 195,896 262 199 Right Femur 201,298 200,662 200,468 200,809 434 326 Right Patella 13,046 13,030 13,116 13,064 46 35 Right Tibia + Fibula 195,984 195,768 195,718 195,823 141 107
__________________________________________________________________________
6. P
ROGRAM
C
ONCEPTION
& D
ESIGN
__________________________________________________________________________
The core of the project was the design of a computer program/software that could do the alignment assessment of the lower limb in the most automatic way possible. In the next chapters, the conception and development of this software is described.
The specific landmarks and the angles that the program should/must find are firstly identified and then the process by which they are properly found and/or calculated is described. Lastly, the finished program, with its user interface, is presented.
6.1. D
EFINITIONOFD
ESIREDA
NGLES ANDM
EASURESFor a proper alignment assessment, specific angles must be found. Some of these angles are standard in the assessment procedure, but some angles which provide some additional information may or may not be deemed necessary by some specialists. The angles and measures that should be found by the developed program were decided by specialists of the 3D Chirurgie group, based on their clinical knowledge and sense of need for a better planning. Successfully finding these angles is to be the primary function of the program.
As previously stated, there are two axis that are very important in the alignment assessment: the mechanical axis and the anatomical axis of the leg.
The leg mechanical axis goes from the hip joint (or the center of the Femur head), through the knee joint and down to the center of the ankle. One can also evaluate the two bones involved in this axis separately, resulting in a femoral mechanical axis and a tibial mechanical axis. The angle between these two axes is called the Hip-Knee-Ankle angle, usually identified as HKA, and it should have a value close to 180º, both in a frontal or sagittal anatomical plane view.[17]
Also, as previously seen, the distance measured between the mechanical axis of the lower limb and the center of the knee joint is known as the Mechanical Axis Deviation, or MAD. This deviation can be observed in both horizontal and vertical axes (or X and Y axes) from a transversal anatomical plane perspective.[2]
A bone torsion angle is the angle between an axis that crosses one end of a bone and an axis that crosses the other end, caused by a twist about its longitudinal axis. It can be measured in both Femur and Tibia.
For the femoral torsion angle, two lines are needed: the Femur neck axis, that goes trough the center of the Femur head and the center of the Femur neck, and the most distal transcondylar line, i.e. a line tangent to the posterior points of the femoral condyles.[18] According to [19], the expected
normal value of this angle is 24.1 ± 17.4°. The angle formed between the line tangent to the posterior points of the femoral condyles and the world’s x-axis was considered of interest to the assessment and for that reason it was also evaluated under then name of “Position of the Condyles”.
The Tibia torsion angle, which has an expected normal value of 34.9 ± 15.9°[19], corresponds to the angle formed by the line tangent to the tibial condyles and the distal reference line, which is formed by intersecting the centers of the medial and the lateral malleoli[20]. The angle formed between this distal reference line and the world’s x-axis was deemed relevant to the assessment and, therefore, it was also recorded under the name of “Position of the Malleoli”.
Besides these more generic and more easily determined angles and measures, there is further anatomical and mechanical information specified in [4] that can be extracted from the lower limb, as can be seen in Figure 6.1.
Figure 6.1. Further angles for alignment assessment defined by D. Paley (from [E]).
Starting with the mechanical angles, the Lateral Proximal Femoral Angle, usually identified as mLPFA, or simply LPFA, is formed by the line that goes from the center of the femoral head to the top of the greater trochanter, and the leg mechanical axis, which results in an angle of about about 90.0 ± 5.0° at normal anatomical axis ratios.
The mechanical Lateral Distal Femoral Angle, known as mLDFA, indicates the position of the femoral knee joint surface with respect to the femoral mechanical axis in the frontal plane. For the determination of this angle, a tangent to the most distal points of the Femur condyles is defined and then the angle to the mechanical femoral axis is determined, which should be approximately 87.5 ± 2.5°.
Another mechanical angle, the Medial Proximal Tibia Angle, or the MPTA, as it is known, is formed by the line of the proximal tibial surface is defined by the two outermost points (medial and
![Figure 2.3. Mechanical Axis of the Lower Limb on normal and deformed lower limbs (from [C])](https://thumb-eu.123doks.com/thumbv2/123dok_br/18535067.904883/23.892.325.567.485.846/figure-mechanical-axis-lower-limb-normal-deformed-lower.webp)
![Figure 2.4. Schematics of the results of opening wedge and closing wedge osteotomy (from [D])](https://thumb-eu.123doks.com/thumbv2/123dok_br/18535067.904883/25.892.295.608.132.352/figure-schematics-results-opening-wedge-closing-wedge-osteotomy.webp)
![Figure 2.6. Schematics of an example osteotomy surgery using the Ilizarov circular fixator (from [F])](https://thumb-eu.123doks.com/thumbv2/123dok_br/18535067.904883/26.892.317.584.122.509/figure-schematics-example-osteotomy-surgery-ilizarov-circular-fixator.webp)
![Figure 6.1. Further angles for alignment assessment defined by D. Paley (from [E]).](https://thumb-eu.123doks.com/thumbv2/123dok_br/18535067.904883/42.892.174.716.436.805/figure-angles-alignment-assessment-defined-d-paley-e.webp)