QUANTIFICATION OF THE SOIL PHYSICAL QUALITY OF
A TROPICAL OXISOL USING THE S INDEX
Cássio Antonio Tormena1*; Álvaro Pires da Silva2; Silvia Del Carmen Imhoff3; Anthony Roger Dexter4
1
UEM - Depto. de Agronomia, Av. Colombo, 5790 - 87020-900 - Maringá, PR - Brasil. 2
USP/ESALQ - Depto. de Ciência do Solo, C.P. 09 - 13418-900 - Piracicaba, SP - Brasil. 3
UNL - Cát. Diagnóstico y Tecnologia de Tierras, C.P. 3080 - Esperanza, SF - Argentina. 4
IUNG/PIB - ul. Czartoryskich 8, 24-100 - Pulawy, Poland. *Corresponding author <[email protected]>
ABSTRACT: Soil physical quality is fundamental for the sustainability of agro ecosystems. Soil physical quality assessment must be developed using parameters that describe physical behavior. S, a new soil physical parameter has recently been introduced for assessing the soil physical quality. A good soil physical quality has been associated with values of S > 0.035 in soils from temperate climates. However, S has not been evaluated in tropical soils yet. Therefore we tested the hypothesis that S is a reliable soil physical quality indicator of a Typic Hapludox cropped with maize under no-tillage (NT) and conventional no-tillage (CT). Undisturbed samples were collected from each no-tillage system in the row and interrow positions. Soil bulk density was determined in the samples and the S parameter was calculated using a pedotransfer function from the same samples. The parameter S was able to differentiate tillage and position with SNT < SCT independent of the row and interrow sampling positions. Higher S values were verified in row position than in the interrow in both tillage systems. With the use of a pedotransfer function it was also possible to establish a negative relationship between S and soil compaction. The results confirmed our hypothesis and suggest that further studies should be carried out to evaluate S in other tropical soils and management systems.
Key words: bulk density, tropical soils, no-tillage, soil water retention, soil structure
QUANTIFICAÇÃO DA QUALIDADE FÍSICA DE UM
LATOSSOLO UTILIZANDO O ÍNDICE S
RESUMO: A qualidade física do solo é fundamental para a sustentabilidade dos sistemas agropecuários e deve ser feita por meio de parâmetros que descrevem o comportamento físico do mesmo. O índice S é um desses novos parâmetros, proposto para quantificar a qualidade física do solo. Valores de S > 0,035 têm sido associados com uma boa qualidade física relacionada à produção agrícola nos solos desenvolvidos em clima temperado. Contudo, S não tem sido avaliado em solos tropicais. Consequentemente, a hipótese deste trabalho é que S pode ser utilizado como indicador da qualidade física de um Latossolo Vermelho distroférrico cultivado com milho em sistemas de plantio direto (PD) e de preparo convencional do solo (PC). Amostras indeformadas de solo foram obtidas em PD e PC nas posições linha e entrelinha da cultura de milho. A densidade do solo foi medida e o índice S foi calculado usando uma função de pedotransferência obtida no mesmo, em condições experimentais. O índice S diferenciou os sistemas de preparo e posições de amostragem, sendo SPD < SPC independente das posições de amostragem linha e entrelinha. Na posição linha verificou-se maiores valores de S tanto em PD como em PC. O valor de S diminuiu com o aumento da densidade do solo, indicando a redução da sua qualidade física, associada à compactação do mesmo. Os resultados confirmam a hipótese estabelecida e sugerem que mais estudos devem ser conduzidos para quantificar o índice S em diferentes solos e sistemas de manejo sob condições tropicais.
Palavras-chave: densidade do solo, solos tropicais, plantio direto, retenção de água, estrutura do solo
INTRODUCTION
Soil physical quality for crops was percepted from the conceptual point of view and from strate-gies used for its assessment. Researchers have high-lighted the importance of the soil physical environment
Dexter (2004a; 2004b; 2004c) recently pro-posed the S parameter to evaluate the soil physical and structural quality. The theoretical development to ob-tain the S value was presented by Dexter (2004a) from the definition of the soil water retention curve (SWRC) as the relationship between the water contents on a mass basis (θ, kg kg-1) and the logarithm (base e) of
the soil water potential (Ψ, hPa), with a single
com-mon inflection point. S is defined as the slope value or inclination of the SWRC at its inflection point.
S can be determined directly from the SWRC. However, the Ψ(θ) data can be fitted in to a
math-ematical function and the slope at the inflection point of the SWRC is calculated from the estimates of the parameters of the used function. The Van Genuchten (1980) function is one of the most frequently used and in many studies their parameters can also be de-scribed from pedotransfer functions. Pedotransfer functions (PTF) to estimate SWRC have been widely developed and used in temperate climate soils (Wösten et al., 1999; 2001) and to a certain extent for Brazil-ian tropical soils (Tomasella et al., 2000; Hodnett & Tomasella, 2002).
Up till now the S index has not been evaluated in to tropical soils. In order to address this lack of in-formation we hypothesized that S is a potential good indicator of the physical quality for tropical soils. Therefore the objective of this study was to assess the S in order to identify associated changes with tillage and crop row position in a Brazilian Oxisol.
MATERIAL AND METHODS
Undisturbed soil samples were collected in Au-gust, 1996 from a commercial farm located in the northeastern region of the State of São Paulo, Brazil (20°19’ S and 48°18’ W). The climate is defined as humid tropical, with mean annual temperature of 22.7°C and 1,420 mm rainfall. The soil is classified as Typic Hapludox (Rhodic Ferralsol) with particle size distribution consisting of 800 g kg-1
clay, 150 g kg-1
silt and 50 g kg-1 sand.
The study used two contiguous plots culti-vated by the no-tillage (NT) and conventional tillage (CT) systems. The NT area was set up four years before whereas the CT area had been used for ten years. Conventional tillage was carried out with a disk plough followed by cultivation. Both areas were irri-gated with a central sprinkler. When the samples were taken water had been applied in the area twenty times as 16 mm water head each time. The irrigation con-trol was based on a class-A evaporation pan. In both
areas crop rotation consisted of soybean (Glycine
max, L. Merril), maize (Zea mays, L) and beans
(Phaseolus vulgaris, L.). By the sampling time (silking stage) both areas were cropped with maize at 0.90 m. of row spacing.
Undisturbed samples (0.05 m diameter and 0.05 m height) were removed from the center of the 0 - 0.10 m deep layer. The sampling sites were located along a transect perpendicular to the crop rows and the samples were sequentially removed at every 0.45 m, in the row and intercrop row positions totaling 94 samples per tillage system (47 both in the row and in-tercrop row). The samples were then oven dried at 105 - 110°C for of soil bulk density determinations (Db).
The S value calculation was carried out using the Tormena et al. (1999) pedotransfer function as de-scribed in the equation [1] where Db was incorporated in the model via n:
θ = [0.1342 + (θs - 0.1342)/([(1 + 1.3355 Ψ)n
]1-1/n
], [1]
where n = 2.5181-2.064*Db+0.7373*Db2
, being Ψ is
the soil water potential (hPa) and θ
s was obtained from
[(1-Db/Dp)] where Db is the measured soil bulk den-sity (Mg m-3) and Dp is the particle density (assumed to be 2.65 Mg m-3). In each soil sample (or measured Db) from the soil tillage system and sampling position the S value of was obtained according to Dexter (2004a, page 213, equation A8) as described in the equation 2:
S = -n (θ
s-0.1342) [(2n-1)/(n-1)] [(1/n)-2]
[2]
The S values are always negative but to easy their presentation and discuss their results the S modu-lus were used. S values were compared both between tillage methods and row positions, using t test for in-dependent samples according to Hatcher & Stepanski (1997).
RESULTS AND DISCUSSION
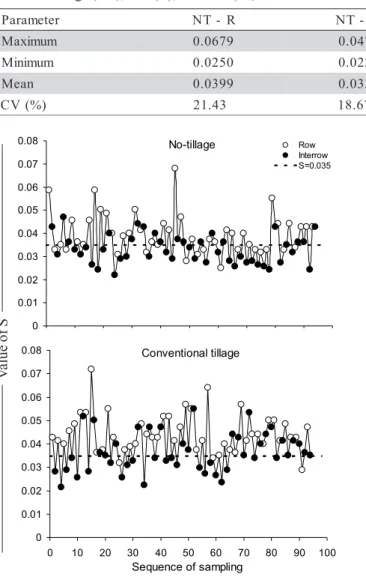
The statistical moments of S values estimated in each tillage system and crop row position (R=row, IR=interrow) are in Table 1.
Means values of S were different between R and IR on no-tillage (t = 4.52; P < 0.0001) and con-ventional tillage (t = 4.97; P < 0.0001), with higher values for the R position as well as IR positions SNT < SCT (P < 0.05). The coefficient of variation (CV), a measurement of the S variability, is in agreement with that reported by Jury & Horton (2004) for properties related to soil water retention.
may be due to several effects associated with modi-fications in pore size distribution. In the IR, machin-ery traffic promotes deleterious modifications in soil structure which resulted in lower S values in both tillage systems. In R, the additional soil mobilization during crop seeding, physical action of roots as well as cycles of drying and wetting (more intense in the crop rows) might have contributed to lower S val-ues.
The difference between NT and CT at the R and IR position may be related to the soil mobilization in the CT system as compared to NT. High S values may indicate that the inflection point occurred at a higher soil water content (i.e. low suction) and these results are also related to the typical behavior of tropi-cal clayey Oxisols with stable microaggregation as dis-cussed by El-Swaify (1980) and Sidiras et al. (1984). In the R position higher S values were detected on CT
Table 1 - Descriptive statistics of the S values (N = 47) estimated for the treatments studied. Conventional tillage (CT); no tillage (NT); row (R); interrow (IR).
r e t e m a r a
P NT-R NT- IR CT-R CT- IR
m u m i x a
M 0.0679 0.0471 0.0719 0.0551
m u m i n i
M 0.0250 0.0220 0.0289 0.0215
n a e
M 0.0399 0.0330 0.0448 0.0362
) % ( V
C 21.43 18.67 18.54 23.11
Figure 1 - S values obtained in no-tillage (NT) and conventional tillage (CT) plotted for crop rows and interrows.
V
alue of S
as compared with NT (Table 1 and Figure 1). The higher S value in the R in CT may have been resulted from a combination of large porous space among small sized aggregates which are common in tropical clayey Oxisols. Besides that, a lower S value in NT could be a due to soil compaction that produces a denser ma-trix with different pore size distribution as compared with CT. The negative gradient of the S values of R towards IR in NT suggests there is a tendency for root concentration in R, mainly at NT where the S range is lower. On the other hand, the improved physical quality of R in CT as compared to NT may be can-celled by restrictions associated to soil water availabil-ity.
Critical S values were tentatively suggested by Dexter (2004a): S > 0.035 was established to indicate favorable soil physical conditions for root growth; a 0.020 < S < 0.035 is considered to be not very favor-able (little root growth) and S < 0.20 are considered highly restrictive (no root growth). The dotted line in Figure 1 indicates the critical value of S = 0.035 es-tablished by Dexter (2004a). S > 0.035 represented 55% in NT and 72% in CT whereas these values dropped to 45% and 28%, respectively, when the 0.020 < S < 0.035 range is considered. Regarding crop position S-row presented 70% and 94% values S > 0.035 for NT and CT, respectively; S-interrow pre-sented 40% and 51% values > 0.035. For the 0.020 < S < 0.035 range these values were 30% and 6% (R) and 60% and 49% for IR for NT and CT, respectively. These results show the potential of the S parameter to identify variations in the soil physical quality as a function of the soil management system, and the spa-tial heterogeneity of this quality associated with the sampling position R and IR. In this study values of S < 0.020 were not detected, which Dexter (2004c) sug-gested to be associated to the presence of an extremely degraded soil structure.
The use of pedotransfer functions is one of the strategies to estimate the S parameter for temperate soils as demonstrated by Dexter (2004a; 2004b). He argued that pedotransfer functions should be used to make predictions of the soil behavior tendency as is used in this study. The distribution of the Db values was used to calculate S values not taking into account
0 0.01 0.02 0.03 0.04 0.05 0.06 0.07 0.08
0 10 20 30 40 50 60 70 80 90 100
Sequence of sampling Conventional tillage 0
0.01 0.02 0.03 0.04 0.05 0.06 0.07
0.08 Row
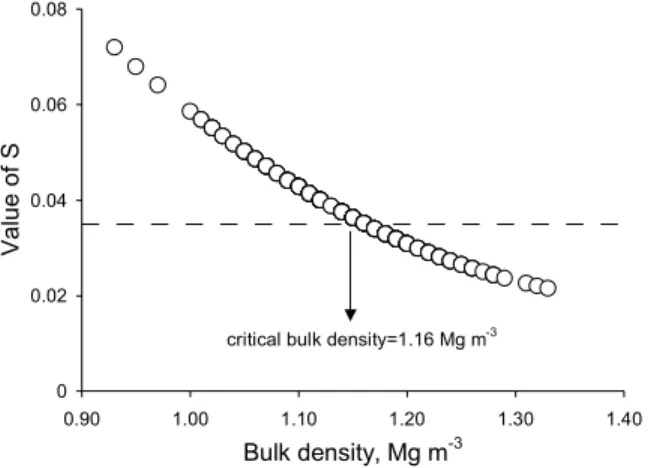
the effects of the treatments assessed, emphasizing the global change in the soil physical quality as a function of soil compaction. The values obtained for S using the pedotransfer function are in Figure 2.
S decreased as Db or compaction increased (Figure 2). This was due to the effect of soil com-paction on drastically reducing the macropores volume with a consequent alteration on the pore size distribu-tion. Similar behavior was found by Dexter (2004a) for temperate soils with different textural classes, where the S value was estimated using pedotransfer functions developed for those soils. The Db value at which S = 0.035, here established as a critical soil bulk density (Dbc), can be assumed as the boundary a be-tween a good and a bad soil physical quality. In Fig-ure 2, the Db = 1.16 Mg m-3
corresponded to the limit from which S < 0.035 values occurred and was con-sidered the Dbc for assessment and control purposes of the soil physical quality. This critical density value is similar to that verified by Dexter (2004a) in a soil with 60% clay. Others researchers have also shown the harmful compaction effect on the soil physical quality (Boone et al., 1986; Betz et al., 1997).
The soil Dbc values estimated according to Tormena et al. (1998; 1999), was defined where the least limiting water range (LLWR) is equal to zero, were DbLLWR=0 = 1.28 Mg m-3. However, it was veri-fied in their studies that at Db = 1.16 Mg m-3
, a strong restriction in the soil physical quality already occurred associated with soil resistance to root penetration. In this sense, Dexter (2004c) commented that the criti-cal value of S = 0.035 is still provisional. However, the author set 0.020 < S < 0.035 as an intermediate category of soil physical quality. For the soil in this study, the critical density values obtained by Tormena et al. (1998; 1999), via LLWR, are found is
in this category so that both the S and the LLWR con-cept are functionally resulting in similar evaluations of the soil physical quality. DbS = 0.035 = 1.16 Mg m-3 is the same value in which soil penetration resistance to root penetration replaces permanent wilting point as the LLWR lower limit indicated by Tormena et al. (1999). In this paper it was found that using S instead of bulk density values has the advantage to get similar S val-ues in soils of different texture (Dexter, 2004c.) This work suggests that the same values of S that are criti-cal in temperate soils may also be applies in tropicriti-cal Oxisols.
The results confirmed the hypothesis estab-lished in this study, showing that the S parameter discriminated the effects of soil management systems on the soil physical quality. Studies on different soils and management systems are needed to better as-sess and validate the S parameter as an indication of the soil physical quality. Its a easy determination that makes it especially useful for assessing and monitoring the effects of the use and management systems in terms of degradation and recovery of the structure as well as the physical quality of the soils. The use of S enables the tropical Oxisol to be compared with temperate soils on the same scale ba-sis.
REFERENCES
ALLMARAS, R.R.; FRITZ, V.A.; PFLEGER, F.L.; COPELAND, S.M. Impaired internal drainage and Aphanomyces euteiches root rot of pea caused by soil compaction in a fine-textured soil. Soil and Tillage Research, v.1740, p.1-12, 2002. BETZ, D.L.; ALLMARAS, R.R.; COPELAND, S.M.; RANDAL,
G.W. Least limiting water range: traffic and long-term tillage influences in a Webster soil. Soil Science Society of America Journal, v.62, p.1384-1393, 1998.
BOONE, F.R.; WERF, H.M.G. VAN DER; KROESBERGEN, B.; HAAG, B.A. TEN.; BOERS, A. The effect of compaction of arable layer in a sandy soils on the growth of maize for silage. I. Critical potentials in relation to soil aeration and mechanical impedance. Netherlands Journal of Agricultural Research, v.34, p.155-171, 1986.
DEXTER, A.R. Soil physical quality. Part I. Theory, effects of soil texture, density and organic matter, and effects on root growth.
Geoderma, v.120, p.201-214, 2004a.
DEXTER A.R. Soil physical quality: Part II. Friability, tillage, tilth and hard-setting. Geoderma, v.120, p.215-225, 2004b. DEXTER A.R. Soil physical quality: Part III. Unsaturated hydraulic
conductivity and general conclusions about S-theory.
Geoderma, v.120, p.227-239, 2004c.
DRURY, C.F.; ZHANG, T.Q.; KAY, B.D. The non-limiting and least limiting water range for soil nitrogen mineralization. Soil Science Society of America Journal, v.67, p.1388-1404, 2003.
El-SWAIFY, S.A. Physical and mechanical properties of oxisols. In. THENG, B.W.K. (Ed.). Soils with variable charge. Palmerston North: New Zealand Society of Soil Science, 1980. p.303-325.
HATCHER, L.; STEPANSKI, E.J. A step-by-step approach to using the SAS System for Univariate and Multivariate Statistics. Cary: NC: SAS Institute Inc., 1997. 552p.
Figure 2 - Estimated values of the S using the pedotransfer function of Tormena et al. (1999). The dotted line indicates the critical value of S = 0.035 proposed by Dexter (2004a).
0 0.02 0.04 0.06 0.08
0.90 1.00 1.10 1.20 1.30 1.40
Bulk density, Mg m-3
V
a
lue of S
HODNETT, M.G.; TOMASELLA, J. Marked differences between van Genuchten soil water-retention parameters for temperate and tropical soils: a new water-retention pedotransfer function developed for tropical soils. Geoderma, v.108, p.155-180, 2002.
JURY, W.A.; HORTON, R. Soil physics. New York: John Wiley & Sons, 2004. 370p.
SIDIRAS, N.; VIEIRA, M.; ROTH, C.H. Determinação de algumas características físicas de um Latossolo Roxo distrófico sob plantio direto e preparo convencional. Revista Brasileira de Ciência do Solo, v.8, p.265-268, 1984.
SILVA, A.P.; KAY, B.D. The sensitivity of shoot growth of corn to the least limiting water range of soils. Plant and Soil, v.184, p.323-329, 1996.
SILVA, A.P.; KAY, B.D. Linking process capability analysis and least limiting water range for assessing soil physical quality.
Soil and Tillage Research, v.79, p.167-174, 2004. TOMASELLA, J.; HODNETT, M.G.; ROSSATO, L. Pedotransfer
functions for the estimation of soil water retention in Brazilian soils. Soil Science Society of America Journal, v.64, p.327-338, 2000.
Received December 11, 2006 Accepted August 02, 2007
TORMENA, C.A.; SILVA, A.P.; LIBARDI, P.L. Soil physical quality of a Brazilian Oxisol under two tillage systems using the least limiting water range approach. Soil and Tillage Research, v.52, p.223-232, 1999.
TORMENA, C.A.; SILVA, A.P.; LIBARDI, P.L. Caracterização do intervalo hídrico ótimo de um latossolo roxo sob plantio direto.
Revista Brasileira de Ciência do Solo, v.22, p.573-581, 1998.
VAN GENUCHTEN, M.Th. A closed form equation for predicting hydraulic conductivity of unsaturated soils. Soil Science Society of America Journal, v.44, p.892-898, 1980. WÖSTEN, J.H.M.; LILLY, A.; NEMES, A.; LE BAS, C.
Development and use of a database of hydraulic properties of European soil. Geoderma, v.90, p.169-185, 1999.