EFFECTS OF GLOBAL CLIMATE CHANGES ON GEOGRAPHICAL
DISTRIBUTION PATTERNS OF ECONOMICALLY IMPORTANT PLANT
SPECIES IN CERRADO
1Lorena Mendes Simon2, Guilherme de Oliveira3, Bruno de Souza Barreto4, João Carlos Nabout5, Thiago
Fernando Lopes Valle Britto Rangel6 e José Alexandre Felizola Diniz-Filho6
ABSTRACT – Different climate models, modeling methods and carbon emission scenarios were used in this paper to evaluate the effects of future climate changes on geographical distribution of species of economic and cultural importance across the Cerrado biome. As the results of several studies have shown, there are still many uncertainties associated with these projections, although bioclimatic models are still widely used and effective method to evaluate the consequences for biodiversity of these climate changes. In this article, it was found that 90% of these uncertainties are related to methods of modeling, although, regardless of the uncertainties, the results revealed that the studied species will reduce about 78% of their geographic distribution in Cerrado. For an effective work on the conservation of these species, many studies still need to be carried
out, although it is already possible to observe that climate change will have a strong influence on the pattern of distribution of these species.
Keywords: Ensemble forecasting, Bioclimatic envelope, Species distribution models, Modeling uncertainty.
EFEITOS DAS MUDANÇAS CLIMÁTICAS GLOBAIS SOBRE OS PADRÕES DE
DISTRIBUIÇÃO GEOGRÁFICA DAS ESPÉCIES DE PLANTAS
ECONOMICAMENTE IMPORTANTES NO CERRADO
RESUMO Neste trabalho, diferentes modelos climáticos, métodos de modelagem e cenários de emissão de carbono foram utilizados para avaliar os efeitos das mudanças climáticas sobre a distribuição geográfica de espécies de importância econômica e cultural das regiões abrangidas pelo bioma Cerrado. Assim como os resultados de vários trabalhos têm evidenciado ao longo dos anos, ainda há muitas incertezas relacionadas a essas projeções, apesar de os modelos bioclimáticos ainda serem a metodologia mais utilizada e eficaz para avaliar as consequências dessas mudanças climáticas para a biodiversidade. Neste artigo, foi possível observar que 90% dessas incertezas estão relacionadas aos métodos de modelagem. Contudo, independente disso, os resultados revelaram que as espécies estudadas reduzirão, em média, 78% de sua distribuição geográfica no Cerrado. Para que haja trabalho eficaz sobre a conservação dessas espécies, muitos estudos ainda precisam ser executados, apesar de já ser possível prever que as mudanças climáticas terão forte influência no padrão de distribuição dessas espécies.
Palavras-chave: Consenso de predição, Envelope bioclimático, Modelos de distribuição de espécies, Incerteza dos modelos.
1 Recebido em 24.04.2012 aceito para publicação em 17.01.2013.
2 Graduação em Ciências Biológicas, Universidade Federal de Goiás, UFG, Brasil. E-mail:<lores_bio@hotmail.com>. 3 P r o g r a m a d e P ó s - G r a d u a ç ã o e m E c o l o g i a e E v o l u ç ã o n a U n i v e r s i d a d e F e d e r a l d e G o i á s , U F G, B r a s i l . E-mail:<guilhermeoliveirabio@yahoo.com.br>.
4 Programa de Pós-Graduação em Ciências Ambientais na Universidade Federal de Goiás, UFG , Brasil. E-mail: <barretobruno@gmail.com> .
5 Universidade Estadual de Goiás, UnUCET, Brasil. E-mail:<naboutjc@hotmail.com>.
1. INTRODUCTION
Since the 1990's, the scientific community has considered the potential impacts of climate changes caused by greenhouses gases on biodiversity (IPCC, 2001). In this context, global climate change has been widely investigated, especially regarding its influences on the current and potential future distribution of species (e.g. THUILLER, 2007). In addition, there is an increasingly interest on the impacts of global climate change on other patterns of biodiversity, especially in terms of functional diversity and phylogenetic (e.g. THUILLER et al., 2011). The methodological foundations for such analyses have been species distribution modeling (SDM), also called niche modeling or bioclimatic envelopes modeling (ARAÚJO; GUISAN, 2006; ELITH; GRAHAM, 2009). The SDM use different climatic scenarios to estimate the extent of occurrence of species (BEAUMONT et al., 2007), therefore, allowing the evaluation of the impact of climate changes on biodiversity (HIJMANS; GRAHAM, 2006; BOTKIN et al., 2007; PEARCE; BOYCE, 2006; RONDININI et al., 2006).
Several recent studies, both at the local (PAMERSAN, 2006) and global scales (KERR et al., 2007), have been trying to identify and to map out future changes in spatial heterogeneity of climate and to understand the consequences to the conservation planning in a biogeographic context, whereas these factor tends to have implications for conservation projects because of the direct influence on the persistence of species (e. g. ACKERLY et al., 2010). The popularization in use of the bioclimatic models quickly increased the number of papers in this area and a lot of new methods, based in different statistic approaches, emerged in last years (see ELITH; GRAHAM, 2009 to recent discussion).
However, much has been discussed about the uncertainties in SDM results (PEARSON; DAWSON, 2003). To minimize the impacts of these uncertainties, Araújo and New (2007) suggested the use of different methods and parameters in an ensemble forecast, approach, suggesting that results combined across methods are more informative and robust (MARMION et al., 2009). Based in results of these work, the individual importance of each source of variation (i.e. method, scenario, parameters) on assembly data (DINIZ-FILHO et al., 2009) or with only one species (DINIZ-FILHO et al., 2010a, b) have been evaluated and mapped enabling
a better assessment of the uncertainties in the predictions. Diniz-Filho et al. (2010a) recently proposed tree phases for ensembles forecast studies. Phase I would be the calculation of a consensus map of the distribution range using different models, data and methods. Phase II involves an assessment of the differences between the maps using multivariate statistical analyses. And phase III is a quantitative assessment of the sources of variation that influence the results.
In this study, ensemble forecast framework was used to assess changes in distribution of plant species with economic importance in Cerrado, central Brazil.
This assessment is important because, historically,
the Cerrado was target of threats caused by anthropic
actions, such as agriculture and livestock, which have already degraded much of the biome (MARINI et al., 2009; MACHADO; KLINK, 2005). Due to the high number of endemic species that compose the biome, and because of all the peculiarities, the Cerrado is now considered
a global hotspot for conservation (sensu MYERS et al., 2000). Despite all the risk factors already known, the possibility that the growing climate changes may influence the turnover of species has motivated researchers trying to predict which threats may affect biodiversity patterns in Cerrado (OLIVEIRA; MARQUIS,
2002).
The plant species used in this work has historical and cultural importance for Cerrado, because they
have been useful for the economy and feeding of human population over decades of occupation in this region (ALMEIDA et al., 1998). Thus, besides the global importance of the biome, there is also a regional concern about the loss of these species, which are still widely used and are part of the culture and development of communities benefiting from this biodiversity. Thus, the objectives of this study was: i) to evaluate the effects of climate change on geographic distribution of plant species in Cerrado using different modeling
methods, general circulation models (AOGCM) and carbon emission scenarios; ii) and to quantify the importance of each of these sources of variation on rates of turnover species estimated using ensemble forecasting.
2. MATERIALS AND METHODS
The information about the occurrence of 110 plant species from the Cerrado was obtained from Almeida
(e.g. economic, ornamental, medicinal and other) of plant species. The data of occurrence of these species were obtained from Centro de Referência em Informação Ambiental (CRIA; www.cria.org.br), from Flora Integrada da Região Centro Oeste (Florescer; www.florescer.unb.br) and from the scientific literature index in ISI (apps.isiknowledge.com) and Scielo (www.scielo.org). A total of 8,896 points of occurrence were compiled and used for modeling the 110 species.
The Cerrado region was overlapped by a
181-cell grid, in which 181-cells were 1oof latitude by 1oof
longitude. The species occurrence data were obtained by overlapping points of occurrence in this grid, which in turn were associated with environmental variables to model the distribution of species and project them in future. Initially, there was an amount of 110 species; however because of statistical limitation of modeling, only species that had more than 5 cells within Cerrados’s
grid were used (the list of species with the respective number of cells that overlap the Cerrado’s grid and
their proportion on the biome is available in the Supplementary Material).
The environmental variables used in the SDM were: I) minimum temperature; II) maximum temperature; III) precipitation; IV) temperature in the coldest trimester; V) temperature in the warmest trimester; VI) precipitation in the driest trimester; VII) precipitation in the wettest trimester. The future environmental variables are derived from three ocean-atmosphere circulation models (AOGCMs): CCCma (Canadian Centre for Climate Modelling and Analysis), CSIRO (Australia’s Common wealth Scientific and Industrial Research’s General Organisation), HadCM3 (Hadley Centre for Climate Prediction and Research’s General Circulation Model). For each AOGCMs, climatic projections under two emission scenarios of greenhouse gases were used, one pessimistic (A2) and other optimistic (B2) (see KARL; TRENBERTH, 2005). Climatic data of current and future scenarios (projected to 2080) were obtained from the database WORDCLIM (www.worldclim.org). The species occurrence data were modeled using the following “presence-only” methods: BioClim (BUSBY, 1991), Euclidian distance and Mahalanobis (FARBER; KADMON, 2003), GARP (STOCKWELL; NOBLE, 1992), Maxent (PHILLIPS et al., 2006) and Gower Distance (GOWER, 1971). Initially, for each of the six niche modeling techniques, the extent of occurrence of each
species were randomly divided into two subsets: 70% for calibration and 30% for validation, this procedure was repeated 50 times. For the calibration set, a threshold value based on the ROC curve (see ALLOUCHE et al., 2006) was generated, transforming quantitative predictions of the SDMs (for example, estimated probabilities of occurrence in Maxent) in a binary vector of 0/1, indicating the absence or the presence of each species in each cell. To form the ROC curve, pseudo-absences were obtained using the cells outside the scope of occurrence of specie in Cerrado (see LAWLER
et al., 2009 for most details) and then the occurrence of each species was expressed by the frequency at which it appears in a given cell. Following Allouche et al. (2006), the SDM performance was evaluated through the True Skill Statistics (TSS) and Kappa statistics.
The geographical distribution of species modeled in present and projected to the future generated a consensus map (Ensemble phase I), assembling information from different modeling methods (6), different AOGCMs (3) and future scenarios (2). To generate this consensus map, the computer platform BioEnsembles (RANGEL et al., 2009; DINIZ-FILHO et al., 2009a) was used.
Species richness (S) was obtained from the number of presence of each species that overlap each cell, whereas the rate of species replacement (turnover, T) is given by:
T = (G+L)/(S+G)
where, G and L are the number of species gained or lost in each cell, respectively (THUILLER, 2005). The turnover of species was calculated between the difference of species geographical distribution modeled in present (and not the extension of observed occurrence) and in 2080.
scenarios of carbon emissions in the projections (see results), it was decided to evaluate the ANOVA only for two factors that caused more uncertainty in the results, which were the modeling methods and AOGCMs.
3. RESULTS
All species showed strong reductions of geographic distribution in Cerrado, with a mean of loss of 78%
± 7% of the area (Figure 1 and see Supplementary Material for the list of all species). Species widely known in region as “Mangaba” (Hancornia speciosa Gomez)
and “Arnica” (Lychnophora ericoides Less.), may have
had more than 90% of reduction in their current distribution in Cerrado. The SDM adjustments for
the species were generally very satisfactory, with a mean value of Kappa equal to 0.976±0.023, and TSS equal to 0.562±0.036.
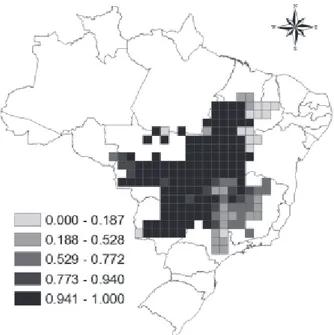
The turnover consensus map for the analyzed species showed a high percentage of change in geographical distribution patterns of these species in the Cerrado for the future, reaching 100% in a large
extension of the study area (figure 2). However, the southeastern and northeastern had values of turnover much lower (reaching 0%).
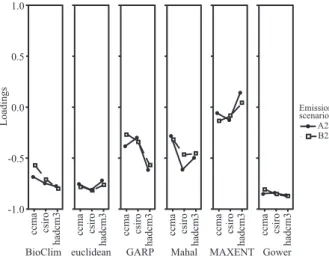
In principal components analyses made for 36 maps of turnover, the first factor explains only 37.5% of the variation in results, whereas the first four factors explained 73.9% of this variation. It can be observed that the main responsible for this variation were the SDMs and the AOGCMs, and that the carbon emission scenarios had little influence on the results (figure 3). Regarding the species distribution models, BioClim, Euclidian Distance and Gower Distance had similar results, whereas MAXENT showed difference compared to other methods.
In the ANOVA with two factors, using the SDMs and the AOGCMs as the main sources of variation, results show that 90% of variation between the turnovers is explained by the different SDMs. The interaction
Figure 1 – Histogram evaluating the average percentage of loss in distribution of useful plant species for Cerrado until 2080, based on ensemble forecast of methods, Atmosphere Ocean General Circulation Models (AOGCMs) and carbon emission scenarios.
Figura 1 – Histograma avaliando a porcentagem média de perda na distribuição das espécies de plantas úteis para o Cerrado até 2080, com base nas previsões de conjunto de métodos, modelos de Circulação Geral entre Atmosfera e Oceano (AOGCMs) e cenários de emissões de carbono.
Figure 2 – Spatial pattern of species turnover resulted from the ensemble analysis (see methods) for the average between Species Distribution Models, Atmosphere Ocean General Circulation Models and carbon emission scenarios.
between the SDMs and AOGCMs explained just 6.7% of this variation and the effect of AOGCMs alone was only 1.2%. The ANOVA results reaffirmed what can be seen in Figure 3, i.e., that the highest difference between the values of the loadings from PCA was because of the use of different SDMs, with some difference between the AOGCMs (especially for methods Mahalanobis, GARP and MAXENT, that explains the interaction).
4. DISCUSSION
The turnover of important plant species for Cerrado
region, suggests a strong pattern of change in species distribution and therefore in assemblage composition in much of Cerrado until 2080. Only the southeastern
and northeastern regions showed some stability in the pattern of occurrence of the studied plant species (Figure 2). These results indicate a trend of displacement of distribution of Cerrado species based on the
bioclimatic envelope.
It is important to note that the analysis was performed only within the Cerrado domain, therefore
the observed reduction on distribution refers only to changes of focal species within the domain, not necessarily indicating extinction of these species. In fact, several reviews have shown expansion of the species from Central Brazil towards the southeast of Brazil (SIQUEIRA, 2007; FILHO et al., 2010b; DINIZ-FILHO, 2009b), which appears indirectly in the analyses presented here by high values of turnover observed in the south-southeast of Cerrado. On the other hand,
this change in composition does not consider that other important species from other regions might move to current geographic region of the Cerrado. Anyway,
the main conclusion of this study suggest that species of economic importance in the Cerrado will displace
their distributions, implying potential social-economic changes in pattern of their use, therefore requiring an adaptation of human population regarding the use of these resources, especially those involving extractive activities (see NABOUT et al., 2011).
The consensus maps generated with the results of forecast changes in modeled species in Cerrado until
2080 were practically the same for the two scenarios of carbon emissions and for different AOGCMs, at least when the effect of emission scenario was compared with those from two other sources. There are few differences between the scenarios of carbon emissions (optimistic and pessimistic) in the analyses, but it does not indicate that there is no importance in relation to such scenarios. The analyses showed that uncertainty in the expected change for the future is small in relation to the effect of climate scenarios, when compared to the uncertainty generated by the construction of distribution maps obtained using different methods of modeling (DINIZ-FILHO et al., 2009a; ARAÚJO et al., 2005a; PEARSON; DAWSON, 2003).
The use of a principal component analysis suggested by some authors (DINIZ-FILHO et al., 2010a; ARAÚJO et al., 2005b) was important to reveal qualitatively the contribution of each source of variation (SDMs, AOGCMs, emission scenarios) in maps resulted from ensemble forecast. Coefficients of PCA show high similarity between the carbon emission scenarios, as expected. The largest variation is associated to the modeling methods, in agreement with results of other studies that found SDMs as the main source of uncertainty (ARAÚJO et al., 2005a, b; DINIZ-FILHO et al., 2009a, 2010a).
Figure 3 – Loadings of principal component 1 of species turnover matrix projected with different Species Distributions Models (BioClim; Euclidean; GARP; Mahal; MAXENT; Gower), Atmosphere Ocean General Circulation Models (ccma; csiro; hadcm3) and carbon emission scenarios.
Moreover, it is also widely discussed in the literature that the SDMs tend to differ from each other in prediction of species distribution, both in the present and future scenarios (ELITH et al., 2006). However, our results show that modeling methods based on distance and the BIOCLIM had similar results. Similarity between these methods is probably by the fact that these methods are the simplest ones in terms of assumptions of niche definition. The most different SDM prediction was provided by MAXENT (with higher values of loadings in PCA), which is in fact far more complex than other SDMs (ELITH; GRAHAM, 2009).
Diniz-Filho et al. (2009a) clearly show that the MAXENT was also one of the used models that most differed from the others with high values of loadings and that the Euclidean Distance and GARP models showed a high variation between different AOGCMs. However, in the present study, a significant variation between the AOGCMs was not observed for any of the models. This difference in the results of these two papers may be associated to the choice of AOGCMs or to the quantity of climatic models used in the ensemble forecast of each methodology. Nevertheless, in this study, the ANOVA results showed that the general circulation models of atmosphere-ocean (AOGCMs) accounted for only 1.2% of uncertainty in the results, and the interaction between models and AOGCMs reached the value of 6.7% of proportion in variation.
5. CONCLUSION
Despite the possibility of making more accurately predictions on changes in the species bioclimatic envelope using the association of several bioclimatic distribution models, AOGCMs and carbon emission scenarios in an ensemble forecast context, it is not possible to remove all uncertainty associated with projections of future climates. However, what can be observed here is that more than the climate scenarios and scenarios of emission carbon, the species distribution models were the largest source of uncertainty in the results obtained for these species in the Cerrado region.
Some studies show that these uncertainties may vary in different parts of the globe (Diniz-Filho et al., 2009a), but the focus of this study is to show that predicted climate change could cause shifts in the distribution patterns of economically important plants
in the Cerrado until 2080. In addition, the changes
in the distribution of these economic important species suggest the need of adaptation of local populations and all commercial/economic structure related to these species (e.g. NABOUT et al., 2011). However, it is necessary better evaluate the uncertainties generated by bioclimatic models used for any prediction, to give more accuracy to the results and to make them useful for any decision-making.
6. ACKNOWLEDGEMENTS
The Development of Bioensembles software used in this paper was supported by Fundação BBVA/Madri and by MCT/CNPq through “Rede Clima”. Work by G. de Oliveira has been supported by a DTI grant from CNPq in the context of GENPAC Research Network for coupling macroecology, conservation biology and molecular ecology in Brazilian Cerrado. Work by J. A. F. Diniz-Filho and T. F. Rangel were financially supported by CNPq productivity fellowships. Work by L. M. Simon and B. S. Barreto were financially supported by CNPq scholarship.
7. REFERENCES
ACKERLY, D. D. et al. The geography of climate change: implications for conservation
biogeography. Diversity and Distributions,
v.16, n.3, p.476-487, 2010.
ALLOUCHE, O.; TSOAR, A.; KADMON, R. Assessing the accuracy of species distribution models: prevalence, kappa and the true skill statistic (TSS). Journal of Applied Ecology, v.43, n.6, p.1223-1232, 2006.
ALMEIDA, S. P. et al. Cerrado: espécies vegetais úteis. Planaltina: Embrapa-CPAC, 1998. p.156-161.
ARAÚJO, M. B.; GUISAN, A. Five (or so) challenges for species distribution modelling.
Journal of Biogeography, v.33, n.10,
p.1677-1688, 2006.
ARAÚJO, M. B.; NEW, M. Ensemble forecasting of species distributions. Trends in Ecology and Evolution, v.22, n.1, p.42-47, 2007.
ARAÚJO, M. B. et al. Reducing uncertainty in projections of extinction risk from climate change.
Global Ecology and Biogeography, v.14, n.6, p.529-538, 2005b.
BEAUMONT, L. J. et al. Where will species go? Incorporating new advances in climate
modelling into projections of species
distributions. Global Change Biology,
v.13, n.7, p.1368-1385, 2007.
BOTKIN, D. B. et al. Forecasting the effects of global warming on biodiversity. Bioscience,
v.57, n.3, p.227-236, 2007.
BUSBY, J. R. BIOCLIM: a bioclimatic analysis and prediction system. In: MARGULES, C. R.;
AUSTIN, M. P. (Ed.) Conservation: cost effective biological surveys and data analysis) Melbourne, CSIRO, 1991. p.64-68.
DINIZ-FILHO, J. A. F. et al. The three phases of the ensemble forecasting of niche models: geographic range and shifts in climatically suitable areas of Utetheisa ornatrix (Lepidoptera, Arctiidae). Revista Brasileira de
Entomologia, v.54, n.3, p.339-349, 2010a.
DINIZ-FILHO, J. A. F. et al. Ensemble forecasting shifts in climatically suitable areas for Tropidacris cristata (Orthoptera: Acridoidea: Romaleidae).
Insect Conservation and Diversity, v.3, p.213-221, 2010b.
DINIZ-FILHO, J. A. F. et al. Partitioning and mapping uncertainties in ensembles of forecasts of species turnover under climate change.
Ecography, v.32, n.6, p.897-906, 2009a.
DINIZ-FILHO, J. A. F. et al. Biogeografia da conservação e mudanças climáticas no cerrado brasileiro. Natureza Conservação, v.7, n.1, p.8-18, 2009b.
ELITH, J. et al. Novel methods improve prediction of species’ distributions from occurrence data.
Ecography, v.29, n.2, p.129-151, 2006.
ELITH, J.; GRAHAM, C. H. Do they? How do they? Why do they differ? On finding reasons for differing performances of species
distribution models. Ecography, v.32, n.2, p.66-77, 2009.
FARBER, O.; KADMON, R. Assessment of alternative approaches for bioclimatic modeling with special emphasis on the Mahalanobis distance. Ecological Modeling, v.160, n.1/2, p.115-130, 2003.
GOWER, J. C. A general coefficient of similarity and some of its properties. Biometrics, v.27, n.4, p.857-871, 1971.
HIJMANS, R. J.; GRAHAM, C. H. The ability of climate envelope models to predict the effect of climate change on species distributions. Global Change Biology, v.12, p.2272-2281, 2006.
KARL, T. R.; TRENBERTH, K. E. What is climate change? In: LOVEJOY, J.E.; HANNAH, L.J., (Ed.)
Climate change and biodiversity New Haven: Yale University Press, 2005. p.15-30.
KERR, J. T.; KHAROUBA, H. M.; CURRIE, D. J. The macroecological contribution to global change solutions. Science, v.316, p.1581-1584, 2007.
KLINK, C. A.; MACHADO, R. B. A conservação do cerrado brasileiro. Megadiversidade, v. 1, n. 1, p.148-155, 2005.
LAWLER, J. J. et al. Projected climate-induced faunal change in the Western Hemisphere.
Ecology, v.90, n.3, p.588-597, 2009.
MARINI, M. A. et al. predicted climate-driven bird distribution changes and forecasted conservation conûicts in a neotropical savanna.
Conservation Biology, v.23, p.1558-1567, 2009.
MARMION, M. et al. Evaluation of consensus methods in predictive species distribution modeling. Diversity and Distributions,
v.15, n.1, p.59-69, 2009.
MCCARTHY, J. J. et al. IPCC
MYERS, N. et al. Biodiversity hotspots for
conservation priorities. Nature, v.403, p.853-858, 2000.
NABOUT J. C. et al. Global climate change and the production of “Pequi” Fruits (Caryocar brasiliense) in the Brazilian Cerrado. Natureza & Conservação, v.9, n.1, p.1-5, 2011.
OLIVEIRA, P. S.; MARQUIS, R. J. The cerrados of Brazil: ecology and natural history of a neotropical savanna. New York: Columbia University Press, 2002. p.329-347.
PARMESAN, C. Ecological and evolutionary responses to recent climate change. Annual Review of Ecology, Evolution and Systematics, v.37, p.637-690, 2006.
PEARCE, J. L.; BOYCE, M. S. Modelling distribution and abundance with presence-only data. Journal of Applied Ecology, v.43, n.3, p.405-412, 2005.
PEARSON, R. G.; DAWSON, T. P. Predicting the impacts of climate change on the distribution of species: are bioclimate envelope models useful?
Global Ecology & Biogeography, v.12, n.5, p.361-371, 2003.
PHILLIPS, S. J.; ANDERSON, R. P.; SCHAPIRE, R. E. Maximum entropy modeling of species
geographic distributions. Ecological Modelling, v.190, n.3/4, p.231-259, 2006.
RANGEL, T. F. L. V. B.; DINIZ-FILHO, J. A. F.; ARAÚJO, M. B. Bioensembles - Software for computer intensive ensemble forecasting of species distributions under climate change.Goias, Madrid: Evora, 2009.
RONDININI, C. et al.. Tradeoffs of different types of species occurrence data for use in systematic conservation planning. Ecology Letters, v.9, n.2, p.1136-1145, 2006.
SIQUEIRA, M. F.; DURIGAN, G. Modelagem da distribuição geográfica de espécies lenhosas de cerrado no Estado de São Paulo.Revista Brasileira de Botânica, v.30, n.2, p.233-243, 2007.
STOCKWELL, D. R. B.; NOBLE, I. R. Induction of sets of rules from animal distribution data: A robust and informative method of data analysis.
Mathematics and Computers in Simulation, v.33, NUMERO, p.385-390, 1992.
THUILLER, W. Biodiversity - Climate change and the ecologist. Nature, v.448, p.550-552, 2007.
THUILLER, W. et al. Consequences of climate change on the tree of life in Europe. Nature,
v.470, p.531-534, 2011.