Chlorophyll
a
fluorescence as indicative
of the salt stress on
Brassica napus
L.
Marcos Antonio Bacarin
1,*, Sidnei Deuner
1,†, Fabio Sergio Paulino da Silva
1,
Daniela Cassol
1, Diolina Moura Silva
21 Departamento de Botânica, Instituto de Biologia, Universidade Federal de Pelotas, 96010-900, Pelotas-RS, Brasil,
2 Departamento de Ciências Biológicas, Universidade Federal do Espírito Santo, 29075-910, Vitória-ES, Brasil.
*Corresponding author: phone: (+55) 53 32757336; fax: (+55) 53 32737169, e-mail:[email protected]. Present address: Embrapa Cerrados – CPAC, BR 020 Km 18, 73310-970 - Brasília, DF - Brazil
Received: 27 September 2011; Accepted:04 February 2012
ABStrACt
The effects of salinity stress on chlorophyll fluorescence and the growth of Brassica napus L were investigated. The chlorophyll
a fluorescence transient were recorded and analyzed according to the JIP-test which can quantify PSII performance. Salt stress resulted in decreased leaf area and dry matter compared with the control treatment (0 mM NaCl). The most pronounced effects of salt stress were observed with 200 mM NaCl, and the hybrids displayed different levels of sensitivity to stress. The Performance Index (PIABS) was the most sensitive parameter to salt stress, which suggests that this parameter can be used to screen genotypes
for salt tolerance.
Keywords:Canola; growth; JIP-Test, salt stress; spring rapessed oil.
Abbreviations: ABS, absorption of light energy; Chl, chlorophyll; ET, conversion of excitation energy to electron transport (ET); ETo/ABS, electron transport activity; F0, FV, and FM – minimal, variable and maximum Chl fluorescence of PSII in the dark adapted
state; FV/FM = φPo= TR0/ABS, maximum efficiency of PSII photochemistry; F0’, FV’ and FM’ – minimal, variable and maximum Chl
fluorescence in the light adapted state; FV’/FM’, efficiency of excitation capture by open PSII reaction centers; FW, fresh weight;
PIABS, Performance Index; PSII, photosystem II; QA, electron acceptor of PSII; qP, photochemical quenching coefficient; RC/ABS,
ratio of reaction centers and the absorbance; TR, trapping of excitation energy; φPSII, actual PSII efficiency; φEo= ET0/ABS, quantum
yield of electron transport; φDo, quantum yield of dissipation; Ψo= ET0/TR0, yield of electron transport per trapped exciton; PAR,
photosynthetic active radiation.
INtrODUCtION
Spring rapessed oil (canola) is an important crop in many countries. Currently, the dominant species is Brassica napus L. The seed typically has an oil content ranging from 35 to 45% and a minimum protein content of 35%. Canola is a form of rapeseed that has less than 2% erucic acid in its oil and less than 30 μmoles of total glucosinolates in its seed meal (Kris-Etherton et al., 2000).
enzymes and facilitating the formation of reactive oxygen species that can damage membranes and proteins (Zhu, 2001). The decrease in photosynthetic activity frequently observed under salt stress may be due to limitations in photosynthetic electron transport and partial stomatal closure (Flexas et al., 2004). Although the effects of salt stress on photosynthesis have been studied intensively, the mechanisms of inhibition of photosynthesis by salt stress remain unclear (Munns and Tester, 2008). Many studies have investigated the effect of salt stress in different plant species and cultivars, including maize (Azevedo Neto et al., 2004), dwarf-cashew (Abreu et al., 2008), cowpea (Maia et al., 2010), faba bean (Tavakkoli et al., 2010), Silver buffaloberry (Qin et al., 2010), among others. But the effects on chlorophyll fluorescence parameters in plants are not clear. In both salt-sensitive and salt-tolerant of Chickpea seedling the salt stress affect FV/FM, φPSII, qP, F0,
and FM (Eyidogan and Tufan, 2007). however, others authors
reported that salinity does not affect chlorophyll fluorescence (Redondo-Gómez et al., 2007). Measurement of chlorophyll
a fluorescence, a non-invasive method, is widely used for monitoring and screening different species and genotypes for stress resistance or tolerance (Percival et al., 2003). The objective of the present study was evaluated the effect of salt stress in five hybrids of canola by determination the growth of the plant and the fluorescence of chlorophyll a.
MAterIAlS AND MethODS
growth conditions and treatments: The seeds of
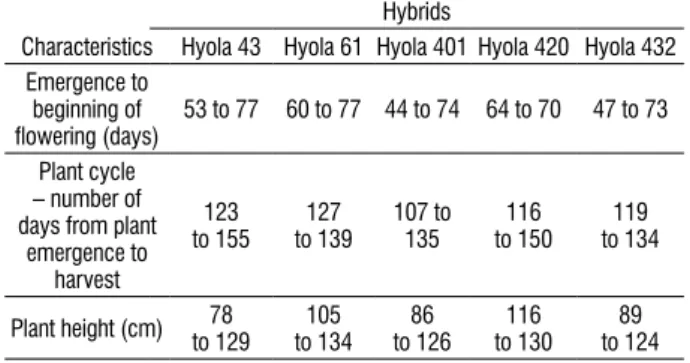
Brassica napus L. var. oleifera (hybrids hyola 43, hyola 61, hyola 401, hyola 420 and hyola 432 from Celena Alimentos S/A – some characteristics were presented in Table 1) were germinated directly in sand, and the plants were grown in 5-liter pots. Plants were grown in a greenhouse during September-January in 2008-2009. The environmental conditions during the growth were: air temperature 25–30°C during the day and 15°C roughly in the night. The PAR at 9 a.m. was 450-500 µmol m-2 s-1. Immediately after sowing,
all pots were randomly divided into four groups, and we started the application of the salt solution; one group was grown in the nutrient solution hoagland (hoagland and Arnon, 1950) as the non-salt stressed (control), while the others were grown in complete nutrient solution plus 50, 100 and 200 mM NaCl as the salt stress treatments.
table 1. The most important characteristics of the hybrids used in experiment
hybrids
Characteristics hyola 43 hyola 61 hyola 401 hyola 420 hyola 432 Emergence to
beginning of flowering (days)
53 to 77 60 to 77 44 to 74 64 to 70 47 to 73
Plant cycle – number of days from plant
emergence to harvest
123 to 155
127 to 139
107 to 135
116 to 150
119 to 134
Plant height (cm) to 12978 to 134105 to 12686 to 130116 to 12489
Chlorophyll content, leaf area and dry weight: Chlorophyll content was measured 48 DAS, and we used a chlorophyll meter (CL-01, hansatech Instruments, Kings Lynn, UK) to measure the middle region of the youngest mature leaf. The values were expressed as the “chlorophyll index” (Cassol et al., 2008). Leaf area, using a area meter (LI-3100, Licor, Lincoln, NE 68504 USA), and total dry weight were measured 48 DAS. The seeds yield was estimated when they had uniformly matured (100 DAS), and express as fresh weight per plant.
Polyphasic Chl a fluorescence transients: Polyphasic Chl a fluorescence transients were measured with a direct fluorometer (handy PEA, hansatech Instruments, Kings Lynn, UK) at 48 DAS. All fluorescence measurements were taken in the middle part of the plant, in fully expanded leaves, with 10 replicates for each treatment (salinity/hybrids). Leaf samples were illuminated with continuous red light (650 nm peak wavelength) after 30 min in dark-adaptation. All measurements were taken using a saturating pulse of 3.000 µmol m–2 s–1 for 1 s. Upon irradiation, dark-adapted
photosynthetic samples exhibit a fast fluorescence rise from the initial fluorescence intensity F0 to a maximal intensity
FM (Lazár, 2006). The fluorescence intensity at 50 µs was
considered to be F0, initial (minimal) fluorescence. The JIP test
(Strasser and Strasser, 1995; Strasser and Tsimilli-Michael, 2000; Strasser et al., 2000, 2004) was used to analyze each Chl fluorescence transient. The Performance Index (PIABS) was
one of the Chl fluorescence parameters that provided useful and quantitative information about the state of plants and their vitality (Strasser et al., 2000).
The PIABS is a combined measure of three partial
photosynthetic reaction centers (RC/ABS), the maximal energy flux that reaches the PSII reaction center (TR0), and the
electron transport at the onset of illumination (ET0).
where RC/ABS is the ratio of reaction centers and the absorbance (the concentration of reaction centers per chlorophyll), φPo/(1 - φPo) is an expression related to primary
photochemistry and Ψo/(1 - Ψo) is an expression related to
electron transport (Oukarroum et al., 2007).
Modulated Chl a fluorescence: Modulated Chl a
fluorescence was measured 48 DAS by a fluorometer (FMS2, hansatech Instruments, Kings Lynn, UK), and the fluorescence parameters were determined in light-adapted leaves. Calculations were made from the following: (1) the photochemical quenching coefficient [qP = (FM’-Fs)/(FM’-F0’)],
(2) the efficiency of excitation capture by open PSII reaction centers (FV’/FM’), and (3) the actual PSII efficiency (φPSII).
Fluorescence nomenclature was used according to van Kooten and Snel (1990). The pulse amplitude modulation (PAM) fluorescence technique obtains both qualitative and quantitative information on the organization and functioning of a plant photosynthetic apparatus by analysis of fast and slow Chl fluorescence induction kinetics.
Statistical analysis: Statistical analysis was conducted with the software package Statistica for Windows Version 6 (StatSoft Inc., 2300 East 14th Street, Tulsa, OK, USA). The
data were subjected to an analysis of variance (ANOVA). The differences in mean values between canola hybrids and salt treatment were compared by a Student’s t-test.
reSUltS
0
chorophyll index (u.r
.)
5 25
20
15
10 30
hyola 43 hyola 61 hyola 401 hyola 420 hyola 432 ns
ns
ns
ns
ns
A
0.000
leaf area (m
2 per plant)
0.015
0.012
0.008
0.004 0.020
hyola 43 hyola 61 hyola 401 hyola 420 hyola 432 ns
AB A A
B
ns A A A
B ns
B
0
dr
y matter total (g per plant)
2
1 3
hyola 43 hyola 61 hyola 401 hyola 420 hyola 432 A
A A
B A
B
C
C
A A A A
B B
B B
C
C A
A
C
0.0
fresh matter of seed (g per plant)
1.6
1.2
0.4 0.8 2.0
hyola 43 hyola 61 hyola 401 hyola 420 hyola 432 A A A
B A
AB
B
C
A
C AAB
B A A A
0 mM 50 mM 100 mM 200 mM
B
B B
A
D
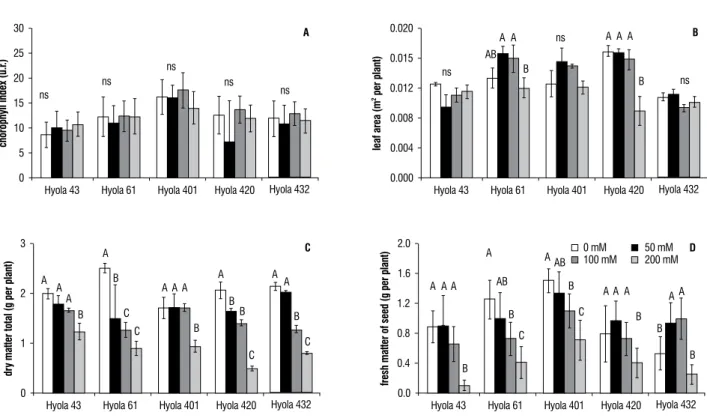
Figure 1. Chlorophyll content expressed as the “chlorophyll index” (a), leaf area in m2 per plant (b), total dry matter in g of dry matter per plant (c) and seed
yield in g of fresh matter per plant (d) in different hybrids of canola subject to salt treatments. Each data point represents the average of eight plants ± standard error. ns = non-significant at p<0.05. Different lettersindicate significant differences among mean values within each hybrid (Student t-test, p≤0.05).
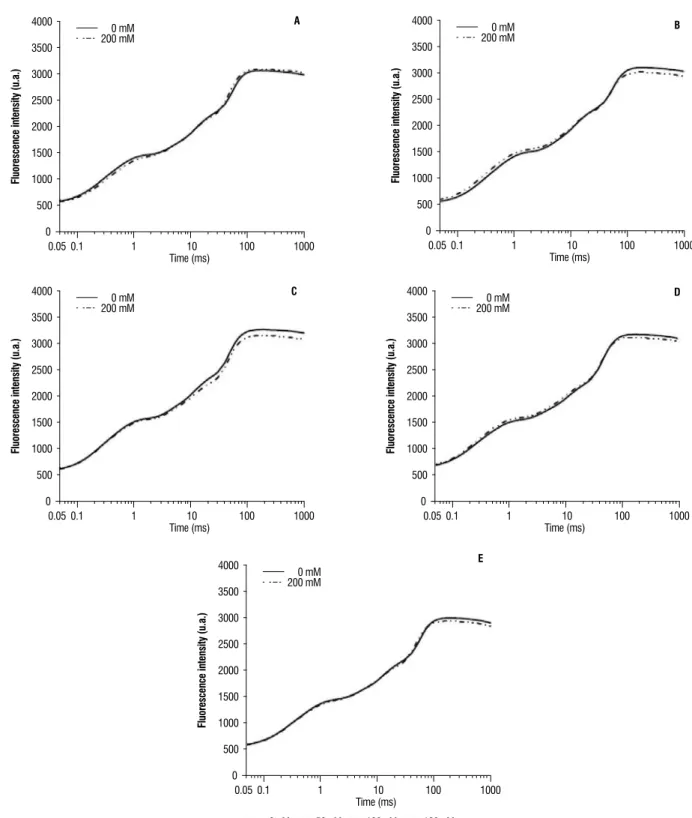
effect of salt stress on Chl fluorescence: When plotted on a logarithmic time scale, the kinetics of fluorescence rise exhibited similar profiles, with distinct O-J-I-P steps in all cases. The OJIP transient represents the successive reduction of the electron acceptor pools of PSII (Strasser et al., 2000). Phase J reflects an accumulation of QA− QB (Lazar, 2006). Phase I reflects an accumulation
of QA− QB−, whereas phase P reveals an accumulation of
QA−QB2− (Lazar, 2006). In Figure 2 we present the curves
of chlorophyll fluorescence measured at 200 mM of NaCl
and control for different hybrids after 48 days of treatment, where we observed the typical curve OJIP.
The maximal efficiency of PSII photochemistry (φPo),
quantum yield of electron transport (φEo), quantum yield of
dissipation of energy (φDo) and yield of electron transport per
trapped exciton (Ψo) were altered by hybrids and salinity,
but there were no significant differences in their interaction. The lowest values of φPo, Ψo, and φEo were observed only at
200 mM for all hybrids, although φDo increased at this salt
0
0.05 0.1 1 0 mM 200 mM
10 Time (ms)
100 1000
Fluorescence intensity (u.a.)
4000
3500
3000
2500
2000
1500
1000
500
A
0
0.05 0.1 1 0 mM 200 mM
10 Time (ms)
100 1000
Fluorescence intensity (u.a.)
4000
3500
3000
2500
2000
1500
1000
500
B
0
0.05 0.1 1 0 mM 200 mM
10
Time (ms) 100 1000
Fluorescence intensity (u.a.)
4000
3500
3000
2500
2000
1500
1000
500
C
0
0.05 0.1 1 0 mM 200 mM
10
Time (ms) 100 1000
Fluorescence intensity (u.a.)
4000
3500
3000
2500
2000
1500
1000
500
D
0
0.05 0.1 1 0 mM 200 mM
10 Time (ms)
100 1000
Fluorescence intensity (u.a.)
4000
3500
3000
2500
2000
1500
1000
500
e
0mM 50mM 100mM 100mM
Figure 2.Curve of chlorophyll fluorescence measured at 200 mM of NaCl and control for canola hybrids after 48 days of treatment. (a) hyola 43, (b) hyola 61, (c)
hyola 401, (d) hyola 420. (e) hyola 432.
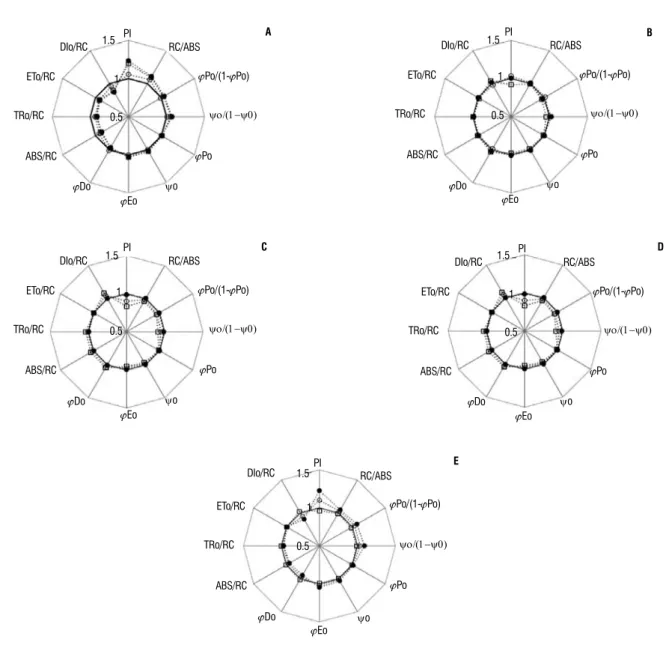
The effect of salinity stress on some JIP-test parameters for each hybrid is shown in Figure 3. There was no large difference for hybrid and level NaCl to specific
chlorophyll per RC; b) TR0/RC – the flux of trapping energy
per RC in t = 0; c) ET0/RC - flux of electron transport from
QA- to PQ per RC in t = 0. Only we observed that DI0/RC
ratio (flux of dissipated energy per RC in t = 0) increased at 200 mM for hyola 401 (Figure 3).
PI
ETo/RC
TRo/RC
ABS/RC
DIo/RC RC/ABS
Eo
Do
Po/(1-Po)
ψo
ψo/(1-ψ0)
Po 1.5
0.5 1
A PI
ETo/RC
TRo/RC
ABS/RC
DIo/RC RC/ABS
Eo
Do
Po/(1-Po)
ψo
ψo/(1-ψ0)
Po 1.5
0.5 1
B
PI
ETo/RC
TRo/RC
ABS/RC
DIo/RC RC/ABS
Eo
Do
Po/(1-Po)
ψo
ψo/(1-ψ0)
Po 1.5
0.5 1
C PI
ETo/RC
TRo/RC
ABS/RC
DIo/RC RC/ABS
Eo
Do
Po/(1-Po)
ψo
ψo/(1-ψ0)
Po 1.5
0.5 1
D
PI
ETo/RC
TRo/RC
ABS/RC
DIo/RC RC/ABS
Eo
Do
Po/(1-Po)
ψo
ψo/(1-ψ0)
Po 1.5
0.5 1
e
Figure 3. Derivation of the JIP-test parameters from Chl fluorescence induction curves for different canola hybrids (a) hyola 43, (b) hyola 61, (c) hyola 401, (d)
hyola 420, (e) hyola 432, subject to salt treatment relative to control (0 mM).
Using PIABS-rel [(PIABS stress/PIABS control)] as a measure of plant
performance, differences in the response to salinity between the studied hybrids were revealed. The Performance Index relative (PIABS-rel) decreased in hyola 61 (8%), hyola 401 (27%)
and hyola 420 (15%), principally at 200 mM. The decline in PIABS-rel observed in hyola 401 and hyola 420 was coupled
with reductions in RC/ABS, φPo/(1−φPo) and Ψo/(1−Ψo) and
increases in DIo/RC. The PI(ABS)rel increased in hyola 43 at 100
and 200 mM and in hyola 432 at 50 and 100 mM.
The Figure 4 shows the correlation of the log relative Performance Index [log PIABS-rel]: (A) log of the relative
reaction centers per chlorophyll [log (RC/ABS)rel], (B) log of
the relative efficiency of primary photochemical [log (φPo/1
of excitation energy to electron transport [log (Ψo/1 - Ψo)rel]
and (D) log of the relative electron transport activity [log (φEo) rel]. All log functions were linear with correlation coefficients
of higher than 0.86; however the relationship between [log (PIABS-rel] and [log (φEo)rel] had the highest correlation
coefficient (0.948).
0.012
0.08
0.04
-0.04
-0.08
-0.012
r=0.874
Log(
Ψ
o/1-Ψ
o)rel
Log(PIABS)rel -0.3 -0.2 -0.1 -0.1 -0.2 -0.3
C
0
0.012
0.08
0.04
-0.04
-0.08
-0.012
r=0.896
Log(
Po
/1-Po
)rel
Log(PIABS)rel -0.3 -0.2 -0.1 -0.1 -0.2 -0.3
B
0 0 0.012
0.08
0.04
-0.04
-0.08
-0.012
r=0.864
Log(R
C/ABS)rel
Log(PIABS)rel -0.3 -0.2 -0.1 -0.1 -0.2 -0.3
A
0 0
0.012
0.08
0.04
-0.04
-0.08
-0.012
r=0.948
Log(
Eo)rel
Log(PIABS)rel
-0.3 -0.1
0.0 0
-0.2 -0.1 -0.2 -0.3
D
Figure 4. Correlation for all treatments between log (PI)rel) and (a) log(RC/ABS)rel, (b) log(φPo/1 - φPo)rel, (c) log(Ψo/1 - Ψo)rel, and (d) log(φEo)rel; r = Pearson
correlation coefficient.
table 2. The efficiency of excitation capture by open PSII reaction centers (FV’/FM’), the actual PSII efficiency (φPSII) and photochemical extinction coefficient (qP) in
different hybrids of canola cultivated with salt treatments.
hybrids NaCl (mM)
0 50 100 200 Means
hyola 43 0.743* 0.746 0.780 0.772 0.760 b
hyola 61 0.771 0.742 0.780 0.764 0.763 b
FV’/FM’ hyola 401 0.701 0.758 0.758 0.786 0.750 bc
hyola 420 0.722 0.691 0.769 0.756 0.734 c
hyola 432 0.780 0.799 0.802 0.794 0.793 a
Means 0.743 b** 0.746 b 0.777 a 0.774 a
hyola 43 0.684 0.713 0.754 0.744 0.724
φPSII hyola 61 0.729 0.711 0.732 0.714 0.721
hyola 401 0.638 0.692 0.729 0.757 0.704
hyola 420 0.672 0.621 0.748 0.730 0.693
hyola 432 0.754 0.776 0.776 0.769 0.769
Means 0.695 b 0.702 b 0.747 a 0.742 a
hyola 43 0.913 0.953 0.967 0.963 0.949
qP hyola 61 0.946 0.957 0.939 0.932 0.943
hyola 401 0.901 0.911 0.961 0.962 0.934
hyola 420 0.929 0.898 0.973 0.966 0.942
hyola 432 0.967 0.971 0.968 0.968 0.968
Means 0.931 0.938 0.961 0.958
*means of ten measurements;
The effect of salt stress treatments on the FV’/FM’, φPSII
and qP in fully expanded leaves is shown in Table 2. The hyola 432 hybrid showed the highest values for the FV’/FM’
ratio and φPSII, and hyola 420 had the lowest FV’/FM’ ratio. The
highest values of FV’/FM’ and φPSII were observed with 100 and
200 mM NaCl. There were no significant differences in the quenching photochemical (qP).
DISCUSSION
The leaf area, total dry matter and seed yields were affected by salinity stress in canola hybrids, principally at 200 mM; however there were differences in sensitivity between the hybrids (Figure 1). The hybrids hyola 43 and hyola 432 were less affected by salinity. Studies on the effects of salinity on carbon assimilation in plants could enable a more comprehensive understanding of their productivity and growth (Chaves et al., 2009). however, the studies show that photosynthetic responses to salinity are highly complex and have some limitations when measuring at different sites on the cell or leaf and at different developmental stages. It is well established that the main effect of salt stress is to decrease photosynthesis, which reduces CO2 fixation rates and plant growth. Maricle et al.
(2007) concluded that salinity decreased CO2 fixation, but the
processes responsible for harvesting solar energy are largely unaffected by increasing salinity in estuarine grasses. While the use of this energy changes with increasing irradiance and salinity, they suggest that there is no strong relationship between fluorescence parameters and salt sensitivity in this species. Our results show that different B.napus genotypes have different levels of susceptibly to salt stress and that the photochemical process can be altered by high salt.
In the present study, we did not find a simple relationship between the growth and fluorescence parameters because the growth was affected by all salt levels, and the fluorescence parameters were only altered in high salinity. Our results showed a slight difference in the maximum yield of primary photochemistry of PSII (φPo) observed only at 200 mM for all
hybrids. Similar results were obtained in the yield of electron transport per trapped exciton (Ψo) and for the quantum yield of
electron transport (φEo) as well as an increase for the quantum
yield of dissipation (φDo). The salinity showed little effect in the
light-adapted state fluorescence parameters, FV’/FM’ and φPSII,
and no affect on the qP (Table 2).
To better evaluate the effects of salt stress on the primary photochemistry of PSII, we examined the absorption flux (ABS), trapping flux (TR) and electron transport flux (ET) per PSII reaction center (RC), i.e. ABS/RC, TR0/RC, ET0/RC.
Our results show that these parameters did not change significantly at 0 – 200 mM. Our results show that there was no significant change in the trapping flux per PSII reaction center (TR0/RC) in salt-stressed plants. TR0/RC represents
the maximum rate of reduction of QA (Strasser et al., 2000).
No change in TR0/RC in salt-stressed plants proposes
that the high conversion efficiency of excitation energy was preserved. According to the results in this study, it is suggested that through a down-regulation of PSII reaction centers and a shift of excitation energy transfer to PSI, the PSII apparatus was thus protected from further excess excitation energy by increased in DI0/RC.
One of the parameters used to analyze the response of the plant to stress is the PIABS. In previous studies, PIABS
was used to estimate plant vitality in response to different environmental stresses to create vitality groups (Strasser et al., 2000). The decrease of the PIABS-rel in response to
salinity stress in hyola 61, hyola 401 and hyola 420 was mainly due to a decrease of the photochemical efficiency of photosynthetic electron transport and an increase of DIo/RC
in high salt. The increase of the PIABS-rel in response to salinity
stress in hyola 432 was principally due to an increase in the efficiency of primary photochemistry and photochemical efficiency of photosynthetic electron transport associated with a decreased DIo/RC.
Linear correlations were observed between the log functions of the Performance Index, the log of the three independent components of PIABS and the log of the relative
electron transport activity. The linear correlation observed between the two log functions of the Performance Index and the electron transport activity indicates that changes in φEo were responsible for most of the change in the
multi-parametric expression of PIABS in the case of salt stress, but
additional alterations in the components of PIABS cannot be
ruled out. When Oukarroum et al. (2007) studied drought and re-watering on 10 varieties of barley (Hordeum vulgare
to determine the susceptibly of the different genotypes to salt or ion stress. The same correlation was used to estimate the relative health of Platanus acerfolia L. trees in a quality assessment of urban trees (hermans et al., 2003). Thus, we conclude that the decrease in growth can not be attributed only the variation in the fluorescence parameters, but the salt effect on fluorescence parameters is mainly observed in high salt. The response to salt stress is dependent on the genotype, and the Performance Index can be used to distinguish the level of tolerance to stress.
Acknowledgement: This work was supported by CNPq (Conselho Nacional de Desenvolvimento Científico e Tecnológico), Secretaria de Desenvolvimento Tecnológico e Inovação do Ministério de Ciência e Tecnologia (MCT) and CAPES (Coordenação de Aperfeiçoamento de Pessoal de Nível Superior). The authors thank the “Celema Alimentos S/A” for supplying the seeds.
reFereNCeS
Azevedo Neto AD, Prisco JT, Enéas-Filho J, LacerdaCF, Silva JV, da Costa PhA, Gomes-Filho E (2004) Effects of salt stress on plant growth, stomatal response and solute accumulation of different maize genotypes. Braz. J. Plant Physiol.,16: 31-38.
Abreu CEB, Prisco JT, Nogueira ARC, Bezerra MA, Lacerda CFL, Gomes-Filho, E (2008) Physiological and biochemical changes occurring in dwarf-cashew seedlings subjected to salt stress. Braz. J. Plant Physiol. 20:105-118. Cassol D, Silva FSP, Falqueto AR, Bacarin MA (2008) An evaluation of non-destructive methods to estimate total chlorophyll content. Photosynthetica 46:634-636.
Chaves MM, Flexas J, Pinheiro C (2009) Photosynthesis under drought and salt stress; regulation mechanisms from whole plant to cell. Ann. Bot.103:551-560.
Eyidogan F, Tufan OM (2007) Effect of salinity on antioxidant responses of chickpea seedlings. Acta-Physiol. Plant. 29:485-493.
Flexas J, Bota J, Loreto F, Cornic G, Sharkey TD (2004) Diffusive and metabolic limitations to photosynthesis under drought and salinity in C3
plants. Plant Biol. 6:269-279.
hermans C, Smeyers M, Rodriguez RM, Eyletters M, Strasser RJ, Delhaye JP (2003) Quality assessment of urban trees: a comparative study of physiological characterization, airborne imaging and on site fluorescence monitoring by the OJIP-test. J. Plant Physiol. 160:81-90.
hoagland D, Arnon DI (1950) The water culture method for growing plants without soil. California Agriculture Experimental Station Circular. 347 p. Kris-Etherton PM, Taylor DS, yu-Poth S, huth P, Moriarty K, Fishell V, hargrove RL, Zhao G, Etherton TD (2000) Polyunsaturated fatty acids in the food chain in the United States. Am. J. Clin. Nutr.71:179S-188S.
Lazár D (2006) The polyphasic chlorophyll a fluorescence rise measured under high intensity of exciting light. Funct. Plant Biol.33:9-30.
Maia, JM, Voigt EL, Macêdo CEC, Ferreira-Silva SL, Silveira JAG (2010) Salt-induced changes in antioxidative enzyme activities in root tissues do not account for the differential salt tolerance of two cowpea cultivars. Braz. J. Plant Physiol., 22: 113-122.
Maricle BR, Lee RW, hellquist CE, Kiirats O, Edwards GE (2007) Effects of salinity on chlorophyll fluorescence and CO2 fixation in C4 estuarine grasses.
Photosynthetica45:433-440.
Misra AN, Srivastava A, Strasser RJ (2001) Utilization of fast chlorophyll a
fluorescence technique in assessing the salt/ion sensitivity of mung bean and
Brassica seedlings. J. Plant Physiol. 158: 1173-1181.
Munns R, Tester M (2008) Mechanisms of salinity tolerance. Annu Rev Plant Biol. 59:651-681.
Oukarroum A, Madidi SE, Schansker G, Strasser RJ, (2007) Probing the responses of barley cultivars (Hordeum vulgare L.) by chlorophyll a fluorescence OLKJIP under drought stress and re-watering. Environ. Exp. Bot. 60:438-446.
Oukarroum A, Strasser RJ (2004) Phenotyping of dark and light adapted barley plants by the fast chlorophyll a fluorescence rise OJIP. S. Afr. J. Bot.
70:277-283.
Panda D, Dash PK, Dhal NK, Rout NC (2006) Chlorophyll fluorescence parameters and chlorophyll content in mangrove species grown in different salinity. Gen. Appl. Plant Physiol. 32:175-180.
Percival GC, Fraser GA, Oxenham G (2003) Foliar salt tolerance of acer genotypes using chlorophyll fluorescence. J. Arboricult. 29:61-65. Qin J, Dong Wy, he KN, Chen J, Liu J, Wang ZL (2010) Physiological responses to salinity in Silver buffaloberry (Shepherdia argentea) introduced to Qinghai high-cold and saline area China. Photosynthetica 48:51-58. Redondo-Gómez S, Mateos-Naranjo E, Davy AJ, Fernández-Muñoz F, Castellanos EM, Luque T, Figueroa ME (2007) Growth and Photosynthetic Responses to Salinity of the Salt-marsh Shrub Atriplex portulacoides. Ann. Bot. 100:555-563.
Strasser BJ, Strasser RJ (1995) Measuring fast fluorescence transients to address environmental questions: The JIP-test. In: Mathis P (ed), Photosynthesis: From light to biosphere. vol. 5, pp. 977-980. Kluwer Academic Publishers, Dordrecht, The Netherlands.
Strasser RJ, Srivastava A, Tsimilli-Michael M (2000) The fluorescence transient as a tool to characterize and screen photosynthetic samples, In: yunus M, Pathre U, Mohanty P (eds), Probing photosynthesis: Mechanism, regulation and adaptation, pp. 443-480. Taylor and Francis, London, UK, Strasser RJ, Tsimilli-Michael M, Srivastava A (2004) Analysis of the Chlorophyll a Fluorescence Transient. In: Papageorgiou GC, Govindjee (eds), Chlorophyll fluorescence: A Signature of Photosynthesis, Advances in Photosynthesis and Respiration Series vol 19, pp 321-362. Kluwer Academic Publishers, Rotterdam, The Netherlands.
Tavakkoli E, Rengasamy P, McDonald GK (2010) high concentrations of Na+
and Cl- ions in soil solution have simultaneous detrimental effects on growth
of faba bean under salinity stress. . J. Exp. Bot. 61:4449-4459
van Kooten O, Snel JFh (1990) The use of chlorophyll fluorescence nomenclature in plant stress physiology. Photosynth. Res.25:147-150. Zhu JK (2001) Plant salt tolerance. Trends Plant Sci. 6:66-71