Vol.49, n. 2 : pp. 231-238, March 2006
ISSN 1516-8913 Printed in Brazil BRAZILIAN ARCHIVES OF
BIOLOGY AND TECHNOLOGY
A N I N T E R N A T I O N A L J O U R N A L
Morphological Discrimination in Juveniles of Two
Selene
Species (Teleostei: Carangidae) Using Truss Net Distances
José de Melo Lima Filho∗, Rosângela Lessa, Borko Stosic, Paulo José Duarte Neto and José Wilson Vieira
Programa de Pós-Graduação em Biometria; Departamento de Pesca; Universidade Federal Rural de Pernambuco - UFRPE; Dois Irmãos; josedemelo@gmail.com; 52171-900; Recife - PE - Brasil
ABSTRACT
External morphological distinction between young Selene vomer and S. brownii (Carangidae) was studied using multivariate analysis with the purpose to evaluate if other characters than the second dorsal and pelvic fin spines could be used as distinguishing attributes for juveniles fishes. These spines are important distinctive morphological characters, but they can be absent in juvenile fishes or be broken during manipulation. A sample of 389 specimens was collected from beach netting at Caiçara do Norte (RN), northeastern Brazil, in 2001. Each specimen was digitalized and their images provided numerical matrices using Scion Image and FANTOMAS software. A C-language program was developed and used to calculate 16 Euclidean distances and nine homologous landmarks plotted on images. Discriminant analysis results revealed that the two Selene species was clearly distinguished employing morphometric procedures of diagonally oriented measurements of the antero-posterior body axis.
Key words: Selene, Carangidae, morphometric discrimination, truss net
∗ Author for correspondence
INTRODUCTION
The western Atlantic species of Selene range from Maine (USA) to South America, including the Gulf of Mexico. The Atlantic look down fish, Selene
vomer (Linnaeus, 1758) reaches around 40 cm fork
length - FL, whereas the moon fish, S. brownii
(Cuvier, 1816) grows to 23 cm FL (Fisher, 1978). They are caught over both hard and sandy bottoms and juveniles are found in estuaries or swimming freely along sandy beaches (Cervigón, 1993). They gather together in large shoals in small groups or in pairs, feeding on small crabs, shrimp, fish and worms (Coupal et al., 1992). Their flesh is tasty, which renders the species appreciated and highly prized in the market (Menezes and Figueiredo, 1980).
Along the northeastern Brazilian coast, small youngsters are caught in shallow waters using beach seines, while adults are captured over seamounts using either purse-seines or handlines. During the juvenile phases, both S. vomer and S.
brownii share the same areas and have similar
appearances, which make identification on the species level rather difficult. S. vomer is usually externally discriminated by the presence of long spines on second dorsal and pelvic fins. However, these spines may be broken due to the beach net action and are as yet undeveloped in very small individuals.
minimize errors and helps in species discrimination when employing the truss net approach (Strauss and Bookstein, 1982), which uses measures from landmarks defined on the basis of the external morphology, assuming homology in the compared forms.
The goal of the present work was to discriminate accurately the young individuals of S. brownii and
S. vomer using multivariate techniques for the
description of similarities among individuals of the same species and between species, based on morphometric features defined in the truss net.
MATERIAL AND METHODS
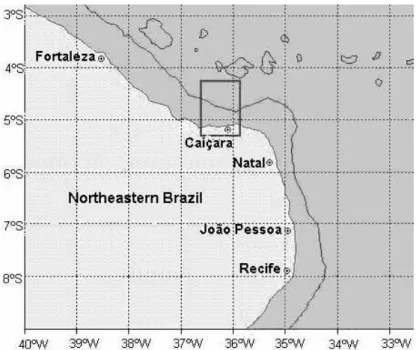
The samples, made up of 389 specimens of Selene brownii (5.48 to 13.41 cm FL; n = 281) and S.
vomer (5.34 to 13.17 cm, n = 108), were collected
from beach seining at Caiçara do Norte, Rio Grande do Norte state, Brazil, in June and July 2001 (Fig. 1).
Figure 1 - Sample area of S. brownii and S. vomer in Caiçara do Norte (RN).
Measurement were taken in the truss net constructed from nine homologous landmarks in both species as indicated in Fig. 2 and Table 1. Specimens were stored for a week in a 4% formaldehyde solution, soaked in 70% alcohol for one hour, and finally exposed to the open air before the left side image of each specimen was digitized using a scanner. Images of each of the 389 specimens gave rise to numerical matrices in two and three dimensions using the Scion Image and the FANTOMAS softwares (Vieira et al., 2003), respectively. A program in C- language (Schildt, 1996) was constructed for calculating the Euclidean distances aimed at landmark plotting of the images. Measures were taken in centimeters considering a 0.07 conversion factor.
All distances (cm) were log-transformed for
Multivariate allometric coefficients for each variable were estimated (Jolicoeur, 1963) from the mean of the first principal component and by then dividing each value by this mean. Allometric coefficients higher than 1 indicated positive allometry in relation to size, whereas those lower
than 1 indicated negative allometry. Allometrically positive variables increased faster than the average, contributing more intensively to the general size factor represented by the first principal component.
Table 1 - Morphological variables in the morphometric study of fishes S. brownii and S. vomer
Variables Notation
Distance from the tip of the mouth to the base of the pelvic fin D 1-2 Distance from the tip of the mouth to the insertion of the first dorsal fin D 1-3 Distance from the base of the pelvic fin to the insertion of the first dorsal fin D 2-3 Distance from the base of the pelvic fin to the insertion of the anal fin D 2-4 Distance from the base of the pelvic fin to the insertion of the second dorsal fin D 2-5 Distance from the insertion of the first dorsal fin to the insertion of the anal fin D 3-4 Distance from the insertion of the first dorsal fin to the insertion of the second dorsal fin D 3-5 Distance from the insertion of the anal fin to the insertion of the second dorsal fin D 4-5 Distance from the insertion of the anal fin to the base of the last anal-fin ray D 4-6 Distance from the insertion of the second dorsal fin to the base of last dorsal fin ray D 5-7 Distance from the end of the anal fin to the base of the last dorsal fin ray D 6-7 Distance from the end of the anal fin to the ventral insertion of the caudal fin D 6-8 Distance from the end of the anal fin to the dorsal insertion of the caudal fin D 6-9 Distance from the end of the second dorsal fin to the ventral insertion of the caudal fin D 7-8 Distance from the end of the second dorsal fin to the dorsal insertion of the caudal fin D 7-9 Distance from the insertion of the lower caudal fin to the dorsal insertion of the caudal fin D 8-9
Figure 2 - Outline drawing of Selene vomer, showing the 9 anatomical landmarks (numbered points) and morphometric distance measures recorded of each individual.
The pattern of discrimination between species was examined by canonical discriminant analysis. Discriminant functions for each species were worked out on the basis of variables with a higher individual contribution, evaluated from standardized discriminant coefficients. The re-location of specimens was carried out on the basis of these functions for verifying their accuracy. Statistical analyses were carried out using SAS
version 6.12 and the CSS STATISTICA Statsoft, Inc. version 6.0 packages.
RESULTS
The Wilks test indicated a slight difference for mean vectors for the 16 distances between S.
P<0.0001). Three first components explained the largest part of the 82.88% of the total variation. This demonstrated that it was proper to use them for morphological analyses, since they adequately explained the variability for the whole set of data (Johnson and Wichern, 1992). Of these, the first explained 65.66%, the second 11.92% and the third 5.29%, and the other components incorporated less than 18% of the variance.
Coefficients of the first eigenvector were positive, and this indicated that all variables were positively correlated with this component and suggests that it was associated to size. The second and third eigenvectors showed positive and negative coefficients, expressing association with the
species form (Table 2). The coefficient vector of the second component (prin2) took negative values for variables d67 to d89 of the caudal peduncle. The projection of specimens in relation to the first and the second principal components (Y1 and Y2) (Fig. 3A) revealed a visual definition of two groups. The same occurred relating the first to the third (Y1 and Y3) (Fig. 3B). In both projection A and B, it was observed that large specimens of S.
vomer overlaped small specimens of S. brownii in
the space of the first two principal components that demonstrated the near of two shape partner. On the other way, there was no visual definition of groups when principal components Y2 and Y3 are considered (Fig. 3C).
Table 2 - Weighted coefficients and correlation between variables studied and principal components Y1, Y2 and Y3 . Obs.: k is the allometric coefficient of each variable.
Var. Y1 (Corr) Y2 (Corr) Y3 (Corr) k
d12 d13 d23 d24 d25 d34 d35 d45 d46 d57 d67 d68 d69 d78 d79 d89 0.2436 (0.8880) 0.1559 (0.7542) 0.1818 (0.8568) 0.2535 (0.7211) 0.1832 (0.8742) 0.2250 (0.8926) 0.1696 (0.6528) 0.2247 (0.8804) 0.2951 (0.8886) 0.3146 (0.9162) 0.2391 (0.7442) 0.2865 (0.7179) 0.2819 (0.8242) 0.2752 (0.8516) 0.3233 (0.7732) 0.2657 (0.8036) 0.1637 (0.2543) 0.1810 (0.3731) 0.2078 (0.4172) 0.1184 (0.1435) 0.2006 (0.4078) 0.2326 (0.3933) 0.1230 (0.2017) 0.2386 (0.3983) 0.2768 (0.3552) 0.2572 (0.3192) -0.0095 (-0.0126) -0.4017 (-0.4288) -0.3709 (-0.4621) -0.1545 (-0.2037) -0.4713 (-0.4803) -0.1705 (-0.2197) 0.1151 (0.1192) -0.0055 (-0.0075) -0.0769 (-0.1029) 0.2270 (0.1834) -0.0641 (-0.0868) -0.0706 (-0.0796) 0.2058 (0.2250) -0.0986 (-0.1097) -0.0140 (-0.0119) 0.0512 (0.0424) -0.1235 (-0.1092) 0.7171 (0.5102) -0.1151 (-0.0956) 0.0746 (0.0655) -0.3650 (-0.2479) -0.4285 (-0.3680) 0.99 0.64 0.74 1.04 0.75 0.92 0.69 0.92 1.20 1.28 0.98 1.17 1.15 1.12 1.32 1.08
Projecting scores for S. brownii and S. vomer
revealed that score of the second component depended on the first (Fig. 3A), which was probably due to allometry. Thus, the general increase in size tended to bring about changes in the shape of these two species during growth. One sole canonic variable explained 100% of the overall variation available. Significant differences in the discriminant scores between samples (t = 6.3453, df = 15, P < 0.0001) were found, where the most important variables for this discrimination were d13 and d34, as they contributed with highest absolute values of standardized canonic coefficients (Table 3). From the projection of
individuals in relation to the canonic axis (Fig. 4), visual separation was defined for both groups S. brownii and S. vomer.
The discriminant analysis correctly located the 281 specimens of S. brownii and the 108 specimens of
S. vomer based on each particular discriminant
Figure 3 - Scatterplots for individual scores on the principal components of truss net distances. (A) Plot scores of the principal components prin1 versus prin2. (B) Plot scores of the principal components prin1 versus prin3. (C) Plot scores of the principal components prin2 versus prin3.
A
B
The re-classification of specimens from both species, carried out on the basis of the two most discriminatory variables, correctly located 98.9% of specimens of S. brownii and 95.7% of S. vomer
individuals in their own species according to the following equations:
Ys = -85.3647 - 20.6826 * a - 4.1176 * b (S. brownii) Eq. 1
Yv = -56.0004 - 5.6338 * a - 22.7904 * b (S.
vomer) Eq. 2
Where:
a = Distance from the tip of the mouse to the insertion of first dorsal fin;
b = Distance from the insertion of the first dorsal fin to the insertion of the anal fin.
When identification is required, both equations must be used with measures of the individuals. If Ys > Yv, the specimen probably is a S. brownii
(accuracy = 98.9 %); conversely it probably belongs to S. vomer (accuracy = 95.7 %).
Table 3 - Standardized canonic coefficients of the 16 variables, of the pooled samples of S. brownii and S. vomer in the canonic axis.
Variable Can1 Variable Can1
d12 0.1548 d46 1.1227
d13 -2.0928 d57 -0.6353
d23 -0.9734 d67 -0.0344
d24 0.4317 d68 0.1124
d25 0.1269 d69 0.2287
d34 1.9249 d78 -0.1363
d35 -0.5193 d79 0.1614
d45 0.6993 d89 0.1883
Figure 4 - Projection of individual scores from the canonical axis of all specimens.
DISCUSSION
The projection of scores for S. brownii and S.
vomer indicated strong dependence on the second
component rather than the first, which was
did not consider the first component, claiming that it was related to the size. However, in the present study such influence might have been minimized by the reduction of allometry effects derived from the range of both species sizes, which were very similar. The plot built with scores of the principal components prin1 versus prin2 and prin1 versus
prin3 showed that the two species were clearly distinct.
There was a dichotomy of signs for the second principal component (prin2), hence the coefficients of variables d12, d13, d23, d24, d25, d34, d35, d45, d46, and d57 were positive, whereas the others were negative. This could perhaps be explained by the differential growth of the caudal peduncle in relation to other parts of the body, as observed by Winans and Nishioka (1987) for
Oncorhynchus kisutch.
The principal components analysis revealed that this technique was not sensitive enough to separate the two Selene species as a function of variables considered from the descriptors of shape prin2 and prin3, since the plot (Fig. 3C) showed a little convergence for the two species.
Discriminant analysis results revealed that S.
brownii and S. vomer from northeastern Brazil
could be easily separated using measures diagonally orientated in relation to the antero-posterior axis of the body. This demonstrated that the total morphometric variation between species, considering 16 measures, could be reduced to just two discriminants. Combined with variables in the above-mentioned equations, this allowed the complete discrimination of both species with 97.3% average accuracy.
Despite this high degree of accuracy, it should be taken into account that these results applied to only the length classes analyzed for each species. No precision was shown for classes out of the analyzed range due to allometric changes in shape during growth.
RESUMO
A distinção morfológica externa entre jovens de
Selene vomer e Selene brownii (Carangidae) foi
estudada por meio de análise multivariada. O propósito deste estudo foi verificar a existência de características morfológicas externas adequadas para separação entre essas duas espécies, que não a presença de espinhos na segunda nadadeira dorsal e nadadeiras pélvicas. Essas nadadeiras podem
estar ausentes em peixes jovens de pequeno porte ou serem quebradas durante as atividades de manuseio e operações de pesca. Uma amostra de 389 espécimes foi coletada da praia de Caiçara do Norte (RN), litoral nordeste do Brasil, em 2001. Cada indivíduo foi digitalizado e cada imagem transformada em uma matriz numérica utilizando Scion Image e o programa FANTOMAS. Um programa em linguagem C foi criado para calcular 16 distâncias Euclideanas posicionadas em 9 marcos anatômicos homólogos e plotadas as imagens. Os resultados da análise discriminante revelaram que as duas espécies de Selene podem ser claramente separadas executando-se morfometrias e efetuando-se medições diagonalmente orientadas em relação aos eixos antero-posteriores do corpo dos peixes.
REFERENCES
Barry, F. H. and Smith-Vaniz, W. F. (1978), Carangidae. In: Fischer, W. (Ed.). FAO species identification sheets for fishery purposes. Western Atlantic (fishing area 31). Rome: FAO. v. 1.
Cervigón, F. (1993), Los peces marinos de Venezuela. Fundación Científica Las Roques. Caracas. Venezuela. v. 2. 497 pp.
Coupal, L.; Bédard, E.; Peguero, C. and Durante, L. S. (1992), Repertorio ictionímici de la República Dominicana. Fascículo I: Acanthuridae - Carangidae. LIRD. pp. 205-208.
Johnson R. A. and Wichern D. W. (1992), Applied multivariate statistical analysis. 2. ed. Englewood Cliffs: Prentice-Hall. 607 pp.
Jolicoeur, P. (1963), The multivariate generalization of the allometry equation. Biometrics, 19, 497-499. Menezes, N. A. and Figueredo, J. L. (1980), Manual de
peixes marinhos do sudeste do Brasil IV. Teleostei (3). Museu de Zoologia, Universidade de São Paulo. Brasil. 96 pp.
Pouyaud, S. and Teugels G. G. (2003), The different colour varieties of the Asian Arowana Scleropages Formosus (Osteoglossidae) are distinct species: morphologic and genetic evidences. Cybium, 27 : (4), 287-305.
Schildt H. (1996), C Completo e Total. 3. ed. São Paulo: Makron Books. 827 pp.
Sokal, R. R. and Rohlf, F. J. (1981), Biometry: the principles and practice of statistics in biological research. San Francisco: W. H. Freeman. 859 pp. Strauss, R. E. and Bookstein, F. L. (1982), The truss:
body form reconstruction in morphometrics.
Vieira, J. W.; Stosic, B.; Lima, F. R. A.; Kramer, R. and Khoury, H. (2003), Um Software para editar fantomas de voxels e calcular coeficientes de conversão para a proteção radiológica. In: Jornada Portuguesa de Protecção Contra Radiações, 10., Lisboa. Anais… Lisboa, Portugal.
Winans, G. A. and Nishioka, R. S. (1987), A multivariate description of change in body shape of coho salmon (Oncorhynchus kisutch) during smoltification. Aquaculture, 66, 235-245.