Universidade de Lisboa
Faculdade de Ciências
Departamento de Biologia Animal
Microclimate matters for the natural
regeneration of abandoned agriculture areas and
ecophysiological performance of Quercus ilex
in drylands
Adriana Príncipe da Silva
Dissertação orientada por:
Doutora Cristina Branquinho
Professora Doutora Otília Correia
Dissertação de Mestrado em Ecologia e Gestão Ambiental
2012
2
Resumo
As drylands estendem-se por cerca de 41 % da superfície terrestre, albergando 38% da população mundial e correspondem ao conjunto dos locais com clima sub-húmido, semi-árido e árido. Estas zonas constituem áreas de elevada susceptibilidade à desertificação. A crescente pressão humana e o aumento previsto da temperatura global são factores que incrementam esta susceptibilidade. As zonas com clima Mediterrânico do Sul da Europa constituem um destes casos. A grande parte do sul de Portugal está classificada climaticamente como semi-árido ou sub-húmido. Os bosques de azinho (Quercus ilex L.) são um dos tipos de vegetação potencial destas drylands do Mediterrâneo e em particular no sudeste de Portugal. Desde a idade média que estes bosques estão associados a vários usos nomeadamente, à caça, à conservação e ao pastoreio, contudo nos últimos séculos têm vindo a sofrer alterações profundas apresentando-se actualmente fragmentados. Nas últimas décadas o êxodo rural levou ao aumento do abandono da agricultura no SE de Portugal e permitiu que os bosques de azinho voltassem a regenerar. Com este trabalho pretendemos contribuir para a compreensão do processo de regeneração natural do ecossistema bosques de azinho, após abandono ou supressão das actividades de exploração aí existentes. Os resultados obtidos neste trabalho poderão ainda contribuir para a elaboração de propostas de mitigação ou restauração destas áreas ou outras áreas desertificadas. O tipo de solo, a topografia e a dispersão de sementes são normalmente considerados factores muito importantes na regeneração da vegetação arbórea. Contudo quando se estuda este efeito a larga escala o clima é em geral o factor mais importante. O microclima gerado pela orografia é em geral considerado um factor muito importante quando se discutem as taxas de regeneração de árvores à escala local e regional. No entanto a quantificação da sua contribuição relativa para a taxa de regeneração de árvores a longo prazo é raramente analisada uma vez que não há em geral medidas a longo prazo do microclima (mais de 30 anos) nem medidas de microclima contínuas no espaço. O conhecimento da quantificação da escala em que estes fenómenos ocorrem e a magnitude da sua importância na taxa de regeneração natural dos bosques de azinho poderá contribuir para uma gestão mais eficaz de drylands em risco de desertificação.
3
Este trabalho desenvolveu-se na Herdade da Contenda, distrito de Beja, Baixo Alentejo, Sul de Portugal. Esta zona revelou-se um excelente local para estudar a dinâmica da regeneração natural nos bosques de azinho devido a vários factores: condições climáticas associadas a zonas de elevada susceptibilidade à desertificação, a ausência de intervenção humana e de incêndios florestais nalgumas áreas desde há pelo menos 63 anos e o facto de ter sido incluída recentemente na rede de locais LTER em Portugal (Long Term Ecological Research site).
O objectivo deste trabalho foi quantificar a importância relativa do microclima associado à orografia na taxa de regeneração dos bosques de azinho assim como da sua performance ecofisiológica numa zona com elevada susceptibilidade à desertificação. Escolheram-se diferentes locais com variações microclimáticas causadas pela orografia, uma vez que esta poderá ter um papel chave na taxa de regeneração das florestas de azinho. Um dos aspectos inovadores deste trabalho foi a utilização da energia solar potencial (PSR – potential solar radiation), uma medida contínua no espaço, como indicador integrado do microclima, reflectindo a temperatura e a humidade relativa. A PSR foi estimada a partir da topografia da área de estudo utilizando uma ferramenta de quantificação da variação temporal e espacial da radiação solar (ArcGis Solar Analyst). Estabeleceram-se 6 classes de valores de PSR, criando um gradiente de acordo com a topografia. Através da interpretação de fotografias aéreas antigas foi determinada a data de abandono agrícola de cada local deste gradiente desde 1947 até 2010. O coberto arbóreo foi mapeado em cada uma das fotos, calculando-se a percentagem de cobertura para cada um dos locais. A avaliação dos factores mais importantes para a regeneração e desenvolvimento da azinheira foi realizada através da aplicação de modelos GLM, utilizando como variáveis explicativas as variáveis climáticas, topográficas e presença de azinheiras antes do abandono. O modelo mais simples, com apenas duas variáveis; radiação solar do mês de Janeiro e número de anos de abandono, foi interpolado para uma nova área sem coberto arbóreo, de modo a prever o tempo de regeneração natural. Avaliou-se a performance ecofisiológica de Q. ilex em condições extremas do gradiente microclimático, foram realizadas medições do peso específico foliar (SLW) e de índices ecofisiológicos baseados nos espectros de reflectância foliar: normalized difference
vegetation index (NDVI), chlorophyll content (CHL), reflectance water índex (WI) e photochemical reflectance índex (PRI).
4
Os resultados obtidos demonstram que o microclima é um factor determinante na regeneração natural das florestas de azinho. Os valores máximos de percentagem de cobertura de azinheira nos extremos do gradiente foram bastante diferentes para o mesmo período de tempo após o abandono (63 anos). Nas áreas com menor PSR obteve-se um valor máximo de cobertura, 92%, ao contrário das áreas com maior PSR apenas com um máximo de 20% de cobertura. Foram construídos dois modelos de regeneração espacial (ao longo do gradiente de PSR) e temporal de Q. ilex. Um modelo utilizando 3 variáveis: PSR, desvio padrão da precipitação dos últimos 70 anos e o número de anos de abandono (R=0,69) e um outro modelo mais simples que incluiu apenas a PSR e o número de anos de abandono (R=0,66). No que respeita à variável PSR, esta foi testada nos modelos para todo o ano de 2011 (integração de todos os meses) e individualmente para cada mês. Verificou-se que a PSR do mês de Janeiro foi a que se mostrou mais significativa na explicação da evolução da cobertura da azinheira ao longo do tempo. O mapa preditivo da percentagem de cobertura de azinheira demonstrou que a regeneração tende a iniciar-se primeiro nas áreas com menor PSR. O desempenho fisiológico da azinheira foi significativamente diferente entre os dois locais extremos de PSR. As azinheiras que se encontram expostas a valores mais elevados de PSR apresentaram valores mais elevados de SLW, e valores mais baixos de PRI e CHL, mostrando marcadas adaptações à seca e à elevada radiação solar.
Apesar da escala local deste estudo poderemos assumir que o modelo da taxa de regeneração natural da azinheira poderá ser aplicável a outras áreas com abandono agrícola, para o mesmo tipo de solo, de clima e de uso do solo. Uma inovação deste trabalho foi a utilização da PSR como proxy do microclima a uma escala local, permitindo revelar a importância do gradiente microclimático na regeneração de ecossistemas naturais em zonas de clima Mediterrânico. A facilidade de obter a PSR e o facto de ser uma variável contínua no espaço é outra das grandes vantagens deste modelo, facilitando a sua aplicação a outras zonas. A modelação da taxa de regeneração de bosques autóctones no clima mediterrânico pode ser uma abordagem importante para o futuro, perante os cenários de alterações climáticas, que prevêem um aumento de aridez nestas zonas. A construção destes modelos permite-nos seleccionar à escala local áreas com capacidade potencial para a regeneração da floresta autóctone permitindo aos gestores florestais orientar as suas acções de acordo com um maior sucesso de
5
implantação. O facto da área de estudo ser um local LTER acresce ainda a importância deste estudo de base, cujos resultados poderão ser o ponto de partida para estudos futuros na mesma região.
Palavras-chave: Reflorestação, energia potencial solar, topografia, florestas de azinho, Mediterrâneo
6
Abstract
In drylands of Mediterranean region, Holm Oaks (Quercus ilex L.) are the main element of the tree layer, being a key species in these ecosystems. Holm Oak woodlands were destroyed in the past for agriculture production. On the last decades the same lands were abandoned suffering a process of natural regeneration. Moreover, revegetation of Holm Oaks is very important to arrest desertification processes especially in the SE of Portugal. The quantification of the long-term effect of microclimate for the rate of regeneration of Holm Oak woodlands was seldom analyzed since there are no long-term measurements of microclimate (more than 30 years) and when there is no spatial continuity in the measurements. Our study aimed to quantify the impact of microclimate on natural regeneration and on ecological performance of Holm Oaks. For this we developed a statistical model of the rate of regeneration of Holm Oak over time using a spatial continuous variable that integrates the potential microclimatic conditions driven by orography, the potential solar radiation (PSR). We evaluated tree cover using aerial photography interpretation since 1947 in areas dominated by Holm Oak in SE of Portugal. Results demonstrated that microclimate is an important factor for Holm Oak natural regeneration rate. The maximum value of tree cover percentage was 92% for the lower values of PSR and 20% for the higher values. This study allowed the quantification of the importance of microclimate in drylands by making use of a variable, PSR which integrates microclimate conditions. It also allowed the development of a simple model that can be used for decision making in forest management. With this model we can compare the time needed for natural regeneration and take decisions about possible restoration measures.
Keywords: Restoration, potential solar radiation, Holm Oak forests management,
7
Índice
Resumo ... 2 Abstract ... 6 Abbreviation List ... 8 1. Introduction ... 91.1 Quercus ilex as studied species ... 10
1.2 Ecological succession process on Mediterranean landscapes ... 10
1.3 Microclimate impact at landscape level ... 11
1.4 The impact on Holm Oak ecophysiological performance ... 12
1.5 Objectives ... 13
2. Methods ... 14
2.1 Study site ... 14
2.2 Sampling design ... 15
2.3 Potential solar radiation ... 15
2.4 Data collection ... 16
2.4.1 Aerial photo and satellite images ... 16
2.4.2 Evaluating tree cover ... 17
2.4.3 Soil analysis... 18
2.4.4 Leaf traits... 18
2.4.5 Environmental variables ... 19
2.5 Data analysis ... 21
2.6 Prediction of natural regeneration ... 22
2.7 Software ... 22
3. Results ... 23
3.1 Holm Oak natural regeneration model ... 23
3.2 Holm Oak cover dynamics in time and space ... 25
3.3 Prediction of natural regeneration ... 28
4. Discussion ... 31
5. Implications for management and restoration ... 35
Acknowledgements ... 37
References ... 38
8
Abbreviation List
Alt Altitude
CHL Chlorophyll content DEM Digital elevation model GLM General linear model
IGEOE Instituto geográfico do exército LTER Long term ecological research site NDVI Normalized difference vegetation index PA Period of abandonment
PRI Photochemical reflectance index PSR Potential solar radiation
PSRR Potential solar radiation range
PSRY Potential solar radiation for 12 months PSR1 Potential solar radiation for January
RSD Rainfall standard deviation of cumulative monthly average since abandonment Slop Slope
SLW Specific leaf weight
SNIRH Sistema nacional de informação de recursos hídricos TCB Tree cover before abandonment
TCB_30 Tree cover before abandonment in the 30 m around sampling plots (%) WI Reflectance water index
9
1. Introduction
The Mediterranean landscape is composed by a fine-grained spatial heterogeneity, with mosaics of cultivated fields and stands of different vegetation succession stages resulting from the combined effect of fire, grazing, cropping and rural abandonment (Naveh, 1995). The Mediterranean biome represents 4% of the drylands. Drylands are defined as areas where climate is classified in arid, semi-arid and sub-humid (Safriel et
al., 2005). Drylands are by definition areas with high susceptibility to desertification
where precipitation is scarce and typically more-or-less unpredictable (Middleton and Thomas, 1997). These systems host 38% of the global human population and cover 41% of the Earth’s land surface (Maestre et al., 2012). Therefore, these areas suffer the influence of human management impacts, including major soil disturbance such as farming or mining (Midgley, 2012). The Mediterranean drylands are also a biodiversity hot spot, hosting many endemic species but vulnerable to global environmental change, desertification and human pressure (Maestre et al., 2012). The ecosystem services provided by drylands are vital for arresting desertification trends, as conversion of solar energy, atmospheric CO2, water to plant biomass, carbon storage, and provision of
nutrient pools (Midgley, 2012). One of the vulnerabilities of these systems is the fact that ecosystem functionality is maintained by only a few species (Maestre et al., 2012).
Montados are man-made systems composed by evergreen oaks (Quercus ilex L. and Quercus suber L.) scattered over a grassland understory. They cover about 3.1 million
ha in the southwest of the Iberian Peninsula and are to be preserved under the EU Habitats Directive due to the high levels of plant and animal diversity they maintain. The main current threat to long-term Montados farming is a chronic absence of natural tree regeneration (Ramírez and Díaz, 2008). Under the Mediterranean climate, Holm Oak woodlands dominated by Q. ilex have been the main ecosystem for centuries. In the past, the most important driving forces of Holm Oak woodlands destruction was massive cutting, burning, extension of croplands and grazing area for livestock (Plieninger et al., 2004). Without human developments oaks would potentially cover 300,000km2. Nowadays, even with the agriculture and population abandonment in the northern part of Mediterranean basin, Holm Oak woodlands only occupy 20,000 to 30,000km2 (Blanco et al., 2001). These woodlands are restricted to small, fragmented,
10
scarcely accessible and usually protected areas devoted to recreation, big game hunting and pasture (Cierjacks and Hensen, 2004; Pulido et al., 2001). Moreover, there are Holm Oak reforestation efforts in some of the unproductive and agriculture abandoned areas. However, tree recruitment and seedling survival in drylands isn’t easy to achieve, being Holm Oak reforestations often unsuccessful (Benayas et al., 2008). The low natural regeneration rates have been justified as being caused by low water availability, low nutrient resources, high competition and high predation (Benayas and Camacho-Cruz, 2004).
1.1 Quercus ilex as studied species
Quercus ilex is the key species of the Mediterranean dryland ecosystems because it is
the only element of the tree layer and is a key component of the habitat for factors such as radiation intensity and water balance (Cierjacks and Hensen, 2004; Cuesta et al., 2012). Oaks regenerate by seedling and resprouting (Larsen and Johnson, 1996). Rootlets resprouting are the most common contribution to Q. ilex regeneration (Espelta
et al., 2003). Also, resprouting magnitude depends of plant’s health status and age, type
and period of disturbance and site conditions (Espelta et al., 2003). Usually, rootlets arise rapidly in close proximity to the mother plant, which leads to woodlands with clumped vegetation structures (Cierjacks and Hensen, 2004). However, after intensive disturbance from agriculture, the soil is bare of rootlets. In these cases the initial vegetation establishment must starts with seed dispersion.
1.2 Ecological succession process on Mediterranean landscapes
In the natural regeneration process of Mediterranean landscapes the main mechanisms controlling successional dynamics is still rather poor studied (Zavala and Zea, 2004). Secondary succession is the most common succession type in Mediterranean landscapes, due to fire and human management. Secondary succession is the process of natural vegetation recovery after one perturbation (e.g. livestock grazing, mining, crop cultivation, tree cutting) (Connell and Slatyer, 1977). On the other hand, natural
11
regeneration is the process of vegetation recovery that happens in all types of succession. The variables that have been quoted as influencing the rate of natural regeneration of trees are: slope angle, water availability, shadow, type of soil (surface stoniness and soil pH), biomass content, North and South slopes, seed dispersion and seed herbivory (Benayas et al., 2008). These variables can be organized in 3 groups: topography (microclimate), climate and disturbance level. The variables as elevation, slope and aspect are related to topography which determines the microclimate. They determine the direction of shade or rain. The level of disturbance is associated with land-use class, type of previous agriculture cultivation, grazing and fire (Jorritsma et al., 1999). The climate variables with greater impact in Mediterranean trees regeneration are rainfall and radiation (Benayas et al., 2005; Safriel et al., 2005; Fensham et al., 2005). Both rainfall and solar radiation are crucial to the availability of water, the most limiting factor for vegetation in drylands.
1.3 Microclimate impact at landscape level
Microclimate can be defined as the climate at small scale (from 0,01m to 1000m) (Oke
et al., 1979). There are at least five variables which together characterize the
microclimate: photosynthetic active radiation (PAR), air temperature, soil water evaporation, effective precipitation and wind exposure (magnitude and direction) (Davies-Colley et al., 2000; Benayas et al., 2005). The impact of climate on vegetation distribution pattern is dependent on the scale of analysis. At the local scale level, topography is the major factor modifying the distribution of solar radiation incidence. Variability in elevation, surface orientation (slope and aspect), and shadows cast by topographic features that create strong local gradients of solar energy arriving to a surface on the ground (Fu and Rich, 1999). Holland and Steyn (1975) suggested that topographic effects on vegetation should be most pronounced in mid-latitudes (30º to 60º). Mediterranean climate is located between these latitudes (30ºN to 40ºN), so it is highly susceptible to topographic influences. In the northern hemisphere, due to the inclination of the sun, northern slopes received less radiation than southern slopes. In general, on South-facing slopes there will be warmer air and soil, lower water availability and sparser vegetation (Holland and Steyn, 1975). The microclimate ranges
12
from warm and dry (xeric) conditions with wide extremes on South, to cool and moist (mesic) with less variable conditions on North slopes (Carmel and Kadmon, 1999).
The dynamics of Mediterranean vegetation (dominated by Quercus calliprinos) over 28 years was studied in the Northern Galilee Mountains, Israel, in order to identify and quantify the major factors affecting it at the landscape scale (Carmel and Kadmon, 1999). These authors found that slope, aspect, and the interaction term between these two factors, significantly affected vegetation pattern (explained 72% of the variability). This study indicates that spatially explicit Mediterranean vegetation dynamics can be predicted with fair accuracy using few biologically important environmental variables.
Experimental studies of irrigation during dry season and the influence of shadow, showed increased seedling survival of Q. ilex (Benayas et al., 2005) Puerta-Piñero et al. (2010) empirically explored how landscape attributes (patch connectivity, size, shape, irradiance, slope, and elevation) influence biotic interactions in 1- and 2-year seedlings and saplings of Q. ilex in Spain. They found that wild boars seem to decrease the abundance of 1-year seedlings and saplings in almost all the scenarios considered. One-year seedlings and saplings of Q. ilex appear to depend more on plant–animal interactions, while 2-year seedlings depend more on irradiance (Puerta-Piñero et al., 2010). Their approach did not account for temporal variations and was performed in short-term (2 years).
Although there are studies showing that radiation is one of the primary drivers of vegetation composition, plant diversity and spatial pattern (Pierce Jr. et al., 2005; González-Tagle et al., 2008), none of the studies, to our knowledge, has attempted to use Potential Solar Radiation (PSR) as a microclimate surrogate in the Mediterranean climate.
1.4 The impact on Holm Oak ecophysiological performance
Plant species show great phenotypic plasticity, adjusting their morphology, anatomy and physiology to climate. This within-species variability may improve plant
13
performance, thereby allowing species to maintain their fitness over a wide range of environmental conditions and resource availability (Castro-Diaz et al., 1997). Mediterranean plants have special adaptations to drought, as sclerophylly, and slow growth. The sclerophyllous character of the leaves is an important indicator of the environmental stress conditions (Correia et al., 1997). The resistance to gas diffusion between leaf intercellular air spaces tends to increase proportionately with tissue density and leaf thickness, and to decrease with increasing fraction of intercellular air spaces in the mesophyll (Niinemets, 1999).This is an adaptation found associated with stressful environments, namely drought and excessive light, since it decreases the water loss and limits the leaf area exposed to light (Correia et al., 1992). Photosystems are the main photosynthetic structures to effective use of solar radiation. Plants have protective strategies to high solar radiation levels which could damage photosystems. Some ecophysiological parameters largely used for measuring the photosynthetic capacity of pants’ leaves were based in leaf spectral reflectance features, such as: i) normalized difference vegetation index (NDVI), which is correlated with photosynthetic activity and health status; ii) chlorophyll content (CHL), which estimates leaf chlorophyll content; iii) reflectance water index (WI), related to plant water content and iv) photochemical reflectance index (PRI), related to photosynthetic capacity (Gamon et
al., 1997; Ogaya and Peñuelas et al., 2006).
1.5 Objectives
The main challenge addressed by the proposed framework is to study the impact of long-term microclimate driven by orography on the natural regeneration and on the ecological performance of Holm Oak trees. This will be performed in contrasting microclimate situations. We proposed to use PSR as an integrated surrogate of the microclimatic conditions. For that our main objectives are: i) use potential solar radiation to explain the changes in the rate of regeneration of Holm Oak cover along a microclimatic gradient; ii) create a Holm Oak regeneration model over time at a local scale; iii) determine the ecophysiological and phenotypic differences of Holm Oak under contrasting microclimate conditions; iv) apply the previous knowledge to improve forest management and help on the strategies to adapt and mitigate climate change effects in the SE of Portugal
14
2. Methods
2.1 Study site
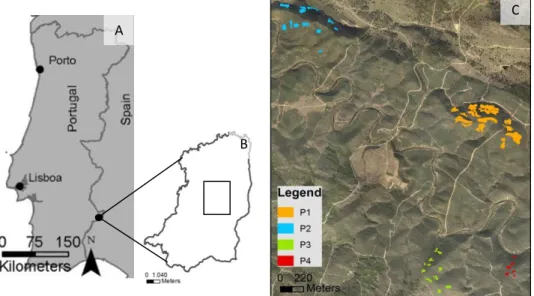
The study site was located at Herdade da Contenda in the SW of Europe, Portugal, Baixo Alentejo (Fig. 1A e 1B). It is a state-owned property with 5270 ha located in the west side of Serra Morena, Santo Aleixo da Restauração, Moura. The territory, presents small mountains (max. altitude 583m) and it is included in dry-sub-humid climate system classification (data from 1961 to 1980) (PGF, 2009). Annual average temperature ranges between 16 and 17,5ºC. Monthly average rainfall varies from 114,1 mm in January to 4,2 mm in August, with an annual average rainfall of 729,5 mm (1931 to 2010), measured in Santo Aleixo da Restauração climatic station (SNIRH, 2012). Soils are classified as lithosols which is a poor soil still developing from first stages of rock degradation (PGF, 2009).
Figure 1. General location of the study area (A), showing the Herdade da Contenda limits (B) and the four studied areas (P1, P2, P3 and P4) with plots location (C).
The study was specifically conducted in the part of the property that has the oldest agriculture abandonment dates. Some of those areas were classified in the management plan of the property as ―Nature Reserve‖ due to their conservation interest. The status was ascribed in 1963 and since then no human intervention occurred in this studied area. It was chosen because of the availability of long-term historical records of
land-A
B
15
use change since 1958 (old cartograms and management plans), suitable edapho-climatic conditions (it is a dryland) and available logistical facilities. Moreover, Herdade da Contenda was classified in 2010 as one of the LTER (Long Term Ecological Research) sites in Portugal (http://www.lternet.edu/).
2.2 Sampling design
For this study, 4 areas were selected (P1, P2, P3 and P4) within Herdade da Contenda. These areas were selected based in the following criteria: 1) slightly mountainous areas with different slope orientations resulting in different microclimatic conditions; 2) Holm Oak forests derived from natural regeneration after agricultural abandonment and; 3) no significant record of human intervention or fires after agriculture abandonment. Each of the 4 areas was then subdivided in plots: 18 plots in P1, 12 in P2 and P3 and 6 on P4 (overall we analyzed 48 plots) (Fig.1C). In each of the plots several parameters were evaluated: tree cover before and after agriculture abandonment, altitude, slope, potential solar radiation and period of abandonment (Table 1).
2.3 Potential solar radiation
In this work we used Potential Solar Radiation (PSR) as a surrogate of microclimate conditions as in Pinho et al., 2010. The potential incoming solar radiation was calculated using a local digital elevation model (DEM) with 1 m resolution created by a solar radiation modelling tool (ArcGis Solar Analyst). This tool allows us to quantify the spatial and temporal variation of PSR at landscape and local scales (Fu and Rich, 1999). The PSR is the amount of energy potentially arriving to a surface on the ground (direct and diffuse), considering the influence of the site and nearby topography (Pinho
et al., 2010). The PSR measured unities used in this work was watt hour for squared
meter (Wh/m2). It does not take into account the presence of trees, clouds or other atmospheric characteristics. Since our working areas are relatively small (max. 44ha) we assume that the cloud effect is similar between our sampling sites.
16
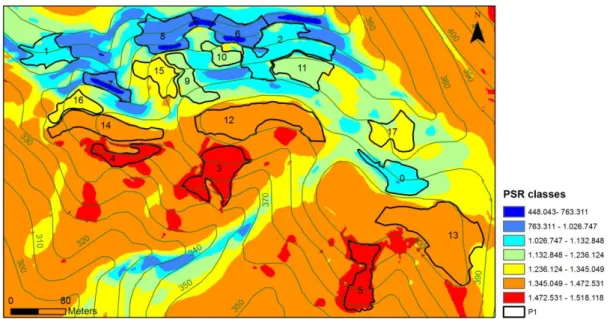
A climatic gradient was established within the studied area based on the spatial variation of PSR, 6 main classes were defined, based on the histogram of total annual PSR values for 2011 obtained by ArcGis Solar Analyst (Fig.2). PSR estimation for the same site will be very similar among different years, since the position and sun angle to the earth don’t change significantly over the years. The areas (P1, P2, P3 and P4) were subdivided in small polygons (plots) to sample the 6 classes of PSR along the climatic gradient. Overall, 48 study plots were selected within this classes of solar radiation. The plots had different areas ranging from 265m2to 9036m2. The PSR value for different months of 2011 in each plot was calculated based on the PSR average measured in six randomly points within the plots.
Figure 2. Potential solar radiation calculated from a digital elevation model. Different colors represent different amounts of potential solar radiation (Wh/m2) arriving to the ground in one year (2011); lines represent hypsometry and the 18 plots of P1 area sampling site.
2.4 Data collection
2.4.1 Aerial photo and satellite images
Aerial photography interpretation was used to identify land-use (namely Holm Oak woodlans or agriculture management) in Herdade da Contenda. Photointerpretation was based on black and white aerial georeferenced photographs and colour orthophotos taken from different dates. Seven photos-sets were available from 1947 to 2010 of
17
―Institudo Geográfico do Exército‖ (IGEOE) archives (1947, 1958, 1969, 1984, 2005 and 2010 [1:25 scale] and 1995 [1:100 scale]). Old photos rectification was made over the 2005 photos to overcome the distortion problems.
2.4.2 Evaluating tree cover
The natural regeneration rate of the Holm Oak forest was calculated using tree cover percentage in each of the 48 plots. This was done by photointerpretation of aerial photos performed by a single observer. The agriculture abandonment occurred at different dates from 1947 up to 1995. Thus, the first step was to identify the time of agriculture abandonment for each plot and photography date (Appendix I). The agriculture abandonment date was identified by comparing pairs of photos along a time series to find the first signs of natural regeneration (the first sign of trees). Overall, among the 48 plots we had different abandonment dates which corresponding a different sets of aerial photos. All the combinations, the number of aerial photos since abandonment for the 48 plots, totalized 187 tree cover photo-interpretation unities of analysis as shows appendix I. In most cases the shrubs and/or trees were replacing the herbaceous layer left by the most common agricultural practice developed in that area which was the cereal production. Tree cover was mapped manually and the area of the formed polygon was evaluated (Fig. 3). The increase in tree cover was followed over time using the photos sequence. The trees present before the overall agriculture abandonment were mapped and their percentage subtracted for further analysis of the tree cover. When this values was zero these data were discarded from the analysis. At the end, from the 187 tree cover photo-interpretation unities we only used 145 which had tree cover presence above 0%. The work focused on the assumption that there are at least some trees to be sure that its propagation is possible and not a limiting factor. In a first approach it was assumed that the trees observed in aerial photos and in our plots were Holm Oaks. This was then successfully validated in a field survey.
18 Figure 3. Manual tree cover (Holm Oaks) mapping in aerial photography in ArcGis environment. Figure shows photointerpretation of three plots of P2 area.
In order to evaluate the natural regeneration rate of tree cover along a gradient of PSR which is also an orography gradient we grouped plots with similar PSRs and plotted the average percentage of tree cover for the different years of agriculture abandonment.
2.4.3 Soil analysis
We evaluated the soil organic matter in the two most extreme PSR classes, the northern and the southern ends. A composed soil sample was collected at each of the two extreme sites, sampling the first 5 cm of soil at 5 different locations (spaced by 3 meters approximately). The soil was transported to the lab in plastic bags and once in the lab was homogenized. We dried 10g of homogenized soil for 24h at 60ºC in the oven and after we put it in the muffle for 24 h at 600ºC. Organic matter weight was calculated as %OM = (Dry weight – Ash weight)/Dry weight x 100).
2.4.4 Leaf traits
Ecophysiological and phenotypic measures were also performed at sites with the two more extreme PSR values: i) in 20 trees located at lower PSR values and ii) in 20 trees at higher PSR values. On each tree, 10 leaves exposed to the sun were collected for
19
measure several parameters. The measures were carrying out in January 2012. Leaf’s reflectance capacity was measured using a UniSpec spectroradiometer (PP-Systems, Haver hills, MA, USA). Several indexes based in reflectance measurements for different wavelengths values were used: NDVI, WI, PRI and CHL.
Phenotypic measures were performed by evaluating the specific leaf weight (SLW) in the two extreme situations. SLW (the ratio between leaf dry weight and leaf area) was calculated also for 10 sun exposed leafs of each tree. The leaf area was evaluated using a Leaf Area Meter (LI _3000 model) and the dry weight obtained with a precision balance after 48h in the oven at 60ºC. Since some reflectance indexes didn’t had a Gaussian distribution we choose to do a non-parametric test (Mann-Whitney Test) to test the significant differences between high and low PSR slope averages (significance level at p<0,05).
2.4.5 Environmental variables
Nine environmental variables, which are likely to affect natural regeneration rates in our study areas, were selected (Table 1). Rainfall was included as variable because water is the main limiting ecological factor in drylands and Mediterranean forests (Kouba et al., 2012; Cierjacks and Hensen, 2004). Rainfall data listed in Table 1 was obtained from ―Sistema Nacional de Informação de Recursos Hídricos‖ (SNIRH) and selected from the nearest climate station, Santo Aleixo da Restauração, which had data from 1931 to 2008 (http://snirh.pt). Since there was no information for this climatic station for the last 3 years (2009-2011) we used information which resulted from a geoestatistical interpolation based on precipitation data from several Alentejo climate stations (Pedro
20
Pinho, IST, Personal communication). The temporal patterns of precipitation at Santo Aleixo da Restauração showed a dramatic change in rainfall in the first period of sampling from 1931 to 1960. Since we don’t have any information about the reliability of this rainfall measurements in the past and because this changes in precipitation were strongly influencing our analysis we decided not to use this absolute data. Despite the possible unreliability of these data, they were the only one available for our study area. Since rainfall seemed to have the same seasonal patterns over the studied period we decided to include a measure of rainfall variability (Standard Deviation) instead of total annual rainfall. Rainfall Standard deviation (RSD) was calculated based on hydrologic years (starting in October of each year). Model variables as altitude, aspect, slope and potential solar radiation (PSR) were derived from the digital elevation model. PSR monthly variables were preliminary tested but January showed to be the most significant. January is the month when the sun position has a lower capacity to heat the ground in this latitude, thus January month showed most the highest amplitude of PSR values when we compared the North and South slopes. Tree cover before abandonment, was measured at two levels: within the plots (TCB) and 30m around the plots (TCB_30).
Table 1. Environmental variables that may affect regeneration Holm Oak rates and that were measured in sampling plots. Variable’s range and standard deviation on appendix II.
1.
Digital elevation model, from hypsometric curves of 10m
2.SNIRH, Sistema Nacional de Informação de Recursos Hídrico (http://snirh.pt)
Variable Sources
Alt Altitude (m) DEM1
Slop Slope (º) DEM1
TCB Tree cover before abandonment (%) Sampled variable
TCB_30 Tree cover before abandonment in the 30 m around sampling
plots (%)
Sampled variable
PSRY Potential solar radiation for one year (12 months) (Wh/m2) DEM and Fu and Rich (1999)
PSRR Potential solar radiation range (Wh/m2)
PSR1 Potential solar radiation for January (Wh/m2)
RSD Standard Deviation of cumulative monthly rainfall average since abandonment (mm)
SNIRH2 (1931 to 2010)
21
2.5 Data analysis
In order to develop a tool that allows us to predict the rate of natural regeneration in the region we used a special framework of General Linear Models (GLM), the generalized linear modeling approach (McCullagh and Nelder, 1989). On STATISTICA software GLM framework computes all possible models using all variables combinations. The objective was to obtain an equation easy to transpose for prediction in other situations:
Y = β + β1X1 + β 2X2 + …
Where Y is the response variable, Holm Oak cover; β1, β2, etc. are constants estimated
by maximum-likelihood and X1, X2, etc. are environmental variables, the predictor
variables (Table 1).
Despite another advantages of GLMs (e.g. admit several distributions for the dependent variable, link function, etc.), this approach was used instead of linear regression since in the SATISTICA software GLM framework enables an easier handling of all possible predictor variables combinations and prompt model comparisons. Holm Oak cover percentage data showed a logarithm tendency; so we choose to transform cover data into a Gaussian distribution by a natural logarithm (Ln) transformation. Afterwards, Gaussian distribution with an identity function was used for the analysis in GLM, after ensuring the assumptions: the relations between variables were linear and random residuals distribution. On STATISTICA software GLM framework computes all possible models using all variables combinations. Models with different sets of predictors were compared to obtain insight into the importance of each variable. The simplest model had to capture how much the regeneration cover rate varies with environmental factors and it was selected by an iterative method based on maximum likelihood estimation (LR: likelihood statistics). Considering parsimony principle, the model with few variables and the highest likelihood estimation value was selected. Afterwards, we check significance of selected variables by Wald test. Two models were constructed (Model A and Model B) based on the combination of significant variables with the maximum likelihood value. The model with more variables had a higher R2 (higher explanation) but the second one had few variables and high accuracy to be applied to prediction future scenarios because it did not depend on precipitation values. Therefore, we choose to compare the two models.
22
Each model validation was performed by randomly partitioned the original sample (Holm Oak cover percentage) into 10 subsamples, with 10% subsets of the original values. These observed values were excluded from the new models’ calculations, which were performed with the remaining 90% observed values. We created 10 new equations for the two selected models and after we use them to predict the excluded observed values. The results from the 10 subsamples then were averaged to produce a single estimation. Then, the average of difference between predicted and observed values for model A and B were compared. This approach, called cross validation analysis, was useful to estimate potential forecast error.
2.6 Prediction of natural regeneration
The equation obtained through the simplest model was used to predict the evolution of tree cover after agriculture abandonment in areas not studied before. In Herdade da Contenda reforestation programs already have been performed. The most recent Holm Oak reforestation effort in areas without arboreal cover was in 2009 (Lúcio do Rosário, Personal communication). However from all the young trees only few survived. The area choose to apply the model was one of these areas with a failed reforestation effort. This area without trees was select near areas used for the previous model. PSR of January 2011 was calculated for each point in a 2m grid along the selected area. For each PSR value, the tree cover percentage was calculated for 25, 40, 50 and 60 years. Predicted values were processed into a percentage cover map using the inverse distance weight, a quick deterministic interpolator technique performed by ArcGis.
2.7 Software
We used ArcView v. 10, geographic information systems software (ESRI, Inc.). Statistical analysis was carried out by means of the software STATISTICA v.10 (Stat Soft. Inc. 2012).
23
3. Results
Potential solar radiation (PSR), here as a surrogate of the long-term microclimate gradient conditions, was one of the best variables explaining the rate of regeneration of Holm Oak. Potential solar radiation for January in each one of the plots varied between 11675 and 59064 Wh/m2 (N=48, standard deviation [SD]=15005Wh/m2). From the 48 plots sampled, 4 never showed tree cover. These 4 plots were located in areas with the highest values of PSR ranging from 43363 to 56947 Wh/m2 (N=14; SD=5460). Holm Oak cover ranged from 0,02 % to 92,6% (N=145; mean±SD=16,7±22,6). In the hill, the lower and highest PSR sites (North and South slope, respectively) showed different rates of natural regeneration being the northern sites always higher than the southern. In areas were trees were not covering all the available area the shrub level was dominated by the typical Mediterranean shrub Cistus ladanifer. The percentage of organic matter of the soils collected from the two more extreme situations did not showed contrasting differences that could justify the differences observed in tree cover (data not shown).
3.1 Holm Oak natural regeneration model
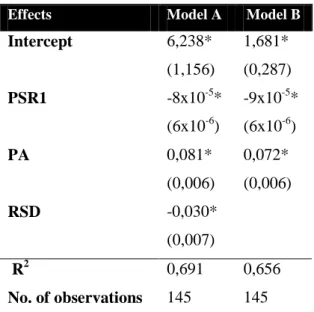
Models were developed for predicting the rate of natural regeneration of Holm Oak from a set of environmental variables. Of all tested possible combinations of variables all models with four or more variables presented at least one non-significant variable. Thus, only the models with three or less variables were considered. Of those, we selected two models with the highest likelihood score (the best fitting): one more complex, with three variables (model A) and another simplest with only two variables (model B). The predictors selected for model A (R2= 0,69) were PSR1, RSD and PA, whereas for model B (R2= 0,66) were PSR1 and PA (Table 2). The single predictor of % cover of Holm Oak was January PSR (PSR1).
The models equations, after accounting for the log of the % cover were:
Model A: % Holm Oak cover = Exp (6,24 – 8x10⁻⁵PSR1 – 0,03RSD+ 0,08PA) Model B: % Holm Oak cover = Exp (1,68 + 9x10⁻⁵PSR1 + 0,07PA)
24 Table 2. Regression results performed by GLM statistical analysis for Holm Oak cover. Predictor variables: PA, Period of abandonment; PSR1, Potential solar radiation for January; RSD, Standard Deviation of cumulative monthly rainfall average since abandonment. The values given are the predictors estimates and Standard errors (performed by Wald Test) are reported in parentheses. R2 between observed and predicted values is given as a measure of the fit of the models.
Effects Model A Model B
Intercept 6,238* (1,156) 1,681* (0,287) PSR1 -8x10-5* (6x10-6) -9x10-5* (6x10-6) PA 0,081* (0,006) 0,072* (0,006) RSD -0,030* (0,007) R2 No. of observations 0,691 145 0,656 145 * indicates significance at the 99% level
The cross validation performed for both models (Table 3) showed very similar properties, with a small tendency for underestimation by the models (shown by average, median statistics and the module of the difference between observed and predicted values. Plotting the observed versus predicted values (Fig. 4) we could also detect a higher dispersion of the predicted values for Holm Oak cover above 20%.
Table 3. Models statistics for the observed and predicted values (Holm Oak %) obtained by cross-validation (averages of 10 simulations using 10% of the values to validate the model). Error average was calculated by the module: Observed values – Predicted Values.
Observed Predicted A Predicted B
Average 14,7199 13,4097 13,5680 Standard Deviation 20,2566 21,0580 22,0845 Median 5,6365 4,6593 4,8726 Min 0,0244 0,0293 0,1321 Max 87,9244 92 92 Error average 8,0544 9,3631
25 Figure 4. Bi-plot of predicted vs observed values performed on 10 subsamples of 10% randomly chosen values.
3.2 Holm Oak cover dynamics in time and space
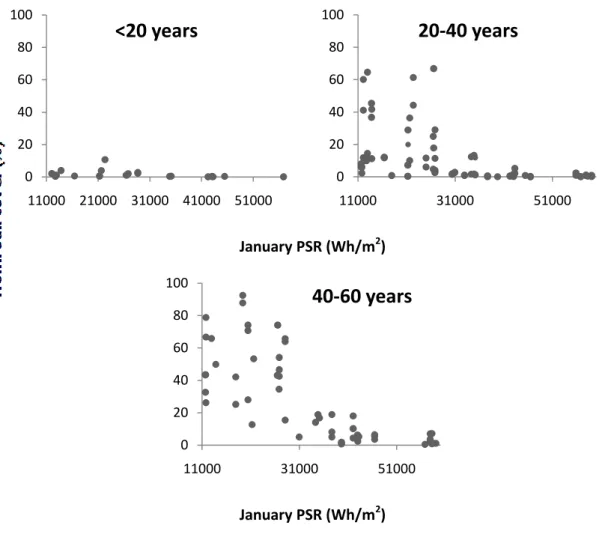
Plots with Holm Oak cover were analyzed for maximum of 63 years period and in figure 5 they are organized by time after abandonment and plotted against PSR. The results showed an exponential decrease of percentage of tree cover with increasing PSR. Twenty years after abandonment is not enough to have a substantial (<20% tree cover) tree cover under this climate conditions (Fig. 5). Between 20 and 40 years there are some plots that showed tree cover up to almost 80%. However this plots with largest tree cover where all associated with low PSR (<25000Wh/m2). Even between 40 and 60 years of agriculture abandonment is not possible to observe tree cover above 20% when the PSR is higher than 31000Wh/m2. We may consider that after 40-60 years is possible to have a virtual completely tree cover (~92%) at least for the sites with lower PSR (<31000Wh/m2). The sites with highest PSR (> 31000 Wh/m2) never reached 20% of Holm Oak cover even after 63 years of abandonment.
0 20 40 60 80 100 0 50 100 Pr e d ic te d Observed Model A 0 20 40 60 80 100 0 50 100 Pr e d ic te d Observed Model B
26 January PSR (Wh/m2)
January PSR (Wh/m2)
Figure 5. The evolution of the percentage Holm Oak cover as function of the January PSR (Wh/m2) in 3 periods of time; 1st: less than 20 years after abandonment; 2nd: 20 to 40 years after abandonment; 3th: 40 to 60 years after abandonment.
The changes in the orography were associated with a gradient of PSR. The percentage of tree cover plotted against the years after abandonment, separated by classes of PSR is shown on figure 6. In the northern parts of the hill, tree cover started to increase significantly 15 years after abandonment. Whereas, in the plots with the highest PSR the first signs of trees only occurred 40 years after abandonment in specific sites (with lowest PSR and higher altitude) (Fig. 6). Until then these sites were covered only by shrubs. 0 20 40 60 80 100 11000 21000 31000 41000 51000
<20 years
0 20 40 60 80 100 11000 31000 5100020-40 years
0 20 40 60 80 100 11000 31000 5100040-60 years
27 Figure 6: Values from Holm Oak cover for 6 classes of PSR that are here represented by orography. In the left side we have the 3 highest PSR classes and in the right side we have the lower PSR classes. In each graph it is represented the average of January (2011) PSR values of each class. The PSR classes are connected to orography, so there are also spatial correspondences with the slopes of the hill. The PSR gradient goes from high-to-low (57737 to 12528Wh/m2), from South slope to North slope of the hill. The bars are the standard deviation of Holm Oak cover(%). The number 6 is the class which more often appears in the bottom of the hill in the lower PSR values. The number 5 is the class with the less tree cover increasing along the time, is located in the most sun exposed slope of the hill. The numbers 1 to 4 correspond to the middle classes and also represent the middle state of succession.
0 20 40 60 80 100 1969 1979 1989 1999 2009
PSR= 35649Wh/m
2 0 20 40 60 80 100 1969 1989 2009PSR= 27170 Wh/m
2 0 20 40 60 80 100 1969 1989 2009PSR= 43572Wh/m
2 0 20 40 60 80 100 1969 1989 2009PSR= 20088 Wh/m
2 0 20 40 60 80 100 1969 1979 1989 1999 2009PSR= 57737 Wh/m
2 0 20 40 60 80 100 1969 1979 1989 1999 2009PSR= 12528 Wh/m
2 Date in years Higest PSR values (South side of the hill)Lower PSR values (North side of the hill)
28
3.3 Prediction of natural regeneration
To apply the previous knowledge for predicting the rate of natural regeneration under a similar climate, an area not previously used in the development of these models was selected. The new area have a PSR ranging between 18359 and 51918Wh/m2 and were used to estimate regeneration until 60 years of abandonment using model B since it was the simplest one. Applying this model we expect substantial differences in the spatial pattern in the rate of Holm Oak regeneration (Fig.7). We predict for the northern slope of the selected area that Holm Oak cover can reach 40% to 80% after 60 years. While for the southern slopes, and for the same period, the model predicts a percentage of tree cover of less than 5% (Fig. 7F), which means low probability of tree regeneration in the short to long-term. This studied area was part of a largest area which was reforestated in 2009 with young seedlings of Holm Oak (Lúcio do Rosário, Personal communication). However, as we can see in figure 7 A and B only in the North slope, with lower values of PSR we can observe some trees covering the area, whereas, the South slope (higher PSR) lacks trees. In the place where our model predicts less tree cover is in fact where we have fewer trees. The reforestation was more successful in the NW side were our model predict the first signs of Holm Oak cover after 40 years (Fig. 7D).
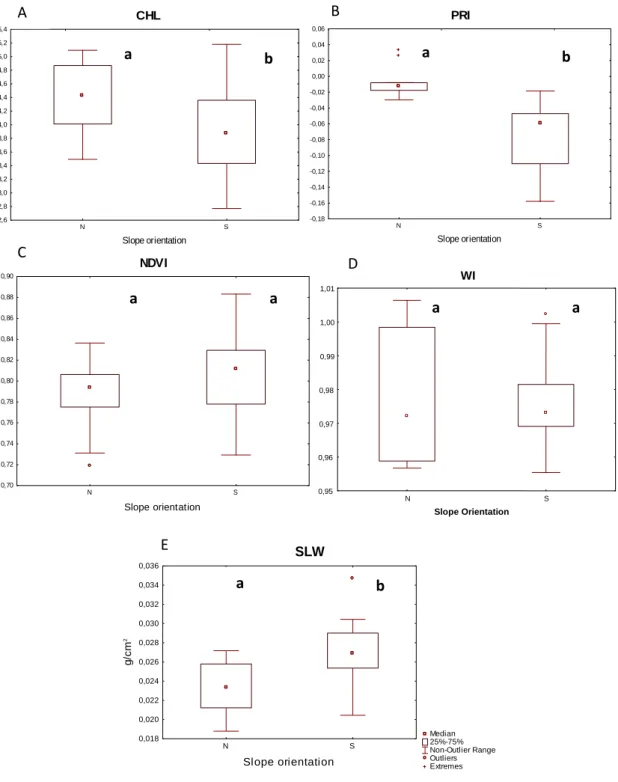
3.4 Microclimatic impact at tree level
The result of ecophysiological and phenotypic measures showed some differences between leaves of trees collected from the two more extreme situations, higher and lower PSR values (South and North slopes, respectively). We found significant differences in leaves collected from trees in places with higher and lower PSR for PRI, CHL and SLW (Fig. 8: A, B, F). The leaves from the lower PSR sites had higher values for PRI and CHL than the ones from the higher PSR sites, whereas, SLW was higher in the leaves from the higher PSR sites. WI and NDVI did not display significant differences between the two extreme situations although the patterns of values had different distributions patterns (Fig. 8: C, D). The WI measure in leaves of the lower PSR sites showed that 50% of values close to median are dispersed in a wider range then the ones in the higher PSR sites. NDVI displayed a similar pattern however the wider distribution of values was found in the South slope.
29
Figure 7: A and B are pictures from aerial photographs from 2010. A: Area selected for
natural regeneration prediction (orange polygon), the green plots are the P2 area showed in figure 1C. B: Hypsometric curves (blue lines). Predicted Holm Oak cover percentage map for 25 (C), 40 (D), 50 (E) and 60 years (F) after agriculture abandonment. Different green tonalities represent different predicted tree cover percentages.
Holm oak cover (%) 0,4 - 5 5 - 10 10 - 20 20 - 40 40 - 83 B A C 5 0 D E 5 0 F
30 WI N S Slope Orientation 0,95 0,96 0,97 0,98 0,99 1,00 1,01 a a CHL N S Slope orientation 2,6 2,8 3,0 3,2 3,4 3,6 3,8 4,0 4,2 4,4 4,6 4,8 5,0 5,2 5,4 PRI N S Slope orientation -0,18 -0,16 -0,14 -0,12 -0,10 -0,08 -0,06 -0,04 -0,02 0,00 0,02 0,04 0,06 NDVI N S Slope orientation 0,70 0,72 0,74 0,76 0,78 0,80 0,82 0,84 0,86 0,88 0,90 SLW Median 25%-75% Non-Outlier Range Outliers Extremes N S Slope orientation 0,018 0,020 0,022 0,024 0,026 0,028 0,030 0,032 0,034 0,036 g /c m 2
Figure 8: Ecophysiological (CHL, PRI, NDVI and WI) and phenotypic (SLW) leaf
parameters from trees in the lower PSR (N-North) and higher PSR (S-South) sites. The different letters (a and b) represent significant differences between leafs from slopes with contrasting PSR values according to Mann-Whitney test (p<0,05). A, B and E had significant differences (CHL, p=0,02; PRI, p=0,00; SLW, p=0,00). However C and D didn’t has significant differences (NDVI, p=0,13 and WI, p=0,95).
D E b a a b a a C b a B A
31
4. Discussion
In this work we found that microclimate, measure through a continuous and integrated variable, the Potential Solar Radiation (PSR), was the most important factor for the natural regeneration of Holm Oak woodlands in drylands at the local scale. Most abiotic factors are site-specific throughout the landscape and even change from one spatial level to another. Temperature, rainfall, irradiance, soil water content, etc., present on a gradient as a result of micro-scale variations in slope, altitude, or orientation, may also affect plants at a landscape scale (Jacquemun et al., 2003; Ramirez et al. 2006). Microclimate has in general been considered an important variable explaining the rate of natural regeneration of trees (Oliet and Jacobs, 2007). However most of the works about microclimate and tree natural regeneration refer the effect of forest on regeneration related with the microclimate changing especially below the canopy (Parrotta et al., 1997; Collet, 1998; Sabaté et al., 2002). Only few works study the long-term influence of the topographical microclimate in the regeneration process (Carmel and Kadmon, 1999; Dyer, 2009). On the other hand, several of the previous studies concerning the rate of forest regeneration have been addressed at the landscape or regional level (Aaviksoo, 1993; Carmel and Kadmon, 1999, Pons and Pausas, 2006; Kouba et al., 2012). Carmel and Kadmon (1999) recognize the importance of topography (slope and aspect) in the rate of forest regeneration in areas with different grazing pressures. Dyer (2009) and Puerta-Piñero et al. (2012) used topography as proxy of soil moisture and summer drought, respectively. In Puerta-Piñero et al. (2012) irradiance was identified as the most important abiotic factor for Q.ilex seedlings. However these studies did not quantify the microclimate influence at long-term (> 60 years) along the secondary succession and not in a continuous radiation gradient.
In this work we were able to build a model based on few variables for prediction of the rate of natural regeneration of Holm Oak under Mediterranean climatic conditions. Model A, based in three variables (PSR, time after abandonment and standard deviation of precipitation), had the best overall explanation of the data variability. However model B being based on only two variables is easier to apply to make future predictions. The few number of variables needed and the easiness to obtain them is the main advantage of this model. Nevertheless, this model can continuously be enhanced with space and
32
time data making it more reliable. As it was expected, the period of agriculture abandonment had a positive influence on the rate of tree regeneration as it was shown for other authors for oak species (Bonet, 2004; Kouba et al., 2012). On those works time was the main variable explaining the natural regeneration process of oak that increased its cover rate with time. Our work showed that microclimate measured through PSR was also a main driver guiding the spatial pattern of the rate of regeneration of Holm Oak in the region.
One of the innovations of this work is the use of PSR as a surrogate of microclimate conditions caused by topography applied to Holm Oak regeneration along the time and space. It is extremely difficult to have an integrated measure of microclimate over time. Some authors use a series of micro sensors to measure temperature, relative humidity, radiation, etc (Dyer, 2009). This is expensive, time consuming and with the inter-annual variability of the climate it would take long time to fully characterize especially when we are dealing with long-term studies (more than 30 years). Recently microclimate conditions have been measured using PSR as a proxy (González-Tagle et al.; 2008; Pinho et al., 2010). PSR is extremely easy to obtain and to use through GIS, once we have the digital terrain model. To our knowledge this has never been applied to evaluate the impact of microclimate on the regeneration of Holm Oak woodlands under Mediterranean climate. Moreover, this variable, PSR, can be continuous measured over space and represent the pre-existent conditions before the starting of the regeneration process. Puerta-Piñero et al. (2012) find that of the abiotic factors, irradiance appears to be the determinant driver constraining recruitment, and seems to have significant negative effects on Q.ilex recruitment, however their work only run for two years. This latter work also showed that there is heterogeneity at the landscape level, with more recruitment in patches with low irradiance, as previously mentioned at smaller spatial levels in other studies (Ramirez et al., 2006; Lehouck et al., 2009).
Holm Oak acorns are dispersed by gravity and through a set of biological vectors, primarily by birds and rodents (Gomez, 2003; Munoz and Bonal, 2007; Gomez et al. 2008). According with Puerta-Piñero et al. (2012) oak recruitment is affected not only by interactions with animals but also by landscape traits. In ecosystems highly limited by water availability the relative importance of microclimate increases (Davies-Colley
33 et al. 2000). With more aridity, water becomes a limiting factor and these conditions are
even more accentuated in the sites with higher PSR. The lack of water together with high temperatures and low relative humidity in sites with high PSR reduce the probability of germination and successful establishment of trees (Gómez, 2004, Puerta-Piñero et al., 2012). Shaw et al. (1968) reported that northern slopes, in North hemisphere, were the most favorable for fast Holm Oak establishment due to increasing rainfall and humidity. This fact could help to explain why after 20% of tree cover, the rate of regeneration in the slope with lower PSR increases. Trees were firstly established in sites with lower PSR. At this point, microclimatic conditions between North and South slopes become even more extreme, due to the effect of forest on microclimatic conditions on the regeneration of other new trees. The first tree layer will further increase shadow and humidity and will decrease the air and soil temperature in sites with low PSR (Oliet and Jacobs, 2007). The natural regeneration is a facilitation process, enhanced by successive facilitation steps (Plieninger et al., 2004). It starts with two main events: i) the probability of seeds to reach safe sites and ii) the probability of occurring favorable abiotic factors that allow seed germination and seedling survival (e.g. rainfall, temperature or drought events). During the first years of growth, Holm Oak saplings survival is dependent on abiotic factors until the deep root system is developed, particularly during the first dry season (Gómez, 2004; Benayas, 1997). The first trees are then facilitating the process of germination and growth of new Holm Oaks. For example, irradiance reduction and shadow effects around the established Holm Oaks enhance germination, sampling survival and resprouting of new trees, as it was shown by other authors (Benayas et al., 2005, Puerta-Piñero et al. 2012). Additionally, Holm Oak trees create microhabitats attractive to the main vectors of Holm Oak dispersal; birds and rodents which could increase the amount of available Holm Oak seeds (Benayas et al., 2005). This could happen together with the fact that Holm Oak trees make resprouting and once some trees are established it enhance this process, which may have more success than germination. The tree cover of the sites with higher PSR never reached more than 20% whereas the others in the sites with lower PSR reached 92% cover. Ramírez and Díaz (2008) found that natural regeneration of Holm Oak trees covered less than 40%, 50 years after abandonment. This result is in accordance to the results found in our work having in mind that the place where this work was performed (Toledo, Spain) had a precipitation of
34
approximately 508 mm, much lower than the one found in our work. Our results suggest that the natural regeneration of Holm Oak in the sites with highest PSR are still ongoing, since only recently (approximately at 15 years ago, in 1995) started to have some trees. This together with the fact that no saturation or plateau was observed in the rate of regeneration of trees located in the sites with higher PSR lead us to think that regeneration is just starting and will be a long-term process. This suggests that colonization is a slow process that may take several decades, and in some areas colonization rarely occurred. The higher variability observed in the prediction of the model for values of Holm Oak cover higher than 20% might be related with the few data that is available for longer periods of regeneration. Other factors, not measured in this study might become more important after the first stages of regeneration increasing its variability of responses.
Leaves of the trees growing in these two extreme situations, showed different ecophysiological performances; being performing better in sites with lower PSR. They invested more in protective structures which turns SLW higher. This investment made these trees grow slowly but adapted to this extreme conditions. Leafs of the Holm Oak located in sites with the highest PSR are submitted to some kind of stress as was demonstrated by the differences observed in the ecophysiological performance of the indicators measured. Trees exposed to the highest PSR levels had drought adaptations and evidenced stress signs. Leaves collected in these sites didn’t respond to light with the same efficiency as the ones located in the lowest PSR sites. They developed a protective adaptation (Chaves et al., 2002), with less response to light but with higher adaptation to drought such as the increase in the SLW associated with sclerophylly.
Lichen diversity is known to respond to microclimatic conditions even to the North and South face of a tree. In fact an observation made using lichen functional diversity in the extremes of the gradient confirms the existence of microclimate differences between the two extremes (Giulia Gaiola, Personal communication). Moreover this variable also showed to be related with lichen functional groups that respond to microclimate as shown in Pinho el al. (2010).
Despite the fact this study was performed only at the local scale of analysis, we assume that it will be valid for other sites with land abandonment that might occur in drylands
35
with similar soil types, climate and land-use. Photointerpretation is a subjective method associated to photographs and limitations as distortion, lower resolution or illumination problems as might introduce some errors to this analysis. Moreover, the long intervals (10 years, approximately) between photographs could bring interpretation problems. Young Holm Oaks could not be identified in aerial photos due to small canopy size. This may lead to underestimation of the percentage cover of Holm Oak in the first years after abandonment.
5. Implications for management and restoration
Climate change is one of the major challenges for forestry in the Mediterranean area. In these areas we are expecting higher temperatures and lower and more erratic rainfall events (Dios et al. 2007). Those will decrease the rate of regeneration and growing conditions of Holm Oak trees. The susceptibility to desertification increased in the last decades. The vegetation including Holm Oaks will need to survive in drier conditions. However, Q. ilex is the species that is naturally adapted to these areas and to possible future more arid conditions. Thus, it will be the best tree species to be used in reforestation programs in the region. In this work, we were able to produce models and predict the natural regeneration of trees which might be used by decision makers of the region such as Herdade da Contenda where the work was developed. The fact that, Holm Oak trees is the potential vegetation for this region increases the importance of this study for the forest management of similar areas. Holm Oak restoration has been one of strategies used in Mediterranean region to mitigate desertification and adapt to climate change, due to its resistance to the dry climatic conditions of inland Alentejo. In drylands is common to have unsuccessful reforestation programs due to severe drought during the years after the plantation. The use of this model or an improved version can help to reduce economic losses from reforestation efforts in areas where this tree has low probability of surviving. Moreover, some of the areas are quite favorable for natural regeneration whereas others are not. Decision makers may decide not to reforestate areas that are easier to natural regenerate whereas other tools might be used in areas that need more effort from technicians to allow trees to survive (tree shelters or watering in dry years). The model developed in this work is a first approach to increase the
36
economic efficiency of the restoration process in the inland Alentejo. Modeling the rate of natural regeneration gains importance for forest management and adaptation measures to face the future climate change and agriculture abandonment scenarios. Overall, the knowledge generated with this work could contribute for mitigate desertification and land degradation that is already occurring in the region. Being a long-term retrospective study this work makes a strong contribution for the LTER-Montado (http://www.lterportugal.net).
37
Acknowledgements
À professora Cristina Branquinho, que me deixou dar os primeiros passos na aventura da investigação pela sua mão. Depois deste ano há muitas frases que foram ditas sobre o processo de investigação em ecologia que vou continuar a citar.
À professora Otília Correia por ter estado sempre disponível aos pedidos e dúvidas.
Ao Pedro Pinho por ter estado sempre disponível a responder a todos os emails com assunto ―ArcGis‖ e máxima prontidão. À Alice Nunes pelas sugestões preciosas, principalmente na recta final.
Agradeço pelas portas que se abriram na AFN graças ao Eng. Lúcio do Rosário e da Juliana Monteiro, que foram uns guias imprescindíveis na orientação da procura de informação.
Aos trabalhadores da Herdade da Contenda sempre disponíveis a ajudar no que foi preciso. Obrigada aos que encheram o almoço das 12:30 e o lanche das 17:00 com companhia, boa disposição e descontracção.
Há ―equipa‖ de revisores: Francisco M., Renata M., Sofia G., João F., Susana F. e Margarida C.
À la resistance da Leite Vasconcelos: Beatriz, pelas filosofias e Videira, pelos grandes momentos.
À minha família um muito Obrigada por tudo!
Este trabalho foi financiado por: FCT-MEC (PTDC/AAC-CLI/104913/2008, SFRH/BPD/75425/2010)