Linear associations among phenological, morphological,
productive, and energetic-nutritional traits in corn
Bruna Mendonça Alves(1), Alberto Cargnelutti Filho(1), Cláudia Burin(1) and Marcos Toebe(2)
(1)Universidade Federal de Santa Maria, Centro de Ciências Rurais, Departamento de Fitotecnia, Avenida Roraima, no 1.000, Cidade
Universitária, Camobi, CEP 97105-900 Santa Maria, RS, Brazil. E-mail: [email protected], [email protected], [email protected] (2)Universidade Federal do Pampa, Rua Luiz Joaquim de Sá Britto, s/no, Promorar, CEP 97650-000 Itaqui, RS, Brazil. E-mail: [email protected]
Abstract – The objective of this work was to verify if there is linear dependence between the phenological, morphological, and productive traits and the energetic-nutritional ones in early maturing and super-early maturing corn genotypes. A total of 36 early maturing and 22 super-early maturing corn genotypes were evaluated in a randomized complete block design with three replicates, and the phenological, morphological, productive, and energetic-nutritional traits were measured. The matrix of phenotypic correlation coefficients among traits was determined; the multicollinearity diagnosis was carried out within each group of traits; and the canonical correlation analysis was performed. Linear dependence was observed between the groups of phenological, morphological, and productive traits and of the energetic-nutritional ones. In early maturing genotypes, significant canonical correlation shows the existence of linear dependence between the morphological and energetic-nutritional traits. The significant canonical pair shows that taller plants have lower amylose contents in the grains and reduced nitrogen-corrected apparent metabolizable energy. In super-early maturing genotypes, significant canonical correlations of the phenological, morphological, and productive traits with the energetic-nutritional ones indicate that a greater number of days from sowing to female flowering and ear insertion height, as well as a lower number of ears, increase ether extract contents in the grains.
Index terms: Zea mays, chemical composition, multivariate analysis.
Associações lineares entre caracteres fenológicos, morfológicos,
produtivos e nutricionais energéticos em milho
Resumo – O objetivo deste trabalho foi verificar se há dependência linear entre caracteres fenológicos, morfológicos e produtivos e os nutricionais energéticos, em genótipos de milho de ciclo precoce e superprecoce. Foram avaliados 36 genótipos de milho de ciclo precoce e 22 de ciclo superprecoce, em delineamento de blocos ao acaso, com três repetições, tendo-se mensurado caracteres fenológicos, morfológicos, produtivos e nutricionais energéticos. Foi determinada a matriz de coeficientes de correlação fenotípica entre os caracteres; realizado o diagnóstico de multicolinearidade em cada grupo de caracteres; e feita a análise de correlação canônica. Observou-se dependência linear entre os grupos de caracteres fenológicos, morfológicos e produtivos e os de caracteres nutricionais energéticos. Em genótipos de ciclo precoce, a correlação canônica significativa mostra a existência de dependência linear entre os caracteres morfológicos e os nutricionais energéticos. O par canônico significativo mostra que plantas mais altas apresentam menor teor de amilose nos grãos e redução da energia metabolizável aparente corrigida para nitrogênio. Em genótipos de ciclo superprecoce, as correlações canônicas significativas dos caracteres fenológicos, morfológicos e produtivos com os nutricionais energéticos indicam que os aumentos no número de dias da semeadura até o florescimento feminino e na altura de inserção da espiga, bem como a redução no número de espigas, proporcionam maior teor de extrato etéreo nos grãos.
Termos para indexação: Zea mays, composição química, análise multivariada.
Introduction
Corn (Zea mays L.) is the most used energetic ingredient in animal diets, with 80% of the total production in Brazil being directed for this purpose
and supplying the correct balance of nutrients in the animal diet (Silva et al.,2008).
Corn grain is widely used in human and animal diets, being the major ingredient in the latter due to its high energy content. Therefore, variations in the energetic composition of corn grain may, for example, significantly affect the profitability of swine production, since it directly affects feed conversion (Dozier et al., 2011). For this reason, studies on the chemical and energetic characterization of corn have been performed to assess the performance of swine (Li et al., 2014), broilers, and laying hens (Moore et al., 2008).
Among the energetic constituents present in the corn grain, the apparent metabolizable energy is the best way to describe the real energy available in feeds. Although apparent metabolizable energy is not a nutrient itself, it corresponds to the energy produced when nutrients are oxidized in the metabolism, aiming for the best animal performance. Other sources of energy in grains include: ether extract, which is known as crude fat and is located in the germ of the corn kernel; and starch, which is one of the main individual components present in the corn grain and a primary source of energy, since it is a carbohydrate reserve constituted by amylose and amylopectin (Li et al., 2008; Idikut et al., 2009). Amylose and amylopectin contents in grains determine starch digestibility and rate of degradation, showing that grains with lower amylose contents have greater digestibility. These contents may be evaluated through indirect methods, such as near-infrared reflectance spectroscopy (NIRS), which, according to Dale et al. (2010), is a quick and accurate non-destructive technique that preserves the integrity of the samples.
In plant breeding programs, the nutritional characterization of grains is essential, especially when determining crosses with improved genetic traits for use in animal feeds, in order to obtain better efficiency and minimize production costs. This shows that the study of the phenological, morphological, productive, and energetic-nutritional traits of corn is important for the early identification of traits, including those in the field, which are indicative of grain nutritional quality.
The knowledge of the association between the phenological, morphological, productive, and energetic-nutritional traits in early maturing and super-early maturing corn genotypes allows assessing
linear dependence among traits and the magnitude of the association. Another way to evaluate the association between two groups of traits is by the canonical correlation analysis, which is performed in a multidimensional way, so that the correlation between these combinations is maximized (Cruz & Carneiro, 2006).
The canonical correlation analysis is a multivariate technique used in exploratory studies to describe the association between groups of traits (X and Y). In this technique, each pair of canonical variables defines a canonical function, and the number of canonical functions that can be obtained is equal to the number of traits of the smallest group. For example, if the smallest group comprises three traits, the number of canonical functions is three, with the first canonical pair presenting the greatest existing correlation among the groups of traits (Hair Jr. et al.,2009).
There are several known studies on the associations among corn traits (Malik et al., 2005; Moore et al., 2008; Moradi & Azarpour, 2011; Li et al., 2014; Nataraj et al., 2014). However, researches on the association of the groups of phenological, morphological, and productive traits with those of energetic-nutritional ones by canonical correlations are practically nonexistent.
The objective of this work was to verify if there is linear dependence among the phenological, morphological, and productive traits and the energetic-nutritional ones in early maturing and super-early maturing corn genotypes.
Materials and Methods
The data used were originated from two experiments with corn, carried out during the 2009/2010 agricultural year, in the experimental area of the Department of Plant Sciences of Universidade Federal de Santa Maria, in the state of Rio Grande do Sul, Brazil (29º42'S, 53º49'W, at an altitude of 95 m). One experiment was composed of 36 early maturing corn genotypes and the other one of 22 super-early maturing corn genotypes. The assessed genotypes belong to the network for the evaluation of corn genotypes of the state of Rio Grande do Sul, Brazil, coordinated by Fundação Estadual de Pesquisa Agropecuária.
CO 327, CO 388, DKB 245, Dx 510, 2B655, 2B688, PMS 0219A54, FTH 404, FTH 900, CEP M 128, CEP M 130, CEP M 143, GNZ 2005, GNZ 2728, GNZX 0744, KSP 1356, KSP 3246, BX 945, BG7060, P 30B39, SHX 5121, SHX 7222, SHX 7323, XB 6012, XBX 70202, AG 8025, AG 9040, P 30R50, AG 5011, and AG 2020. The commercial names of the 22 super-early maturing corn genotypes evaluated were: BM 911, Dx 915, 2B433, PMS 3919, PMS 1635A08, FTH 960, GNZ 0729, GNZ 9505, BX 898, HS 79707, PRE 12S12, PRE 22D11, PRE 22S11, PRE 22T10, RBX 79, SHS 7090, SHX 7111, AG 9045, BALU 7690, SG 6302, AG 9020, and BG7060. The complete description of all these genotypes has already been presented by Alves et al. (2015).
In both experiments, the experimental design was a randomized complete block with three replicates. The experimental units were composed of two 5-m length rows, spaced at 0.80 m between rows and at 0.20 m between plants in the row. The sowing procedure was carried out manually on 10/26/2009, with base fertilization of 37.5 kg ha-1 N, 150 kg ha-1 P
2O5, and
150 kg ha-1 K
2O. Plant emergence occurred between
11/1/2009 and 11/3/2009, and the population was adjusted by thinning to 62,500 plants per hectare. For topdressing fertilization, 200 kg ha-1 N were split in
three applications, when the plants presented three, five, and ten leaves.
The phenological and morphological traits were measured in every genotype in every experimental unit in the field. The obtained phenological traits were: number of days from sowing until male flowering (MF) and number of days from sowing until female flowering (FF), when 50% of the plants of the plot showed male and female flowering, respectively. The morphological traits determined in all plants of the plot were: plant height at harvest (PH), in centimeters; ear insertion height at harvest (EH), in centimeters; and relative ear placement (EP=EH/PH). The harvest of corn ears was carried out on 3/15/2010, and, simultaneously, the following productive traits were measured: number of plants (NP) per hectare; number of ears (NE) per hectare; ear index (EI=NE/NP); ear weight (EW), in Mg ha-1; grain yield (GY) at 13% humidity, in Mg ha-1;
and 1,000-grain weight (TGW), in grams.
Afterwards, 500-g corn grain samples from each plot were separated and stored in a paper bag, then taken to a forced-air circulation oven until 10% humidity.
After drying, the grains were ground in a MA-630 micro-mill (Marconi Equipamentos Para Laboratórios Ltda., Piracicaba, SP, Brazil), in order to obtain a sample with granulometry between 0.30 and 0.50 mm. Each ground sample was stored in a hermetically-closed package until the moment of grain nutritional analyses. These samples were used to determine the following energetic-nutritional traits: nitrogen-corrected apparent metabolizable energy (AMEn), in kcal kg-1; as well as ether extract (EE), starch (ST),
and amylose (AML), all in raw matter percentage. The quantification of EE, ST, and AMEn concentrations was performed using NIRS with analytical calibration, CEAN 010, (Adisseo Brasil Nutrição Animal Ltda., São Paulo, SP, Brazil). AML concentration was determined by iodometry, according to Martinez & Cuevas (1989), with the dissolution, gelatinization, acidification, and addition of iodine solution, which forms a complex with the starch, and was measured using a spectrophotometer at 620 nm.
The assumptions of the mathematical model were tested in each group of traits. The normality of errors was checked through the Kolmogorov-Smirnov test (Campos, 1983), and the homogeneity of residual variances by Bartlett’s test (Steel et al., 1997). In addition, selective accuracy (SA) was estimated by the equation SA = (1-(1/Fc))0.5, in which Fc is the F-test
value, used to evaluate the experimental accuracy, in alignment with the limits recommended by Resende & Duarte (2007). SA can alternatively be obtained by the square root of heritability and is considered: very high, when SA ≥0.90; high, when 0.70≤ SA <0.90; moderate, when 0.50≤ SA <0.70; and low, when SA <0.50. Moreover, the analysis of variance was carried out at 5% probability, and the phenotypic correlation coefficients (r) were estimated among 15 traits. The significance of r was also verified through Student’s t-test, at 5% probability, for the experiments with early and super-early maturing corn genotypes. Subsequently, the diagnosis of multicollinearity was made within each group of traits (phenological, morphological, productive, and energetic-nutritional) for both experiments.
matrix, and it was used as a decision criterion, according to the classification proposed by Montgomery & Peck (1982) and described by Cruz & Carneiro (2006): if CN ≤100, there is a weak multicollinearity among traits; if 100< CN <1,000, a moderate to strong one; and if CN ≥1,000, a severe one. In the case of a moderate to strong or severe multicollinearity, it is necessary to eliminate highly correlated traits. The VIF represents how the coefficient of variation (CV) is inflated compared with what it would be if it was not correlated with any other trait of the model. VIF values lower than 10 are considered appropriate, indicating the absence of multicollinearity, whereas those above 10 show a high collinearity degree among traits (Kutner et al.,2005).
Next, the canonical correlation analysis was performed for the early and super-early maturing corn genotypes. The groups of traits were correlated as follows: phenological (MF and FF) and energetic-nutritional (AMEn, EE, ST, and AML); morphological (PH and EH) and energetic-nutritional (AMEn, EE, ST, and AML); and productive (NP, NE, GY, and TGW) and energetic-nutritional (AMEn, EE, ST, and AML). The association measurements among the groups of traits were presented through canonical pairs, followed by their canonical coefficients. To evaluate the significance of the canonical associations, a chi-square statistical test was used, at 5% probability (Cruz & Carneiro, 2006). The statistical analyzes were carried out using the Genes software (Universidade Federal de Viçosa, Viçosa, MG, Brazil) and Microsoft Office Excel.
Results and Discussion
The normality of errors checked through the Kolmogorov-Smirnov test showed that all measured traits had normal distribution in early maturing genotypes. In super-early maturing ones, only the trait NP did not have a normal distribution. It should be noted that in 10 and 13 of the 15 traits measured in early maturing and super-early maturing genotypes, respectively, the residual variances were homogeneous according to Bartlett’s chi-square test (Tables 1 and 2), confirming the obtained results.
The analysis of variance of the phenological, morphological, productive, and energetic-nutritional traits revealed genetic variability between early maturing and super-early maturing genotypes
(Table 1). This type of study is of utmost importance, because the wide variability found among these traits enables the identification of those that are promising for corn genetic breeding programs through indirect selection. Given this variability, it may be inferred that these genotypes can be used in the process of selecting appropriate crosses between divergent genotypes.
The average values for each trait evaluated in the present study, compared with those found in the literature, are indicative of significant variability (Alves et al., 2014, 2015). The existence of variability is a plant breeding premise and creates the possibility of crosses between individuals through plant breeding strategies, in order to obtain improvements in energy nutritional quality without compromising grain yield.
Overall, the CV in the two experiments was low, indicating high experimental precision. Only the productive traits EW and GY showed medium CV values in both experiments (Tables 1 and 2). According to the precision statistics, the SA, Fc, and CV statistical tests confirmed the good experimental precision of the experiments. However, Cargnelutti Filho & Storck (2009), while studying corn, found that SA and Fc were the most adequate statistical tests for the inference of precision of the experiments.
The multicollinearity diagnostics, inferred from the phenotypic correlation matrix in each group of traits, showed a CN less than 100 and a VIF less than 10, indicating a weak multicollinearity for the phenological traits in the early maturing and super-early maturing genotypes. For both genotypes, the morphological traits showed high multicollinearity, whereas the trait EP had to be removed because it was highly correlated with EH. Regarding productive traits, EI and EW were excluded, since they showed multicollinearity problems. In contrast, the removal of traits in the energetic-nutritional group was not required.
phenotypic correlation ranged from r = -0.873 between FF and EI to r = 0.991 between EW and GY. From these estimates, it was concluded that there are traits in corn that show linear dependence and that may be used in indirect selection.
The results obtained in the present study suggest that, in early maturing genotypes, MF and FF are negatively correlated with traits from the productive group, i.e., NP, NE, EI, EW, and GY; the exception is TGW, which showed no correlation. In super-early maturing genotypes, MF and FF are negatively correlated with the productive traits NE, EI, EW, GY, and TGW; the exception is NP, which showed a slight positive correlation with MF (r = 0.149) and no correlation with FF (r = 0.024) (Table 3). These results are in agreement with those of Malik et al. (2005), Bekele & Rao (2014), and Ullah et al. (2016). The early maturing and super-early maturing genotypes showed a positive correlation between TGW and GY (r = 0.370 and r = 0.346, respectively). Prakash et al. (2006), Begum et al. (2016), Nardino et al. (2016), and Ullah et
al. (2016) also reported positive correlations between these traits.
The correlation between GY and ST was of r = -0.141 in the early maturing genotypes and of r = 0.029 in the super-early maturing genotypes (Table 3). These results are in alignment with those observed by Prakash et al. (2006), but differ from those of Idikut et al. (2009), who found a positive and nonsignificant correlation of r = 0.486. GY showed a positive correlation with TGW and EW in early maturing and super-early maturing genotypes (Table 3). These results are similar to those reported by Ghimire & Timsina (2015). EW showed a positive correlation of r = 0.993 and r = 0.991 with GY for early maturing and super-early maturing genotypes, respectively, corroborating the results of Mhoswa et al. (2016) and Ghimire & Timsina (2015).
In early maturing genotypes, the correlations between MF and EE and between FF and EE were of r = 0.234 and r = 0.314, respectively. In super-early maturing genotypes, the correlation between MF and EE was of r = 0.617, and between FF and EE of r = 0.674 (Table 3). However, a positive correlation with
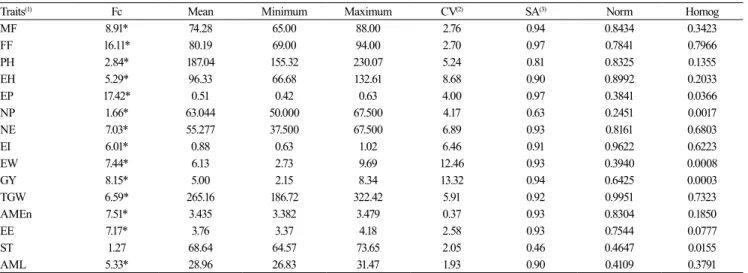
Table 1. F-test value (Fc) of the analysis of variance for genotype effect, p-value of the Kolmogorov-Smirnov test for normality of error distribution (Norm), and p-value of Bartlett’s chi-square test for homogeneity of residual variances (Homog) for the phenological, morphological, productive, and energetic-nutritional traits of 36 early maturing corn (Zea mays) genotypes in the agricultural year of 2009/2010.
Traits(1) Fc Mean Minimum Maximum CV(2) SA(3) Norm Homog
MF 8.91* 74.28 65.00 88.00 2.76 0.94 0.8434 0.3423
FF 16.11* 80.19 69.00 94.00 2.70 0.97 0.7841 0.7966
PH 2.84* 187.04 155.32 230.07 5.24 0.81 0.8325 0.1355
EH 5.29* 96.33 66.68 132.61 8.68 0.90 0.8992 0.2033
EP 17.42* 0.51 0.42 0.63 4.00 0.97 0.3841 0.0366
NP 1.66* 63.044 50.000 67.500 4.17 0.63 0.2451 0.0017
NE 7.03* 55.277 37.500 67.500 6.89 0.93 0.8161 0.6803
EI 6.01* 0.88 0.63 1.02 6.46 0.91 0.9622 0.6223
EW 7.44* 6.13 2.73 9.69 12.46 0.93 0.3940 0.0008
GY 8.15* 5.00 2.15 8.34 13.32 0.94 0.6425 0.0003
TGW 6.59* 265.16 186.72 322.42 5.91 0.92 0.9951 0.7323
AMEn 7.51* 3.435 3.382 3.479 0.37 0.93 0.8304 0.1850
EE 7.17* 3.76 3.37 4.18 2.58 0.93 0.7544 0.0777
ST 1.27 68.64 64.57 73.65 2.05 0.46 0.4647 0.0155
AML 5.33* 28.96 26.83 31.47 1.93 0.90 0.4109 0.3791
Table 2. F-test value (Fc) of the analysis of variance for genotype effect, p-value of the Kolmogorov-Smirnov test for normality of error distribution (Norm), and p-value of Bartlett’s chi-square test for homogeneity of residual variances (Homog) for the phenological, morphological, productive, and energetic-nutritional traits of 22 super-early maturing corn (Zea mays) genotypes in the agricultural year of 2009/2010.
Traits(1) Fc Mean Minimum Maximum CV(2) SA(3) Norm Homog
MF 13.63* 72.12 66.00 82.00 2.17 0.96 0.0682 0.9001
FF 24.52* 77.18 69.00 87.00 2.14 0.98 0.5338 0.8676
PH 5.82* 202.27 178.15 223.51 3.33 0.91 0.8691 0.2538
EH 13.33* 104.97 80.08 127.20 4.77 0.96 0.8202 0.5512
EP 33.62* 0.52 0.43 0.59 2.34 0.99 0.6099 0.6195
NP 2.27* 62.632 58.750 66.250 1.86 0.75 0.0055 0.1988
NE 6.06* 58.522 42.500 65.000 4.72 0.91 0.8920 0.1282
EI 5.36* 0.93 0.68 1.02 4.85 0.90 0.7959 0.0244
EW 6.87* 7.27 3.97 9.89 10.32 0.92 0.7668 0.9624
GY 8.98* 5.92 3.09 8.23 10.64 0.94 0.6643 0.9375
TGW 3.28* 268.51 212.37 341.91 7.51 0.83 0.9942 0.2278
AMEn 20.75* 3.416 3.332 3.473 0.29 0.98 0.9793 0.3741
EE 12.70* 3.72 3.21 4.09 2.69 0.96 0.3952 0.0155
ST 2.62* 68.92 65.75 72.22 1.63 0.79 0.7942 0.3676
AML 6.90* 28.61 26.04 30.68 2.15 0.92 0.8725 0.3511
(1)Phenological: MF, number of days from sowing until male flowering; and FF, number of days from sowing until female flowering. Morphological: PH, plant height, in centimeters; EH, ear insertion height, in centimeters; and EP, ear placement (EP = EH/PH). Productive: NP, number of plants per hectare; NE, number of ears per hectare; EI, ear index; EW, ear weight, in Mg ha-1; GY, grain yield, in Mg ha-1; and TGW, 1,000-grain weight, in grams. Energetic-nutritional: AMEn, nitrogen-corrected apparent metabolizable energy, in kcal kg-1; EE, ether extract, in raw matter percentage (%RM); ST, starch, in %RM; and AML, amylose, in %RM. *Significant difference by the F-test, at 5% probability. (2)CV, coefficient of variation. (3)SA, selective accuracy, whose class limits were established by Resende & Duarte (2007) as: very high, when SA ≥0.90; high, when 0.70≤ SA <0.90; moderate, when 0.50≤ SA <0.70; and low, when SA <0.50.
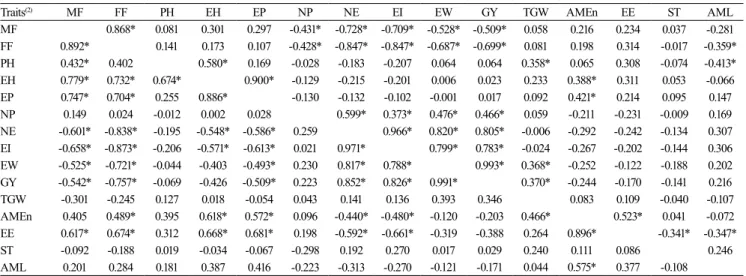
Table 3. Estimates of the phenotypic(1) correlation coefficients among the phenological, morphological, productive, and
energetic-nutritional traits of 36 early maturing corn (Zea mays) genotypes (above diagonal) and 22 super-early maturing corn genotypes (below diagonal) in the agricultural year of 2009/2010.
Traits(2) MF FF PH EH EP NP NE EI EW GY TGW AMEn EE ST AML
MF 0.868* 0.081 0.301 0.297 -0.431* -0.728* -0.709* -0.528* -0.509* 0.058 0.216 0.234 0.037 -0.281 FF 0.892* 0.141 0.173 0.107 -0.428* -0.847* -0.847* -0.687* -0.699* 0.081 0.198 0.314 -0.017 -0.359* PH 0.432* 0.402 0.580* 0.169 -0.028 -0.183 -0.207 0.064 0.064 0.358* 0.065 0.308 -0.074 -0.413* EH 0.779* 0.732* 0.674* 0.900* -0.129 -0.215 -0.201 0.006 0.023 0.233 0.388* 0.311 0.053 -0.066 EP 0.747* 0.704* 0.255 0.886* -0.130 -0.132 -0.102 -0.001 0.017 0.092 0.421* 0.214 0.095 0.147 NP 0.149 0.024 -0.012 0.002 0.028 0.599* 0.373* 0.476* 0.466* 0.059 -0.211 -0.231 -0.009 0.169 NE -0.601* -0.838* -0.195 -0.548* -0.586* 0.259 0.966* 0.820* 0.805* -0.006 -0.292 -0.242 -0.134 0.307 EI -0.658* -0.873* -0.206 -0.571* -0.613* 0.021 0.971* 0.799* 0.783* -0.024 -0.267 -0.202 -0.144 0.306 EW -0.525* -0.721* -0.044 -0.403 -0.493* 0.230 0.817* 0.788* 0.993* 0.368* -0.252 -0.122 -0.188 0.202 GY -0.542* -0.757* -0.069 -0.426 -0.509* 0.223 0.852* 0.826* 0.991* 0.370* -0.244 -0.170 -0.141 0.216 TGW -0.301 -0.245 0.127 0.018 -0.054 0.043 0.141 0.136 0.393 0.346 0.083 0.109 -0.040 -0.107 AMEn 0.405 0.489* 0.395 0.618* 0.572* 0.096 -0.440* -0.480* -0.120 -0.203 0.466* 0.523* 0.041 -0.072 EE 0.617* 0.674* 0.312 0.668* 0.681* 0.198 -0.592* -0.661* -0.319 -0.388 0.264 0.896* -0.341* -0.347* ST -0.092 -0.188 0.019 -0.034 -0.067 -0.298 0.192 0.270 0.017 0.029 0.240 0.111 0.086 0.246 AML 0.201 0.284 0.181 0.387 0.416 -0.223 -0.313 -0.270 -0.121 -0.171 0.044 0.575* 0.377 -0.108
low magnitude among these traits was also observed by Wali et al. (2006) and Chukwu et al. (2013). This shows that for early and super-early maturing corn genotypes, the greater the MF and FF, the greater will be the EE contents in the grains.
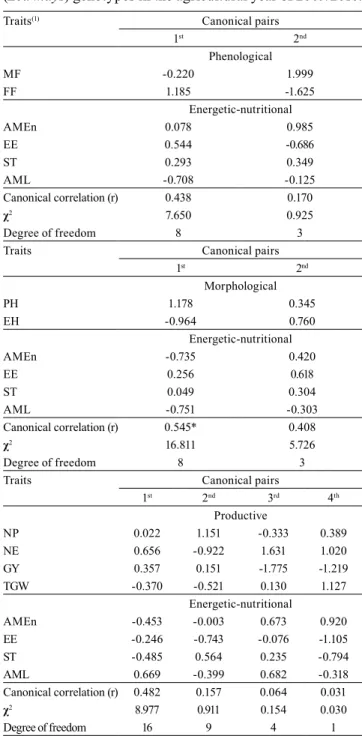
In early maturing genotypes, the correlation between the morphological and energetic-nutritional traits constitutes the first significant canonical pair (r = 0.545), at 5% probability (Table 4). The significant canonical pair showed that taller plants have lower amylose contents in the grains and reduced nitrogen-corrected apparent metabolizable energy. This suggests that it is possible to verify the morphological traits of early maturing genotypes that indicate energetic quality in corn grains. It was observed that the canonical correlations established by the chi-square test based on phenological versus energetic-nutritional traits and on productive versus energetic-nutritional traits were nonsignificant. Therefore, it can be inferred that the considered groups are independent, i.e., they do not show linear dependence among traits.
In super-early maturing genotypes, the phenological traits were associated with the energetic-nutritional ones in the first significant canonical pair (r = 0.779), at 5% probability (Table 5). The significant canonical pair showed that the greater the number of days from sowing until FF, the greater were the ether extract contents in the grains. Significant canonical correlation (r = 0.736) was observed between the morphological and energetic-nutritional traits only for the first canonical pair. In this case, the significant canonical pair indicates that plants with greater ear height have greater ether extract contents in the grains.
In contrast, the association between productive and energetic-nutritional traits contributed to two significant canonical pairs: the first with a canonical correlation of r = 0.900 and the second with a canonical correlation of r = 0.733 (Table 5). The first significant canonical pair showed that the lower the number of ears, the greater were the ether extract contents in the grains. The second significant canonical pair indicated greater nitrogen-corrected apparent metabolizable energy in corn grains with increasing TGW. The productive traits NE and TGW can be used for the orientation of corn breeding programs through indirect selection.
The canonical correlation analysis showed that morphological versus energetic-nutritional traits
Table 4. Correlations and canonical coefficients estimated between the phenological and energetic-nutritional, morphological and energetic-nutritional, and productive and energetic-nutritional traits of 36 early maturing corn (Zea mays) genotypes in the agricultural year of 2009/2010.
Traits(1) Canonical pairs
1st 2nd
Phenological
MF -0.220 1.999
FF 1.185 -1.625
Energetic-nutritional
AMEn 0.078 0.985
EE 0.544 -0.686
ST 0.293 0.349
AML -0.708 -0.125
Canonical correlation (r) 0.438 0.170
χ2 7.650 0.925
Degree of freedom 8 3
Traits Canonical pairs
1st 2nd
Morphological
PH 1.178 0.345
EH -0.964 0.760
Energetic-nutritional
AMEn -0.735 0.420
EE 0.256 0.618
ST 0.049 0.304
AML -0.751 -0.303
Canonical correlation (r) 0.545* 0.408
χ2 16.811 5.726
Degree of freedom 8 3
Traits Canonical pairs
1st 2nd 3rd 4th Productive
NP 0.022 1.151 -0.333 0.389
NE 0.656 -0.922 1.631 1.020
GY 0.357 0.151 -1.775 -1.219
TGW -0.370 -0.521 0.130 1.127
Energetic-nutritional
AMEn -0.453 -0.003 0.673 0.920
EE -0.246 -0.743 -0.076 -1.105
ST -0.485 0.564 0.235 -0.794
AML 0.669 -0.399 0.682 -0.318
Canonical correlation (r) 0.482 0.157 0.064 0.031
χ2 8.977 0.911 0.154 0.030
Degree of freedom 16 9 4 1
in early maturing genotypes, and phenological, morphological, and productive versus energetic-nutritional traits in super-early maturing genotypes are dependent, indicating linear relation among the traits studied. The existence of variability among genotypes and the use of phenotypic correlation allow inferring that it is possible to indirectly identify traits that are indicative of energetic-nutritional quality in corn grains, even in the field. This identification of traits is possible because the majority of the phenotypic correlation is genetic. These data are important in plant breeding programs that aim to identify plants with greater nutritional grain quality, focusing on animal nutrition.
Conclusions
1. In early maturing corn (Zea mays) genotypes, the significant canonical correlation shows the existence of linear dependence between the morphological and energetic-nutritional traits, whereas the significant canonical pair shows that taller plants have lower amylose contents in the grains and reduced nitrogen-corrected apparent metabolizable energy.
2. In super-early maturing corn genotypes, significant canonical correlations of the phenological, morphological, and productive traits with the energetic-nutritional ones show that a greater number of days from sowing to female flowering and ear insertion height, as well as a lower number of ears, increase ether extract contents in the grains.
Acknowledgments
To Conselho Nacional de Desenvolvimento Científico e Tecnológico (CNPq) and to Coordenação de Aperfeiçoamento de Pessoal de Nível Superior (Capes), for the scholarships granted to the authors; to Mr. Washington Neves from Adisseo Brasil Nutrição Animal Ltda., for kindly conducting the laboratory tests; and to student fellows and volunteers, for assisting in data collection.
References
ALVES, B.M.; CARGNELUTTI FILHO, A.; SILVA, L.P. da; TOEBE, M.; BURIN, C.; PRETTO, A. Genetic divergence of
corn cultivars in relation to grain productivity, crude protein
Table 5. Correlations and canonical coefficients estimated between the phenological and energetic-nutritional, morphological and energetic-nutritional, and productive and energetic-nutritional traits of 22 super-early maturing corn (Zea mays) genotypes in the agricultural year of 2009/2010. Traits(1) Canonical pairs
1st 2nd
Phenological
MF 0.194 2.203
FF 0.823 -2.052
Energetic-nutritional
AMEn -1.133 -1.816
EE 1.784 1.445
ST -0.217 0.724
AML 0.306 0.091
Canonical correlation (r) 0.779* 0.288
χ2 17.829 1.512
Degree of freedom 8 3
Traits Canonical pairs
1st 2nd
Morphological
PH -0.554 1.235
EH 1.286 -0.423
Energetic-nutritional
AMEn -0.765 2.691
EE 1.465 -1.864
ST -0.070 -0.109
AML 0.420 -0.695
Canonical correlation (r) 0.736* 0.371
χ2 16.233 2.596
Degree of freedom 8 3
Traits Canonical pairs
1st 2nd 3rd 4th Productive
NP 0.671 0.020 0.581 0.533
NE -1.392 0.123 -0.202 1.453
GY 0.622 -0.104 0.928 -1.798
TGW -0.016 1.016 -0.337 0.337
Energetic-nutritional
AMEn -0.260 2.495 1.053 -0.735
EE 1.126 -1.627 -1.066 0.990
ST -0.586 0.133 -0.748 0.393
AML -0.139 -0.781 -0.854 -0.704 Canonical correlation (r) 0.900* 0.733* 0.421 0.316
χ2 45.033 17.676 4.945 1.731
Degree of freedom 16 9 4 1
content and amino acid profile. African Journal of Agricultural Research, v.10, p.3134-3149, 2015. DOI: 10.5897/AJAR2015.9688.
ALVES, B.M.; CARGNELUTTI FILHO, A.; TOEBE, M.; BURIN, C.; SILVA, L.P. da. Variability of grain productivity and energy
profile of maize (Zea mays L.) genotypes. Journal of Cereal
Science, v.60, p.164-171, 2014. DOI: 10.1016/j.jcs.2014.02.007.
BEGUM, S.; AHMED, A.; OMY, S.H.; ROHMAN, M.M.; AMIRUZZAMAN, M. Genetic variability, character association
and path analysis in maize (Zea mays L.). Bangladesh Journal of Agricultural Research, v.41, p.173-182, 2016. DOI: 10.3329/bjar. v41i1.27682.
BEKELE, A.; RAO, T.N. Estimates of heritability, genetic
advance and correlation study for yield and it’s attributes in maize
(Zea mays L.). Journal of Plant Sciences, v.2, p.1-4, 2014. DOI:
10.11648/j.jps.20140201.11.
CAMPOS, H. de. Estatística experimental não-paramétrica.
Piracicaba: ESALQ, 1983. 349p.
CARGNELUTTI FILHO, A.; STORCK, L. Medidas do grau de precisão experimental em ensaios de competição de cultivares de
milho. Pesquisa Agropecuária Brasileira, v.44, p.111-117, 2009. DOI: 10.1590/s0100-204x2009000200001.
CHUKWU, S.C.; EKWU, L.G.; ONYISHI, G.C.; OKPORIE, E.O.; OBI, I.U. Correlation between agronomic and chemical
characteristics of maize (Zea mays L.) genotypes after two years of mass selection. International Journal of Science and Research, v.4, p.1708-1712, 2013.
CRUZ, C.D.; CARNEIRO, P.C.S. Modelos biométricos
aplicados ao melhoramento genético. 2.ed. Viçosa: Ed. da UFV,
2006. 585p.
DALE, L.M.; ROTAR, I.; VIDICAN, R.; MOREA, A.; MOGOS,
A. Determination of chemical composition of maize by destructive and non-destructive method. Bulletin of University of Agricultural Sciences and Veterinary Medicine Cluj-Napoca. Agriculture, v.67, p.68-73, 2010. DOI: 10.15835/ buasvmcn-agr:5014.
DOZIER, W.A.; GEHRING, C.K.; CORZO, A.; OLANREWAJU,
H.A. Apparent metabolizable energy needs of male and female broilers from 36 to 47 days of age. Poultry Science, v.90, p.804-814, 2011. DOI: 10.3382/ps.2010-01132.
GHIMIRE, B.; TIMSINA, D. Analysis of yield and yield
attributing traits of maize genotypes in Chitwan, Nepal. World
Journal of Agricultural Research, v.3, p.153-162, 2015. DOI: 10.12691/wjar-3-5-2.
HAIR JR., J.F.; BLACK, W.C.; BABIN, B.J.; ANDERSON, R.E.;
TATHAM, R.L. Análise multivariada de dados. 6. ed. São
Paulo: Bookman, 2009. 688p.
IDIKUT, L.; ATALAY, A.I.; KARA, S.N.; KAMALAK, A. Effect
of hybrid on starch, protein and yields of maize grain. Journal of Animal and Veterinary Advances, v.8, p.1945-1947, 2009.
KUTNER, M.H.; NACHTSHEIM, C.J.; NETER, J.; LI, W.
Applied linear statistical models. Boston: McGraw-Hill/Irwin, 2005. 1396p.
LI, L.; JIANG, H.; CAMPBELL, M.; BLANCO, M.; JANE,
J.-L. Characterization of maize amylose-extender (аe) mutant starches. Part I: relationship between resistant starch contents and molecular structures. Carbohydrate Polymers, v.74, p.396-404, 2008. DOI: 10.1016/j.carbpol.2008.03.012.
LI, Q.; ZANG, J.; LIU, D.; PIAO, X.; LAI, C.; LI, D. Predicting
corn digestible and metabolizable energy content from its chemical composition in growing pigs. Journal of Animal Science and Biotechnology, v.5, p.1-8, 2014. DOI: 10.1186/2049-1891-5-11.
MALIK, H.N.; MALIK, S.I.; HUSSAIN, M.; CHUGHTAI, S.U.R.; JAVED, H.I. Genetic correlation among various
quantitative characters in maize (Zea mays L.) hybrids. Journal of Agriculture and Social Sciences, v.1, p.262-265, 2005.
MARTINEZ, C.; CUEVAS, F. Evaluación de la calidad
culinaria y molinera del arroz. 3.ed. Cali: CIAT, 1989. 75p. (Serie 04SR-07.01).
MHOSWA, L.; DERERA, J.; QWABE, F.N.P.; MUSIMWA, T.R. Diversity and path coefficient analysis of Southern African maize
hybrids. Chilean Journal of Agricultural Research, v.76, p.143-151, 2016. DOI: 10.4067/S0718-58392016000200002.
MONTGOMERY, D.C.; PECK, E.A. Introduction to linear
regression analysis. New York: J. Wiley, 1982. 504p. (Wiley
Series in Probability and Mathematical Statistics).
MOORE, S.M.; STALDER, K.J.; BEITZ, D.C.; STAHL, C.H.; FITHIAN, W.A.; BREGENDAHL, K. The correlation of chemical
and physical corn kernel traits with production performance in broiler chickens and laying hens. Poultry Science, v.87, p.665-676, 2008. DOI: 10.3382/ps.2007-00184.
MORADI, M.; AZARPOUR, E. Determination of most important
part of yield components by path analysis in corn. Journal of American Science, v.7, p.646-650, 2011.
NARDINO, M.; SOUZA, V.Q. de.; BARETTA, D.; KONFLANZ, V.A.; CARVALHO, I.R.; FOLLMANN, D.N.; CARON, B.O.
Association of secondary traits with yield in maize F1’s. Ciência Rural, v.46, p.776-782, 2016. DOI: 10.1590/0103-8478cr20150253.
NATARAJ, V.; SHAHI, J.P.; AGARWAL, V. Correlation and path
analysis in certain inbred genotypes of maize (Zea mays L.) at
Varanasi. International Journal of Innovative Research and
Development, v.3, p.14-17, 2014.
OLIVEIRA, G.C. de; MOREIRA, I.; SOUZA, A.L.P. de; MURAKAMI, A.E.; PARRA, A.R.P.; CARVALHO, P.L. de O.; BORILE, M.D. Corns with different nutritional profiles
on growing and finishing pigs feeding (30 to 90 kg).
Asian-Australasian Journal of Animal Sciences, v.24, p.982-992, 2011. DOI: 10.5713/ajas.2011.90587.
PRAKASH, O.; SHANTHI, P.; SATYANARAYANA, E.;
KUMAR, R.S. Studies on inter relationship and path analysis for yield improvement in sweet corn genotypes (Zea mays L.). New Botanist, v.33, p.91-98, 2006.
RESENDE, M.D.V. de; DUARTE, J.B. Precisão e controle de
qualidade em experimentos de avaliação de cultivares. Pesquisa
Agropecuária Tropical, v.37, p.182-194, 2007.
de milhos de diferentes qualidades para frangos de corte. Revista Brasileira de Zootecnia, v.37, p.883-889, 2008. DOI: 10.1590/ S1516-35982008000500016.
STEEL, R.G.D.; TORRIE, J.H.; DICKEY, D.A. Principles and
procedures of statistics: a biometrical approach. 3rd ed. New
York: McGraw Hill Book Press, 1997. 666p.
ULLAH, I.; KHAN, S.A.; ALI, A.; KHAN, K.M.; ALI, N.; KHAN, A.; ALI, A.; KHAN, I.; KHAN, I.; RAZA, H.
Evaluation of maize genotypes for some quantitative traits in
the agro-climatic conditions of Swat Valley. International
Journal of Biosciences, v.8, p.77-81, 2016. DOI: 10.12692/ ijb/8.2.77-81.
WALI, M.C.; SALIMATH, P.M.; PRASHANTH, M.; HARLAPUR, S.I. Studies on character association as influenced
by yield, starch and oil in maize (Zea mays L.). Karnataka Journal of Agricultural Sciences, v.19, p.932-935, 2006.