1
Vol.61: e18160613, 2018
http://dx.doi.org/10.190/1678-4324-2018160613 ISSN 1678-4324 Online Edition
Biological and Applied Sciences
BRAZILIAN ARCHIVES OF BIOLOGY AND TECHNOLOGY
A N I N T E R N A T I O N A L J O U R N A L
SSR-Marker assisted evaluation of Genetic Diversity in
Mungbean (
Vigna radiata
(L.) Wilcezk) genotypes
Gunnjeet Kaur
1
, Arunabh Joshi
1
, Devendra Jain
1
*.
1Department of Molecular Biology and Biotechnology, Rajasthan College of Agriculture, MPUAT, Udaipur, India
ABSTRACT
Mungbean (Vigna radiata (L.) Wilczek) also known as green gram is an important source of protein in the category of food legumes. In the present study, SSR marker is used to analyze the genetic diversity amongst 23 genotypes of mungbean. Out of a total of 10 primers used for SSR analysis revealed generation of 15 alleles. The number of alleles per locus ranged from one (CEDG006, CEDG010, CEDG050, CEDG088, CEDG092 and CEDG232) to three (CEDG 214), with an average of 1.5 allele per primer. The index for expected heterozygosity was 0.29 ranging from 0.15 to 0.49 revealed a deficit in heterozygosity. The size of amplification products varied in case of each primer and the range was found to be 100 bp to 190 bp. 13 out of 15 alleles were found polymorphic. The average PIC value of SSR
marker was found to be 0.205. The value of Jaccard’s similarity coefficient had ranged from 0.28-1.00 with an average value of 0.64. The dendrogram constructed on SSR molecular marker data through UPGMA method and PCA using average linkage, had enabled grouping of the genotypes into three main clusters. Clustering pattern based on SSR marker data clearly indicated the narrow genetic base of mungbean genotypes that emphasizes the need to explore and exploit more number of germplasm from additional source to study genetic variation in mungbean for genetic improvement. The results indicated the marked usefulness of SSR in the assessment of genetic diversity in mungbean crop.
Key words: Genetic diversity, Mungbean, SSR Marker assisted selection
*
Author for correspondence: [email protected]
Mungbean is also referred to as green gram, golden gram, green bean, mash bean, green soy and its botanical name is Vigna radiata L. (Wilczek). It belongs to the family Fabaceae (Leguminoceae). It is an important legume crop grown in 2.75
million hectare with a production of 1.19 million tones1. It is a diploid with the 2n=
22 chromosome number2. Mungbean not only provides proteins but also maintains soil fertility by fixing atmospheric nitrogen (30-50 kg/ha). It is grown primarily as an intercrop with wheat, maize, potato, etc during kharif and as monocultures during rabi and zaid. It is grown primarily as an intercrop with wheat, maize, potato, etc during kharif and as monocultures during rabi and zaid.
On account of its short duration, photo-insensitivity and dense crop canopy, it assumes special significance in crop intensification, diversification, and conservation of natural resources as well as sustainability of the production system. Mungbean is an excellent source of high quality protein, Vitamin C, Vitamin B, folate and mineral
nutrients eg. calcium, magnesium, phosphorous, potassium etc3. The low productivity of this crop can be attributed to narrow genetic base resulting in low
yield potential and susceptibility to biotic and abiotic stresses4. Although germplasm collection within India is quite large, much diversity has not been reported on the basis of morphological characters. Therefore, an urgent need to identify genetic divergence based on molecular analysis is an essential pre-requisite for further utilization in crop improvement programmes.
SSR markers have been widely used for plant genetic analysis because of their abundance, co-dominant inheritance, high polymorphism, reproducibility, and ease
of assay by PCR 5,6. SSR are rapidly becoming a preferred type of DNA marker over RAPD and ISSR in its use for germplasm analysis because SSR are locus specific, widely dispersed throughout the genome, highly polymorphic due to variation in the repeat units and highly informative because of co-dominant nature and are a powerful tool for genetic analysis. SSRs are thus markers of choice for genetic studies because of their hyper variability, co-dominant nature, locus specificity and high reproducibility. Chen et al.,
2015 developed 500 novel expression sequences tag (EST) based SSRs (eSSRs) and genomic SSRs (gSSRs) from mung bean
transcriptome and genome sequences for diversity evaluation7. In recent years, mungbean gSSRs and eSSRs detection has accelerated through NGS/deep
sequencing however validation of these SSRs are yet to be studied8. In the present the genetic diversity of 23 genotypes of mungbean were estimated using SSR molecular markers.
MATERIAL AND METHODS
PLANT MATERIALS AND DNA EXTRACTION
In the present investigation seeds of twenty three genotypes of green gram were procured from Agriculture Research Station (ARS), Durgapura, Jobner Agriculture University, Jaipur. Source details of the materials used are given in Table 1.
3
SSR based Genetic Diversity analysis in mungbean
reaction buffer, 0.5 µM forward and reverse primer and 25 ng genomic DNA. The amplification was performed in an Eppendrof Master cycler, with reaction conditions programmed as initial pre-denaturation at 94 °C for 4 min, followed by 30 cycles of denaturation at 94 °C for 1 min, annealing at 57.3°C to 60.85°C for 1 min, and extension at 72 °C for 45 sec. A final extension was done for 10 min at 72 °C with a hold temperature of 4°C. The above obtained PCR products were mixed with 2 μl of 6X loading dye (Bromophenol blue) and were loaded on 4 per cent metaphor agarose gel prepared in 1X TAE buffer containing ethidium bromide (10 mg/ml)
concentration of 3µl/100ml10. Electrophoresis was carried out and gel was visualized on a UV-transilluminator and photographed using gel documentation system.
DATA ANALYSIS
Amplified bands generated by SSR -PCR amplification were scored based on the presence (1) or absence (0) of bands for each primer and were used to calculate a
genetic similarity matrix employing the Jaccard’s similarity coefficient using NTSYS-pc version 2.111. Cluster analysis was performed on molecular data using
the unweighted pair group method using arithmetic means (UPGMA) algorithm12, from which dendrograms depicting the similarity among varieties were drawn and
plotted [PIC] using NTSYS-pc11.To measure the polymorphism information content
(PIC) of SSR marker system the following formula was applied : PIC=1-nΣpi2 where, n= total number of allele detected for a locus of a marker; pi= frequency of
the 1st allele13. The effective number of alleles, Nei’s genetic diversity/ expected number of hetrozygosity and Shannon's Information index were computed using POPGENE software 14. A two dimensional and three dimensional principal component analysis (PCA) was constructed to provide another means of testing the relationship among genotypes using the EIGEN programme NTSYS-pc version 2.02
11.
RESULTS AND DISCUSSION
Genetic diversity among 23 mungbean genotypes: Ten out of the forty SSRprimers used in the present investigation showed amplification in all the genotypes. Out of ten SSR primers, eight showed good polymorphism. A total of 15 alleles were detected in the 23 mungbean genotypes using 10 SSR markers, out of which 13 were polymorphic with an average polymorphism of 86.66 per cent. The total number of alleles observed for each primer was recorded separately and percentage polymorphism calculated subsequently (Table 2). Overall size of PCR amplified products ranged between 100 bp to 190 bp. PIC values, a measure of the allelic diversity, ranged from 0.00 to 0.45 with an average of 0.205. The total numbers of alleles observed for each primer were recorded separately and are shown in Table 2
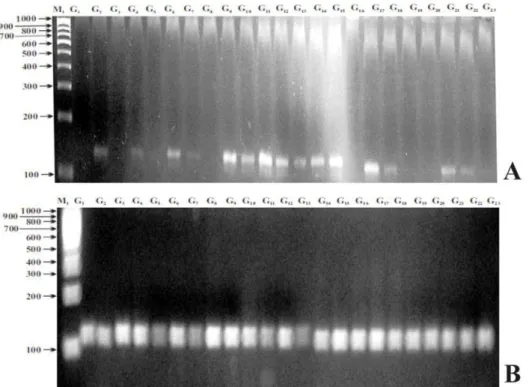
.The DNA banding pattern of individual plant DNA samples from the 23 genotypes of mungbean. After amplification with SSR primers are depicted in Fig.1.The similarity indices between genotypes ranged from 0.28 to 1.00 or the genetic diversity ranged from 0 to 72%.
Figure 1: SSR profiles ofVigna radiata L. genotypes generated through (a) CEDG050 (b)CEDG088. G1-G23 represents G1-PUSA672; G2-AKM962; G3-UPM02-18; G4-ML-729; G5-EC-398885; G6-1; G7- IPM-02-03; G8-IPM02-14; G9-IPOI-1539; G10-RMG-62; G11-PDM-288; G12-RMG-353; G13-PRETEEKHSA-NEPAL; G14-MEHA; G15-PANT; G16-ASHA;G17-MG331;G18-GM9925, G19-IC-393407; G20-DRA-24; G21-SAMRAT; G22-HUM-1 and G23-HUM-12. M1-100 bp DNA Ladder and M2- 1000 bp DNA Ladder
The average similarity across all 23 genotypes was found out to be 0.64, showing that genotypes were moderately similar to each other. Maximum similarity value of 1.00 was observed between genotypes 1539 and ML-729; PANT and ML-729; IPOI-1539 and IPM 02-01; PANT and IPOI-IPOI-1539; IC-393407 and IPM 02-14; DRA-24and IPMO2-14;HUM-12 and IPMO2-14;PANT and IPOI-1539; DRA-24 and IC-393407; HUM-12 and IC-IC-393407; HUM-12 and DRA-24, respectively. Genotypes PDM-288 and EC-398885, as well as MEHA and EC-398885 were found to be genetically diverse with minimum similarity value of 0.40.
Similar polymorphism results have been shown previously by Singh, et al. (2012) where authors estimated genetic diversity of the induced variation among 30 mutant lines and parent genotype (Pusa 9072)15. The size of amplification products varied in case of each primer and the range was 50 bp to 250 bp. A total of 98% polymorphism was observed through STMS markers among the mutants. Gupta et al. (2013) had studied 30 SSR markers in mungbean genotypes, out of which 19
5
SSR based Genetic Diversity analysis in mungbean
“I” averaged 0.46 and ranged from 0.29 to 0.69. The most polymorphic loci were identified in CEDG50 followed by CEDG10, CEDDG6, CEDG88, and CEDG92 that revealed a high level of genetic variation.
The similar results for the expected heterozygosity (He) also referred as Nei’s gene
diversity for the polymorphic SSR markers were reported by Gupta et al., (2013) which was ranged from 0.03 to 0.63, indicated the presence of low genetic diversity in the Indian mungbean18. The presence of very low observed hetrozygosity in Indian mungbean genotypes is expected since it is a self pollinated crop.
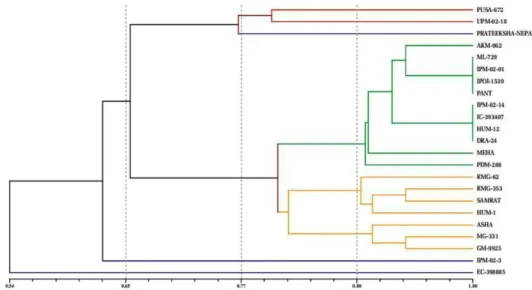
ASSOCIATIONS AMONG INDIVIDUALS OF MUNGBEAN GENOTYPES The UPGMA analysis based cluster tree analysis divided the 23 mungbean
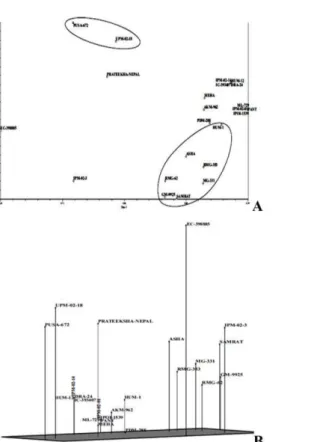
genotypes into three major clusters at a similarity coefficient of 0.80 (Fig. 2). Cluster I included two genotypes PUSA-672 and UPM-02-18 which were found similar to each other at a similarity coefficient of 0.79. Cluster II included eleven genotypes, viz., AKM-962, ML-729, IPM-02-01, IPOI-1539, PANT, IPM-02-14, IC-393407, HUM-12, DRA-24, MEHA and PDM-288 again found similar to each other at a similarity coefficient of 0.79. Cluster III consisted of seven genotypes viz., RMG-62, RMG-353 SAMRAT, HUM-1, ASHA, MG-331, and GM-9925 that were found similar to each other at a similarity coefficient of 0.88. Three genotypes viz.. PRATEEKSHA-NEPAL, IPM-02-3 and EC-398885 were out grouped from all the clusters thus indicating that they are divergent. Two and three dimension principal component analysis based on SSR data (Fig. 3) showed similar clustering pattern of the 23 genotypes as evident from cluster tree analysis. Similarity coefficients ranged from 0.50 to 0.97, indicative of an average degree of variation. Similar to the UPGMA cluster tree, most of the genotypes were found to be grouped into three main groups.
Figure 2: Dendrogram constructed with UPGMA clustering method among 23 genotypes of V. radiata L. using SSR markers.
Figure 3: (a) Two Dimensional Principal Component Analysis (b) Three Dimensional Principal Component Analysisbased on Euclidean Cluster Analysis Using SSR Markers.
Similar clustering were also observed by Gupta et al., (2013)18 through UPGMA analysis based on 19 polymorphic SSR markers grouped the 29 mungbean genotypes
into three main clusters with Dice’s analysis, the similarity coefficient ranging from
0.31 to 1.0. Dikshit et al. found that the SSR marker was more efficient in detecting genetic variability among all Vigna species19. The results of the PCA analysis were also congruent well with Gupta et al. (2013).
The traditional method of SSR marker development usually includes the construction of genomic library, cloning and sequencing, which is costly and labor intensive. With the advancement in sequencing technologies viz. RNA sequencing with NGS technology has provided an effective way to develop EST-SSRs, which makes them a valuable resource of these SSRs for future genetic studies. Liu et al. (2016) identified 3788 expressed sequence tag-simple sequence repeat (EST-SSR) motifs in
mungbean which could be used as potential molecular markers upon validation20. Validation of molecular markers e.g. SSRs are one step toward providing precise genetic information for future breeding program and accurately characterize the
genotype portraying for the extent of genetic diversity21. The present study discusses the validation of such SSRs and polymorphic SSRs can further be employed for crop improvement.
7
SSR based Genetic Diversity analysis in mungbean
be used for genetic analysis in mungbean. The result showed the presence of narrow genetic diversity in Indian mungbean genotypes and would help the mungbean breeders in selection of suitable parents for breeding purposes and genetic mapping studies.
ACKNOWLEDGEMENT
Gunnjeet thanks UGC, New Delhi, for awarding SRF under the Maulana Azad National Fellowship for Minority Students. Dr. N. S. Dodiya and Dr. K. B. Shukla are great fully acknowledged for their suggestions for the improvement of the manuscript. The authors gratefully acknowledge the financial assistance from the RKVY project
“Validation of important crop varieties through DNA fingerprinting”.
REFRENCES
1. Economic Survey. Ministry of Finance, Department of Economic
Affairs.Economics Division Government of India, New Delhi. 2012-2013. 2.Arumuganathan K and Earle ED . Nuclear DNA content of some important plant
species. Plant Molecular Biology Report .1991; 9: 208-218.
3.Saini M, Singh S, Hussain Z and Yadav A.RAPD analysis in mungbean (V. radiata (L.) Wilczek): I. Assessment of genetic diversity. Indian Journal of Biotechnolog. 2010;9: 137-146.
4. Poehlman JM . The Mungbean. Oxford and IBH Publication, New Delhi. 1991. 5.Kuleung C, Baenziger PS and Dweikar I. Transferability of SSR markers among
wheat, rye, and triticale. Theoretical and Applied Genetics.2004; 108(6): 1147-1150. 6.Xie RJ, Zhou J, Wang GY, Zhang SM, Chen L and Gao ZS. Cultivar identification
and genetic diversity of Chinese bayberry (Myrica rubra) accessions based on fluorescent SSR markers. Plant Molecular Biology Reporter. 2011; 29(3): 554-562. 7.Chen H, Qiao L, Wang L, Wanga L, Blair MW and Cheng Z. Assessment of genetic
diversity and population structure of mung bean (Vigna radiata) germplasm using EST-based and genomic SSR markers. Gene . 2015; 566 (2): 175–183
8.Chen H, Wang L, Wang S, Liu C, Blair MW and Cheng Z. Transcriptome Sequencing of Mung Bean (Vigna radiate L.) Genes and the Identification of EST-SSR Markers. PLoS ONE. 2015; 10(4): e0120273.
9.Doyle JJ and Doyle JL. A rapid DNA isolation procedure for small quantities of fresh leaf material. Phytochemical Bulletin.1987; 19: 11-15.
10.Sambrook J, Fritschi EF and Maniatis T . Molecular cloning: a laboratory manual. Cold Spring Harbor Laboratory Press, New York. 1989.
11.Rohlf FJ. NTSYS-PC. Numerical taxonomy and multivariate analysis system.Exeter Software, New York. 1989.
12.Sneath PHA and Sokal RR. Numerical Taxonomy. San Francisco, Freeman. 1973. 13.Smith JSC, Chin EL, Shu H, Smith OS, Wall SJ, Senior ML, Mitchell SE, Kresovich S and
Zeigle J . An evaluation of the utility of SSR loci as molecular markers in maize (Z.mays L.):comparisons with data from RFLPs and pedigree. Theoretical and Applied Genetics.1997; 95: 163-173.
14.Yeh FC, Boyle TJB. Population genetic analysis of co-dominant and dominant markers and quantitative traits. Belgian J. Bot.1997; 129:157-163.
15.Singh SK, Lavanya GR, Bhat KV, Babu GS, Arya L, Verma M, Hussain Z, Roy S, Rathi RS and Mishra AK. Microsatellite Markers Revealed Genetic Diversity in Mungbean Mutant Lines. Indian Journal of Hill Farming. 2012; 25(1): 38-43.
16.Gupta S, Gupta DS, Anjum, KT, Pratap A and Kumar J. Transferability of simple sequence repeat markers in black gram (V. mungo L. Hepper). Australian Journal of Crop Science.2013; 7(3): 345-353.
gene-specific markers associated with salt tolerance for mungbean (Vigna radiata L.Wilczek). Spanish Journal of Agricultural Research. 2014;12 (3): 732-741.
18.Gupta SK, Bansal R, Vaidya UJ and Gopalakrishna T. Assessment of genetic diversity at molecular level in mungbean (Vigna radiata (L.) Wilczek). Journal of Food Legumes. 2013; 26(3 & 4): 19-24.
19.Dikshit HK, Jhang T, Singh NK, Koundal KR, Bansal KC, Chandra N, Tickoo JL and Sharma TR . Genetic differentiation of Vigna species by RAPD, URP and SSR markers. Biologia Plantarum. 2007; 51(3): 451-457.
20.Liu C, Fan B, Cao Z, Su Q, Wang Y, Zhang Z, Wu J and Tian J. A deep sequencing analysis of transcriptomes and the development of EST-SSR markers in mungbean (Vigna radiata). Journal of Genetics. 2016; 95: 527–535.
21.Goyal P, Jain R, Kachhwaha S and Kothari SL. Assessment of genetic diversity in Pithecellobium dulce (Roxb.)
Benth. germplasm using RAPD and ISSR markers. Trees. 2015; 29: 637–653