Genome prediction accuracy of common bean via Bayesian models
Acurácia de predição genômica em feijoeiro-comum via modelos Bayesianos Leiri Daiane Barili1 Naine Martins do Vale2 Fabyano Fonseca e Silva1*
José Eustáquio de Souza Carneiro3 Hinayah Rojas de Oliveira1 Rosana Pereira Vianello4 Paula Arielle Mendes Ribeiro Valdisser4 Moyses Nascimento5
ISSNe 1678-4596
1Departamento de Zootecnia, Universidade Federal de Viçosa (UFV), 36.570-090, Viçosa, MG, Brasil. E-mail: fabyanofonseca@ufv.br. *Corresponding author.
2Coodetec, Desenvolvimento Produção e Comercialização Agrícola LTDA, Sorriso, MT, Brasil. 3Departamento de Fitotecnia, Universidade Federal de Viçosa (UFV),Viçosa, MG, Brasil. 4Embrapa Arroz e Feijão, Santo Antônio do Goiás, GO, Brasil.
5Departamento de Estatística, Universidade Federal de Viçosa (UFV), Viçosa, MG, Brasil.
ABSTRACT: We aimed to apply genomic information based on SNP (single nucleotide polymorphism) markers for the genetic evaluation of the traits “stay-green” (SG), plant architecture (PA), grain aspect (GA) and grain yield (GY) in common bean through Bayesian models. These models were compared in terms of prediction accuracy and ability for heritability estimation for each one of the mentioned traits. A total of 80
cultivars were genotyped for 377 SNP markers, whose effects were estimated by five different Bayesian models: Bayes A (BA), B (BB), C (BC),
LASSO (BL) e Ridge regression (BRR). Although, prediction accuracies calculated by means of cross-validation have been similar within each trait, the BB model stood out for the trait SG, whereas the BRR was indicated for the remaining traits. The heritability estimates for the traits SG, PA, GA and GY were 0.61, 0.28, 0.32 and 0.29, respectively. In summary, the Bayesian methods applied here were effective and ease to be implemented. The used SNP markers can help in the early selection of promising genotypes, since incorporating genomic information increase the prediction accuracy of the estimated genetic merit.
Key words: Phaseolus vulgaris, SNP markers, cross-validation.
RESUMO: Objetivou-se incorporar informações genômicas de marcadores SNP (“single nucleotide polymorphism”) na avaliação genética das características “stay-green” (SG), arquitetura de planta (AP), aspecto de grãos (AG) e produtividade de grãos (PG) em feijoeiro-comum via modelos Bayesianos. Estes modelos foram comparados quanto a acurácia de predição e habilidade de estimação da herdabilidade para cada característica. Utilizaram-se informações de 80 cultivares genotipadas para 377 marcadores SNP, cujos efeitos de substituição alélica
foram estimados por meio de cinco diferentes modelos Bayesianos: Bayes A (BA), B (BB), C (BC), LASSO (BL) e regressão “ridge” (BRR).
Embora as acurácias de predição calculadas por meio de análise de validação cruzada tenham sido similares dentro de cada característica, o modelo BB se destacou para a característica SG, enquanto o modelo BRR foi indicado para as demais. As herdabilidades estimadas para SG, AP, AG e PG foram, respectivamente, 0,61, 0,28, 0,32 e 0,29. Em resumo, os métodos contemplados mostraram-se efetivos e de fácil implementação. O conjunto de marcadores utilizado pode auxiliar na seleção precoce de genótipos promissores, uma vez que a incorporação de informações genômicas aumenta a acurácia de predição do mérito genético estimado.
Palavras-chave: Phaseolus vulgaris, marcadores SNP, validação cruzada.
CROP PRODUCTION
INTRODUCTION
Although, classic genetic breeding of common bean has contributed to increase grain
yield in the last five decades (BARILI et al., 2016a;
BARILI et al., 2016b), there are still some traits that need to be more effectively improved, such as plant architecture and grain appearance, mainly in carioca-type cultivars (BARILI et al. 2016a).
Grain yield, grain appearance, and plant architecture traits generally have low heritability
(GONÇALVES-VIDIGAL et al., 2008; BERTOLDO et al., 2009; COIMBRA et al., 2009; SILVA et al.,
2009a) and low precision in selecting phenotypes,
thus justifying the use of Genome Wide Selection
(GWS) for early identification of individuals with
favorable potential to form new cultivars.
In the GWS method, it is not possible to freely estimate the effect of each SNP on the phenotype due to problems of multicollinearity (different markers
with the same genotype profile) and dimensionality
takes into account all these solutions and has been successfully used since the early GWS studies,
mainly in the fields of animal and forest breeding
(REZENDE et al., 2011).
Given the lack of research on common bean using the GWS method, the objective of the present study was to incorporate genomic information (SNPs markers) in the genetic assessment of “stay-green” traits, grain yield, plant architecture, and grain appearance using Bayesian models. Another objective was to compare the proposed models and estimate the heritability of each trait.
MATERIALS AND METHODS
A total of 80 bean cultivars, which were recommended by different research institutions in
Brazil (1960-2013), were phenotyped in the field
(2013) in both drought and winter crops, in the cities of Coimbra (MG) and Viçosa (MG), in a total of four experiments. The experimental design of randomized blocks was used with three replicates. The experimental plots were composed of four 3m length rows, with 0.5m spaces between them. Seeding density was 250,000 plants ha-1.
Traits were evaluated as follows: Plant architecture (PA) was evaluated using a 1-5 score diagram (RAMALHO et al., 1998), in which score 1 refers to erect type I or II plants (with a stem and
high insertion of the first pods) and score 5 to type-III plants (with long internodes and very prostrate);
Stay Green (SG) was evaluated using the 1-5 score diagram (WALULU et al., 1994), in which score 1 refers to plants that presented above 80% of green stem and fully mature pods and score 5 to plants
with up to 20% green stems and mature pods; Grain
appearance(GA) was evaluated by the 1-5 score diagram (RAMALHO et al., 1998), in which score 1 refers to the carioca standard grain and score 5 to grains completely non-standard carioca. Evaluation
of GA was carried out in the same field experiment
design, with observation by two evaluators. Grain yield (GY) was measured by the total weight obtained in the two central rows of the plot, adjusted to 13% moisture and extrapolated to kg ha-1.
The cultivars were genotyped for the 384 SNPs markers, of which, 377 were used in the analyzes. Extraction of DNA was performed at the Genetic Analysis Laboratory, Federal University of Viçosa (UFV). Genomic DNA was isolated from leaf tissue samples using the Promega (Wizard® Genomic DNA Purification) kit according to the manufacturer’s
protocol. Genotyping was performed at the
Biotechnology Laboratory, Embrapa Rice and Beans (Santo Antônio de Goiás, GO), using the Illumina Bead X pressplatform (KIM & MISRA, 2007), based on the Golden Gate/VeraCode® technology,
for the Illumina Bead X press (Illumina, 2012) reader. Genotyping of SNPs was performed using the Genome Studio (Illumina, v. 1.8.4) software,with
0.25-Gen Call Threshold; Call Rate values varying in
the range 0.6463-1.00 for calling SNPs and GenTrain
≥0.2535 for clustering of SNPs. Clustering for the
allele call for each SNP was performed a priori in an automated manner, based on the intensity of the
signals emitted by the Cy3 and Cy5 fluorophores,
which were grouped into three classes of genotypes representative of groups of homozygous for the AA or BB alleles and heterozygous for the AB allele. To ensure the quality of the genotype data, a quality control was performed, and markers with a call rate below 95% and a lower allele frequency inferior to 5% were eliminated.
Once the set of SNPs, which compose the
genotypic data file, was selected, they were subjected
to an imputation process, because the call rate value for selection of SNPs was 95%, ie, SNPs with up to 5% of missing information (missings) were also used. To perform this imputation, the F Impute (v.2)
software was used. Thus, the final file of genotypic
data consisted of 80 cultivars with genotypes 0, 1, and 2 (corresponding to AA, BB, and AB, respectively) for each of the 377 SNPs considered.
Statistical analyzes were performed using the following Bayesian models: Bayes A (BA), Bayes B (BB), Bayes C (BC), Bayes LASSO (BL), and Bayes ridge regression (BRR). These models are
defined according to the general model proposed by
MEUWISSEN et al. (2001) as follows:
(1)
in which: y is the vector of phenotypes; 1 is the vector
of the same dimension as y with all values equal to
unity; μ is the mean of the study trait, gi is the marker
effect (i=1,2,...,377), xi is the incidence vector of
For the BB and BC models specifically, the
probability of generating the binary indicator variable
γi (related to the selection of variables) was generated from a Beta distribution (α1, α2). For the BL model,
the priori distribution for parameter was assumed
to be an exponential, , in which parameter
λ, known as “penalization” or “regularization”, was
assumed to belong to the Gamma distribution, such
that .
Differences between models are related to the genetic architecture they represent. The BRR assumes a priori that all markers have the same
variance; differently, the BA model assumes a
variance for each marker. The BB model, like the
BA model, also assumes a variance for each marker;
however, it also selects variables (it assumes that some markers have no effect on the study trait), which are performed using the mixture of Normal distributions based on the ratio of 1 and 0 values
generated for γi The BC, like the BB model, also assumes this selection of variables; however, unlike
BA and like BRR, it assumes only a single variance for all markers. The BL model, like the BB model, assumes one variance for each marker and also
selection of variables; however, this selection is not
based on a mixture of distributions, but on the use of a
regularization parameter (λ) that directs markers with
irrelevant effects close to zero.
All models mentioned above were implemented using the free R software (R Development Core Team, 2015) through the BGLR
(Bayesian Generalized Linear Regression) package
considering 180,000 iterations, 20,000 burn-in
iterations (number of iterations to be discarded), and thin equal to 8 iterations (sample interval). For convergence analysis of the MCMC (Markov Chain –
Monte Carlo) chains from Bayesian models, the BOA
(Bayesian Output Analysis) package was used.
All models were compared using the cross-validation analysis, which was partitioned
into four data files (4-fold cross-validation) containing 20 individuals each. Thus, a sub-file
(with 20 individuals) was removed from the data set to compose the validation population, whereas the other 60 individuals were used to obtain the genomic estimated breeding values (GEBVs) in the training population. Thus, since all marker effects in the training population were estimated, they were applied to predict the GEBV for each individual from the validation population. At the end of the analysis,
GEBV vectors from the four files used, as well as the
phenotypic values omitted from the analysis were obtained and used to estimate the selection accuracy.
Accuracy estimates were calculated as being the correlation between predicted and observed GEBVs divided by the square root of heritability (RESENDE et al., 2012).
RESULTS AND DISCUSSION
In general, results presented in Table 1 indicate that the prediction quality was directly proportional to the complexity of the considered
Bayesian method; thus agreeing with the results
presented by MEUWISSEN et al. (2001). Differences between accuracies obtained by using each method
for the four traits have had relatively low magnitudes;
however, it has been observed that the Bayes B method for “stay-green” (which considers a priori one variance per marker and automatic selection of the most relevant markers) presented a better prediction quality in relation to other methods. The BRR method (which assumes the same variance for all markers but does not execute its selection) is the most suitable for
the PA, GA, and GY traits; although, their accuracies are similar; the reason is that they are polygenic traits
in which each gene has a small effect on the traits. The BRR method is best suited for quantitative traits, since all markers are considered a priori equally relevant.
Studies on evaluation of genomic predictions for such traits and use of Bayesian methods in studies on bean crop are still scarce in the literature, hindering the comparison between outcomes and highlighting the importance of the present study.
Because of the fact that BB method admits a variance for each marker and in addition redundant markers are eliminated, all this has resulted in a greater capture of additive genetic
Table 1 - Mean prediction accuracy values (calculated from 4-fold cross-validation) in the Bayes A (BA), Bayes B (BB), Bayes C (BC), Bayes Lasso (BL), and Bayesian Ridge Regression (BRR) models, for the stay-green (SG), plant architecture (PA), grain appearance (GA), and grain yield (GY) traits.
Models ---Traits---
SG PA GA GY
BA 0.15 0.25 0.28 0.47
BB 0.19 0.21 0.28 0.40
BC 0.16 0.23 0.28 0.43
BL 0.16 0.25 0.28 0.47
variance, reaching a high heritability value (0.61) for “stay-green” (Table 2). It fits to the BB method assumptions, because it is controlled by few genes and has a low environmental effect (AGUIAR et al., 2000). These authors have suggested that this
feature is controlled by one to five genes.
The stay-green trait was evaluated in some cultivated species such as maize, sorghum, and
sunflower, as it gives a greater tolerance to drought and greatly decreases lodging (WALULU et al., 1994;
WANOUS et al., 1991). It was observed that most erect bean plants expressed late senescence or “stay-green” levels at the harvest time (AGUIAR et al., 2000).CARMO et al. (2007) have studied segregating bean families and reported high heritability estimates (0.58-0.73), similar to those obtained in this study, which indicates that success with the use of phenotypic selection is possible. It was reported that “stay green” in wheat is a high heritability trait, which is controlled by a single two-allele gene, with partial dominance gene action and large participation of additivity (SILVA, 1999). GENTINETTA et al. (1986) reported that this corn trait is controlled by a single locus with two alleles. These results contribute to the fact that this trait also has an oligogenic control in bean crop. Selection of “stay-green” genotypes in bean crop can help to obtain more erect plants, providing improvements such as lesser loss and better quality in grains, as it has been observed in corn, cotton, and sorghum crops.
For the GY, PA and GA traits, there is a broad discussion about its genetic control in the literature. Most authors agree that these traits are polygenic (controlled by a large number of genes with small effect each, but great environmental effect in phenotypic expression). Most traits of economic and agronomic importance studied in vegetal species are of quantitative nature. Given the type of genetic control of these traits, estimation of genetic parameters and phenotypic selection are threatened by environmental effects. Estimates based on marker information are more accurate because their estimates occur at DNA level, thus helping breeders in the selection process. The following heritability values were estimated using the BRR model selecting for GY (0.29), PA (0.28), and GA (0.32) (Table 2).
There is a great variation in the phenotypic expression for GY, and this occurs due to its strictly quantitative nature (COIMBRA et al., 2009). Grain yield is governed by several genes with
little effect on the phenotype; in addition, this trait is classified as polygenic, being subject to present
low heritability values and high environmental effect. Heritability values for GY are reported in the literature. PEREIRA et al. (2004), BERTOLDO et al. (2009), GONÇALVES VIDIGAL et al. (2008), CHIORATO et al. (2008) and COIMBRA et al. (2009) obtained mean estimates in the range 0.03-0.36. Traits controlled by various genes and
influenced by the environment have low heritability
values (LI et al., 2003).
Plant architecture is a trait of great importance for most crops, including common bean crop. Erect and less lodged plants are sought by breeders and farmers, enabling mechanical harvesting (MENDES et al., 2009) and providing better grain quality due to lower pod contact with the soil (JOST et al., 2014). SILVA et al. (2009b) has observed heritability values of 0.1-0.65 for PA in F5.7 populations. JOST et al. (2014) have studied the methods of conduction of segregating populations and observed h2 values
in the range of 0.49-0.59. PEREIRA et al. (2004) observed values in the range of 0.29-0.74 for h2.
Phenotypic selection for PA is often hampered by environmental effects because measurement in the field is difficult (plants are evaluated by means of score scales). Overestimated predictions lead to unsuccessful selection. Thus, more accurate estimates via the GWS method can better help the breeder at the time to select promising genotypes.
Regarding the GA trait, the heritability values reported in the literature at the level of phenotypic data greatly differ from the observed values based on genotypic data. SILVA et al (2009a) reported values in the range 0.48-0.76. PEREIRA et al. (2004) observed values in the range 0.43-0.79. In developing new cultivars, GA is a very important
Table 2 - Heritability estimates and variance components for the stay green (SG), plant architecture (PA), grain appearance (GA), and grain yield (GY) traits based on genomic information obtained using the selected Bayesian models.
Parameters ---Traits---
SG PA GA GY
Heritability 0.61 0.28 0.32 0.29 Genetic variance 0.09 0.10 0.18 86,429 Error variance 0.06 0.26 0.38 212,411
trait because the consumer market has a
well-defined grain pattern preference. Thus, cultivars
that deviate from this pattern fall into disuse and can become obsolete.
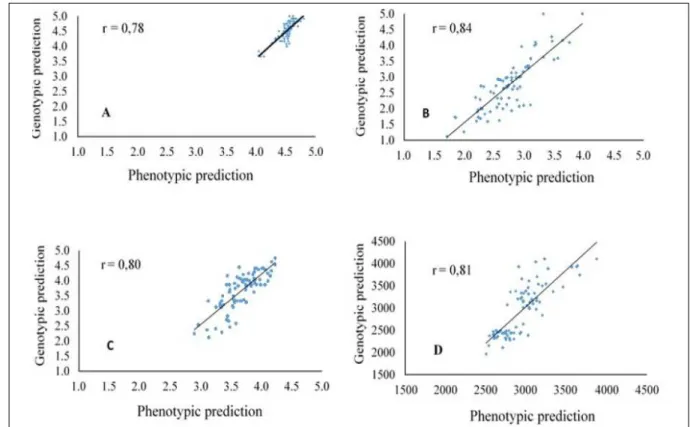
Genomic selection, as compared to traditional selection (based on phenotypic information), provides greater accuracy in predicting genetic values, especially traits with low heritability. Thus, a high correlation between values for genomic predictions and observed phenotypes was reported
for all traits in the field, varying in range from 0.78
(SG) to 0.85 (GA) (Figure 1).
Identification of molecular markers
highly correlated with traits of agronomic interest is valuable for plant breeding because assisted selection can provide a greater speed to obtain promising individuals. Application of genomic selection allows establishing association between molecular markers and phenotypic traits of interest. The GWS method has been successfully carried out in many crops, such as maize, rice, sorghum, and
eucalyptus among others (HUANG et al., 2010;
ZHAO et al., 2011; YANG et al., 2014), and has
great possibilities of succeeding and contributing to bean breeding, providing genetic gains in this crop of economic and social importance in Brazil. REZENDE et al. (2011) have suggested that the GWS method is able to identify good alleles already in F2 autogamous populations and can directthe best crosses and provide increase in genetic gains. Thus, the breeders should better exploit the prediction methods available in the literature, applying them in their breeding programs.
CONCLUSION
Bayes B was the most effective model to estimate the genomic genetic value for the “stay green” trait. The Ridge regression model is best indicated for other traits of polygenic character. The heritability values estimated using SNP markers, and their high selection accuracy indicates that the set of markers used in this study can help breeders in the early selection of promising common bean genotypes.
961-967, 2010. Available from: <http://www.nature.com/ng/ journal/v42/n11/full/ng.695.html>. Accessed: Jul. 06, 2016. JOST, E. et al. Methods of selecting common bean lines having high yield, early cycle and erect growth. Revista Ciência Agronômica, v. 45, p. 101-110, 2014. Available from: <http://www.scielo.br/pdf/ rca/v45n1/13.pdf>. Accessed: Aug. 20, 2016.
LI, Z.K. et al. QTL x environment interactions in rice. I. Heading date and plant height. Theoretical Applied of Genetics, v. 108, p. 141-153, 2003. Available from: <https://www.ncbi.nlm.nih.gov/ pubmed/12961067>. Accessed: Jul. 06, 2017.
MENDES, F.M. et al. Selection index for choosing segregating populations in common bean Pesquisa Agropecuária Brasileira, v. 10, p. 1312-1318, 2009. Available from: <http://www.scielo.br/ pdf/pab/v44n10/v44n10a15.pdf>. Accessed: Jul. 06, 2016. MEUWISSEN, T.H.E. et al. Prediction of total genetic value using genome wide dense marker maps. Genetics, v. 157, p. 1819-1829, 2001. Available from: <http://www.genetics.org/ content/157/4/1819>. Accessed: May 16, 2016.
PEREIRA H.S. et al. Common bean lines with resistance to anthracnose selected to desirable agronomical traits. Pesquisa Agropecuária Brasileira, v.39, p. 209-215, 2004. Available from: <http://www.scielo.br/pdf/pab/v39n3/a02v39n3.pdf>. Accessed: Jul. 06, 2017.
RESENDE, M.D.V. et al. Seleção Genômica Ampla (GWS) via Modelos Mistos (REML/BLUP), Inferência Bayesiana (MCMC), Regressão Aleatória Multivariada (RRM) e Estatística Espacial. 1. ed., 2012. v. 1. 291 p.
SILVA D.V.F. et al. Selection of pink grain Common Bean lines with good cooking ability, resistance to anthracnose and angular leaf spot. Bragantia, v.68, p.583-591, 2009a. Available from: <http://www. scielo.br/pdf/brag/v68n3/a04v68n3.pdf>. Accessed: Jul. 06, 2017. SILVA, C.A. et al. Plant architecture and grain yield in common bean progênies with erect and prostrate plant habit. Pesquisa Agropecuária Brasileira, v. 44, p.1647-1652, 2009b. Available from: <http://www. scielo.br/pdf/pab/v44n12/v44n12a13.pdf>. Accessed: May 11, 2016. WALULU, R.S. et al. Inheritance of the stay green trait in sorghum. Crop Science, Madison, v. 34, p. 970- 972, 1994. Available from: <https://dl.sciencesocieties.org/publications/cs/abstracts/34/4/ access=0&view=pdf>. Accessed: Jul. 06, 2017.
YANG, W. et al. Combining high-throughput phenotyping and genome-wide association studies to reveal natural genetic variation in rice. Nature Communications, v. 5, p. 5087, 2014. Available from: <https://www.nature.com/articles/ncomms6087>. Accessed: Jul. 06, 2017. doi: 10.1038/ncomms6087.
ZHAO, K. et al. Genome-wide association mapping reveals a rich genetic architecture of complex traits in Oryza sativa. Nature Communications, v. 2, p. 467, 2011. Available from: <https:// www.ncbi.nlm.nih.gov/pubmed/21915109>. Accessed: Jul. 06, 2017. doi: 10.1038/ncomms1467.
ACKNOWLEDGEMENTS
The authors would like to thank Embrapa arroz e feijão assistance in genotyping and to the Conselho Nacional de Desenvolvimento Científico e Tecnológico (CNPq/MCTI/Brazil) for the financial support.
DECLARATION OF CONFLICTING OF INTERESTS
The authors declare no conflict of interest. The founding sponsors had no role in the design of the study; in the collection, analyses, or interpretation of data; in the writing of the manuscript, and in the decision to publish the results. REFERENCES
AGUIAR, A.M. et al. Genetic control of the trait ‘Stay Green’ in common bean (Phaseolus vulgaris L.). Revista Ceres, Viçosa, v. 47, p. 155-167, 2000. Available from: <http://www.ceres.ufv.br/ojs/index. php/ceres/article/viewFile/2585/576>. Accessed: Jul. 06, 2017. BARILI L.D. et al. Genetic progress resulting from forty-three years of breeding of the carioca common bean in Brazil. Genetics and Molecular Research, v. 15, n. 3, on line, 2016a. Available from: <http://dx.doi.org/10.4238/gmr.15038523>. Accessed: Jul. 06, 2017. doi: 10.4238/gmr.15038523.
BARILI L.D. et al. Five decades of black common bean genetic breeding in Brazil. Pesq. Agropec. Trop., v. 46, n. 3, p. 259-266, 2016b. Available from: <http://www.scielo.br/pdf/pat/v46n3/1983-4063-pat-46-03-0259.pdf>. Accessed: Jul. 06, 2017.
BERTOLDO J.G. et al. Grain yield in black beans: environment is the component that more interferes in the phenotypic value. Ciência Rural, v.39, n.7, p.1974-1982, 2009. Available from: <http://www. scielo.br/pdf/cr/v39n7/a265cr1502.pdf>. Accessed: Aug. 20, 2017. CARMO, S.L.M. et al. Performance of common bean segregating families based on stay green. Ciência e Agrotecnologia, v. 31, p. 953-957, 2007. Available from: <http://www.scielo.br/pdf/cagro/ v31n4/02.pdf>. Accessed: Aug. 10, 2016.
COIMBRA, J.L.M. et al. Mining of genotype x environment interaction in Phaseolus vulgaris L. to the State of Santa Catarina. Ciência Rural, v. 39, p.355-363, 2009. Available from: <http://www.scielo.br/scielo.php?script=sci_arttext&pid =S0103-84782009000200007>. Accessed: Aug. 20, 2017. doi: 10.1590/S0103-84782008005000069.