UNIVERSIDADE FEDERAL DE UBERL ˆ
ANDIA
FACULDADE DE ENGENHARIA EL´
ETRICA
P ´
OS-GRADUAC
¸ ˜
AO EM ENGENHARIA EL´
ETRICA
DEVELOPMENT OF A PLC SIGNAL ANALYZER
PROTOTYPE USING THE USRP MODULE, THE
GNU RADIO SOFTWARE AND A PLC-USRP
INTERFACE PROTOTYPE
Paulo Victor Rodrigues Ferreira
DEZEMBRO
UNIVERSIDADE FEDERAL DE UBERL ˆ
ANDIA
FACULDADE DE ENGENHARIA EL´
ETRICA
P ´
OS-GRADUAC
¸ ˜
AO EM ENGENHARIA
EL´
ETRICA
DESENVOLVIMENTO DE UM PROT ´
OTIPO DE
UM ANALISADOR ESPECTRAL DE SINAL PLC
UTILIZANDO O M ´
ODULO USRP, O SOFTWARE
GNU RADIO E O PROT ´
OTIPO DA INTERFACE
PLC-USRP
Paulo Victor Rodrigues Ferreira
Texto da disserta¸c˜ao apresentada `a
Universidade Federal de Uberlˆandia,
perante a banca de examinadores
abaixo, como parte dos requisitos
necess´arios `a obten¸c˜ao do t´ıtulo de
Mestre em Ciˆencias. Aprovada em 21
de Dezembro de 2012
Banca examinadora:
Dr. Antˆonio Cl´audio Paschoarelli Veiga - (UFU) - Orientador
Dra. Edna L´
ucia Flˆores - (UFU)
DEVELOPMENT OF A PLC SIGNAL ANALYZER
PROTOTYPE USING THE USRP MODULE, THE
GNU RADIO SOFTWARE AND A PLC-USRP
INTERFACE PROTOTYPE
Paulo Victor Rodrigues Ferreira
Texto da disserta¸c˜ao apresentada `a Universidade Federal de Uberlˆandia como parte dos
requisitos para obten¸c˜ao do t´ıtulo de Mestre em Ciˆecias.
Prof. Dr. Antˆonio Cl´audio Paschoarelli Veiga Prof. Dr. Alexandre Cardoso
Agradecimentos
Agrade¸co a DEUS por me dar sa´ude e for¸cas para desenvolver esta disserta¸c˜ao e pela
oportunidade de ampliar meus conhecimentos. Dedico este trabalho aos meus pais e em
es-pecial a minha m˜ae Jacqueline e minha av´o Joana, que me deram todo o apoio necess´ario. `
As minhas irm˜as, tios, padrinhos e demais familiares agrade¸co pela compreens˜ao nos
di-versos momentos de ausˆencia e pelos conselhos que muito me motivaram e contribu´ıram
para a continuidade do desenvolvimento deste projeto. Sou grato tamb´em aos professores
do curso do Programa de P´os-Gradua¸c˜ao da Faculdade de Engenharia El´etrica, por
com-partilharem seus conhecimentos e experiˆencias, em especial ao Prof. Dr. Antˆonio C. P.
Veiga, pelo seu profissionalismo e pelas orienta¸c˜oes e ensinamentos concedidos ao longo
do curso de Mestrado. Tamb´em agrade¸co aos demais colegas pelo apoio e solidariedade
durante as dificuldades e principalmente nos momentos de alegrias quando da solu¸c˜ao dos
problemas. `A CAPES, sou grato pelo apoio financeiro, atrav´es da concess˜ao da bolsa,
porque sem ela o desenvolvimento deste trabalho seria financeiramente invi´avel.
Obrigado a todos os que direta ou indiretamente contribu´ıram para o desenvolvimento
desta disserta¸c˜ao. Que DEUS aben¸coe a todos n´os, para que possamos dar continuidade
ao desenvolvimento do conhecimento cient´ıfico e contribuir para a solu¸c˜ao dos problemas
Resumo
Ferreira, P. V. R.&Veiga, A. C. P. DESENVOLVIMENTO DE UM PROT ´OTIPO
DE UM ANALISADOR ESPECTRAL DE SINAL PLC UTILIZANDO O M ´ODULO
USRP, O SOFTWARE GNU RADIO E O PROT ´OTIPO DA INTERFACE PLC-USRP,
FEELT-UFU, Uberlˆandia, 2012, 127.
O objetivo deste trabalho ´e desenvolver um prot´otipo para fazer a aquisi¸c˜ao e an´alise
de sinais de redes Powerline Communication (PLC), utilizando o m´odulo hardware USRP,
o software GNU Radio e um prot´otipo de uma interface PLC-USRP desenvolvida
espe-cialmente para permitir a acquisi¸c˜ao dos sinais. O desenvolvimento desta disserta¸c˜ao se
baseia no fato de n˜ao existir ferramenta equivalente no mercado, que permita a aquisi¸c˜ao
e a an´alise de sinais PLC. Outro fator motivacional ´e a utiliza¸c˜ao de solu¸c˜oes de baixo
custo, como o m´odulo USRP e o software GNU Radio que implementam o conceito de
R´adio Definido por Software (RDS). Para implementar a interface f´ısica do m´odulo USRP
com a rede PLC e acondicionar os sinais adequadamente, foi desenvolvido um prot´otipo
da interface PLC-USRP. Com a finalidade de certificar o correto funcionamento dessa
interface foi desenvolvido um prot´otipo de um software de baixo custo baseado em RDS
para fazer a aquisi¸c˜ao da amplitude da resposta em frequˆencia de um circuito eletrˆonico.
Para mostrar os resultados obtidos com o prot´otipo do analisador espectral de sinal PLC
foi realizada a aquisi¸c˜ao de seu espectro em tempo real.
Palavras-chave
Abstract
Ferreira, P. V. R.&Veiga, A. C. P. DEVELOPMENT OF A PLC SIGNAL ANALYZER
PROTOTYPE USING THE USRP MODULE, THE GNU RADIO SOFTWARE AND A
PLC-USRP INTERFACE PROTOTYPE,
FEELT-UFU, Uberlˆandia, 2012, 127.
This work aims to develop a prototype that makes the acquisition and analysis of
Powerline Communication (PLC) network signals, using the hardware module USRP, the
GNU Radio software and a prototype of a PLC-USRP interface specially developed in
order to allow the signals acquisition. The development of this project relies on the fact
that there is no similar tool on the market, which allows the PLC signals acquisition
and analysis. Another issue is the usage of low-cost solutions like the USRP module and
the GNU Radio software, that together implement the Software Defined Radio (SDR)
concept. For the implementation of the physical USRP interface with the PLC network
and to adjust the signals to be suitable to be handled by the USRP module a
PLC-USRP interface prototype was designed. Aiming to experimentally validate the correct
performance of this interface a low-cost software prototype was designed, also based on the
SDR concept to make the acquisition of the frequency response amplitude of an electrical
circuit. The effectiveness of the PLC signal spectral analyzer prototype was demonstrated
through the acquisition of a PLC spectrum of a real transmitted signal.
Keywords
Contents
Contents vii
List of Figures ix
List of Tables xii
1 Introduction 1
1.1 The problem . . . 1
1.2 The solution . . . 2
1.3 Final considerations of this chapter . . . 3
2 Power line Communications 5 2.1 The basic principles . . . 5
2.2 Final considerations of this chapter . . . 20
3 Software Defined Radio 21 3.1 The SDR concept . . . 21
3.2 The hardware module Universal Software Radio Peripheral (USRP) . . . . 25
3.3 The software module GNU Radio . . . 31
3.4 Final considerations of this chapter . . . 33
4 A low-cost electronic circuit frequency response amplitude acquisition prototype 35 4.1 Objective . . . 35
4.2 The prototype . . . 36
4.2.1 The transmitter path . . . 36
4.2.3 Amplitude measurement on GNU Radio baseband signals . . . 40
4.3 The prototype in action: semi-automatic method . . . 43
4.4 The prototype in action: automatic method . . . 49
4.5 The prototype in action: frequency response phase acquisition using the automatic method . . . 54
4.6 The prototype in action: the ultimate approach . . . 55
4.7 Final considerations of this chapter . . . 57
5 The PLC-USRP interface prototype development 58 5.1 The need of a PLC-USRP interface . . . 58
5.1.1 The PLC and USRP requirements . . . 59
5.2 The ideal PLC-USRP interface design . . . 63
5.2.1 DC blocking . . . 64
5.2.2 Electrical Protection . . . 66
5.2.3 Pass-band filter . . . 72
5.3 The practical PLC-USRP interface design . . . 81
5.4 Final considerations of this chapter . . . 85
6 A low-cost PLC in-building signal analyser prototype 87 6.1 The basic system . . . 87
6.2 The results . . . 93
6.3 Final considerations of this chapter . . . 99
7 Conclusions and contributions of this work and Future work 104 7.1 Future work . . . 105
List of Figures
2.1 Sum of modulated PLC and power signals . . . 8
2.2 PLC networks frequency bands . . . 9
2.3 Private electrical network . . . 10
2.4 Public electrical network . . . 11
2.5 PLC logical networks using different NEK . . . 14
2.6 IEEE 1901-2010 FFT OFDM PLC modem . . . 16
2.7 PLC modem hardware architecture . . . 16
2.8 FFT OFDM transmission spectrum mask . . . 17
2.9 IEEE 1901 FFT OFDM transceiver . . . 18
2.10 PLC access network . . . 19
3.1 SDR concept flow graph . . . 23
3.2 USRP1 motherboard architecture . . . 26
3.3 USRP1 motherboard . . . 28
3.4 USRP daughter-boards . . . 30
3.5 GNU Radio development layer stack . . . 32
3.6 Python script . . . 33
3.7 GRC flow graph of a Wideband FM Transmitter . . . 34
4.1 Approaches for signal generation at transmitter side . . . 38
4.2 Transmitter GRC flow graph . . . 39
4.3 Receiver GRC flow graph . . . 40
4.4 Amplitude measurement without the pair, with one pair and with 15 pairs 41 4.5 Amplitude frequency response of a low-pass filter . . . 42
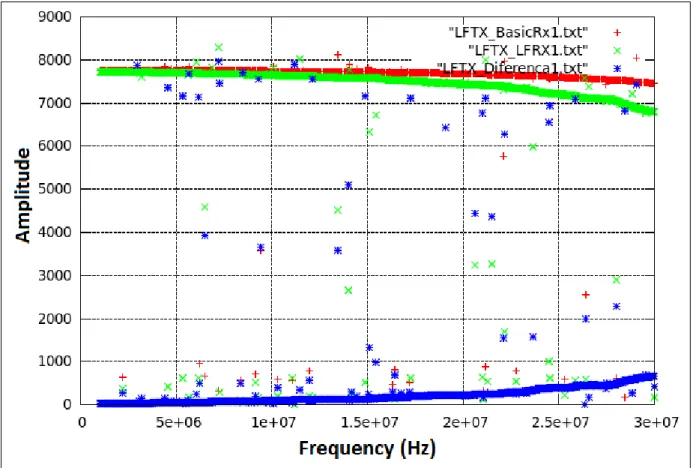
4.7 Frequency response amplitude of the transceiver system using the
trans-mitter daughter-board LFTX . . . 47
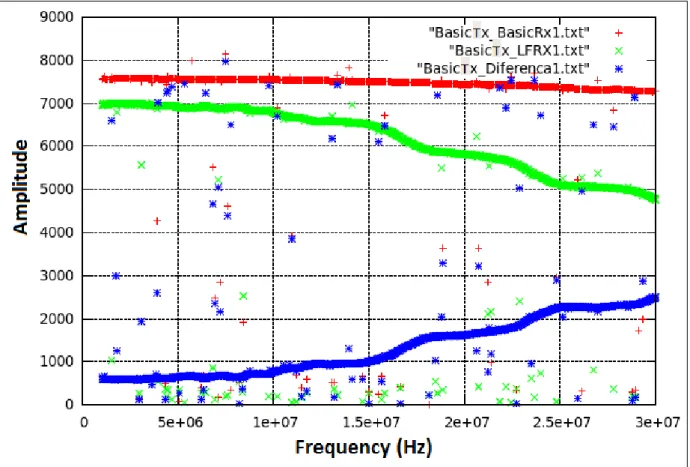
4.8 Frequency response amplitude of the four transceiver system configurations and their differences . . . 48
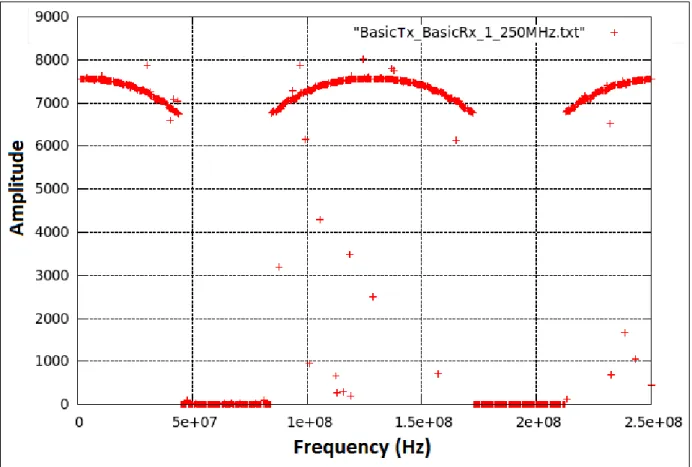
4.9 Frequency response amplitude of the transceiver system BasicTx-BasicRx from 1 up to 250 MHz . . . 49
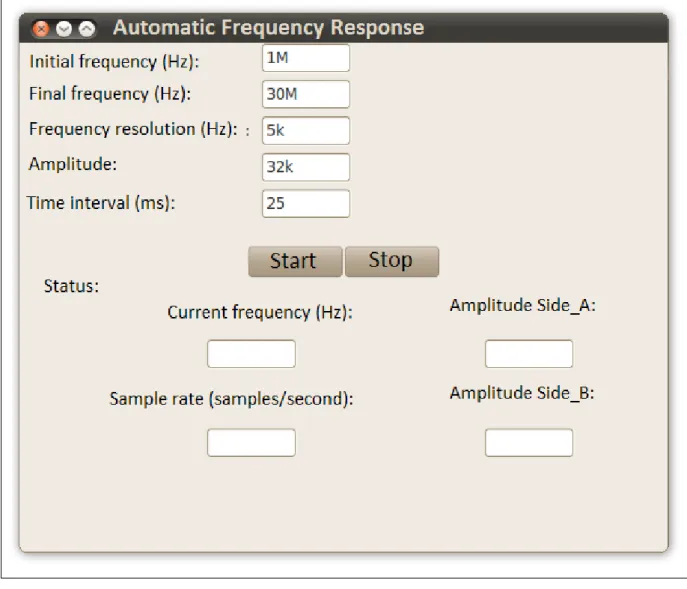
4.10 AFR software graphical interface . . . 50
4.11 Amplitude frequency response with 1 ms time interval between samples for transceivers using BasicTx . . . 51
4.12 Amplitude frequency response with 1 ms time interval between samples for transceivers using LFTX . . . 52
4.13 Amplitude frequency response with 25 ms time interval between samples of the four transceiver configurations . . . 53
4.14 Frequency response amplitude of the transceiver system BasicTx-BasicRx from 1 up to 250 MHz using the automatic method . . . 54
4.15 Frequency response phase of the transceiver system BasicTx-LFRX . . . . 56
4.16 Ultimate Frequency response receiver prototype . . . 57
5.1 Simple low-pass filter . . . 66
5.2 Low-pass filter response with C=3 nF . . . 67
5.3 Low-pass filter response with C=3 nF zoomed . . . 68
5.4 Low-pass filter response with C=33 uF . . . 69
5.5 Low-pass filter response with C=33 uF zoomed . . . 69
5.6 Low-pass filter response with C=10 nF . . . 70
5.7 Low-pass filter response with C=10 nF zoomed . . . 70
5.8 Standard impulse current waveform . . . 71
5.9 Gain plot of some filter approximations . . . 73
5.10 Attenuation of the Butterworth filter versus the cutoff frequency multi-ples [33] . . . 74
5.11 Low-pass Butterworth network ladder starting with shunt capacitor . . . . 76
5.12 High-pass Butterworth network ladder converted from low-pass filter . . . 77
5.15 Passband Butterworth filter response - log scale . . . 79
5.16 Passband Butterworth filter response - linear scale . . . 79
5.17 New passband Butterworth filter response - log scale . . . 80
5.18 New passband Butterworth filter response - linear scale . . . 80
5.19 Ideal PLC-USRP interface schematic . . . 81
5.20 PLC-USRP interface PCB layout . . . 83
5.21 PLC-USRP interface prototype with ac cord . . . 84
5.22 Zoomed PLC-USRP interface prototype . . . 85
5.23 PLC-USRP interface prototype gain response using the AFR software pro-totype . . . 86
6.1 PLC signal analyser diagram block . . . 88
6.2 USRP Front-End routing . . . 89
6.3 USRP FPGA DDC . . . 90
6.4 Complex multiplication . . . 91
6.5 GNU Radio receiver . . . 93
6.6 PLC FFT Plot from 0 up to 8 MHz . . . 94
6.7 PLC FFT Plot from 8 up to 16 MHz . . . 95
6.8 PLC FFT Plot from 16 up to 24 MHz . . . 96
6.9 PLC FFT Plot from 24 up to 32 MHz . . . 97
6.10 Computer performance during spectrum acquisition . . . 98
6.11 PLC spectrum with low carrier density at 4 MHz . . . 99
6.12 PLC spectrum with low carrier density at 28 MHz . . . 100
6.13 PLC spectrum with high carrier density and low power at 28 MHz . . . 101
6.14 Average PLC spectrum with low carrier density at 28 MHz . . . 101
6.15 GNU Radio receiver for 16 MHz spectrum bandwidth . . . 102
6.16 PLC spectrum with 16 MHz spectrum bandwidth at 8 MHz . . . 102
List of Tables
2.1 Modulation Characteristics . . . 15
2.2 Modulation Characteristics . . . 17
3.1 USRP Motherboards Family . . . 26
3.2 USRP Daughter-boards Family . . . 27
5.1 Normalized Butterworth Element Values, RS =RL = 1Ω [33] . . . 75
Chapter 1
Introduction
Sometimes, during the development of a new telecommunication’s system or even after
its release and deployment it’s necessary to analyse the signals that are being transmitted
or received through a certain channel in order to evaluate the transmitter, the receiver or
the channel behaviour at a physical level.
This evaluation enables the certification of the telecommunication’s system to make
sure that the practical system is compliant with its primary design in terms of performance
like ensuring the electromagnetic compatibility (EMC) and in terms of quality of the
service delivered. Another usage of this evaluation is to allow that further researches and
tests are made seeking the improvement of the system performance.
Therefore, an evaluation system is required to intercept the channel and measure the
signals without affecting its characteristics. This system must have an interface that is
able to deal with the telecommunication’s channel and with the measuring system which
will acquire the signals and make all the desired evaluation processing.
1.1
The problem
One telecommunication’s technology that is becoming very popular due to a lot of
benefits and advantages offered like energy green solutions, home control and
automa-tion, internet access connecautoma-tion, remote metering, and etc., also being responsible for
supporting most of the smart grid technology concept is the Power Line Communication
(PLC) detailed at the Chapter 3.
channel and there is also another kind of signal that must be treated with caution. With
so many solutions, different standards and protocols being developed using the PLC
concept is necessary to develop an evaluation tool able “to see” the PLC signal, capture
its spectrum and make further processing that is required for a certain application or so,
taking into account the electrical hazards and implementing all the protections required.
The most practical analyzer that may be used to evaluate a certain
telecommunica-tion’s channel is the spectrum analyzer, which allows to see the frequency usage and the
power level in a certain frequency range. The problem with this approach is the price
of the spectrum analyzer since the most important task that it will perform is to show
the spectrum in real time and most of the time it won’t make the spectrum available for
further processing, like real-time processing the spectrum shown. To perform this, the
same system responsible for acquiring the signal and calculating the spectrum must be
able to get the same signal and to perform a certain processing on it. Moreover, to develop
such a system, it’s necessary to have a system that allows flexibility on development and
testing of many different processing techniques over the signal acquired.
On the market there isn’t a system with such framework, where you just turn it on,
connect it to a network and it processes the signal as you want to. The platforms available
are expensive spectrum analyzers and some of them are able to perform very specific and
limited processing.
Nowadays, the prices of the basic models of such spectrum analyzers starts between
US$ 22,000.00 up to US$ 56,000.00 without taxes. So with the need to evaluate a
cer-tain telecommunication’s channel and acquire its spectrum for making another processing
tasks, a cheaper, flexible and computer-based software solution must be developed.
1.2
The solution
In order to build a system that is capable of dealing with a certain channel interface
design and at the same time to acquire the signal and process it using a computer-based
software, it was found a technology that is essentially an hybrid hardware equipped with
a multi-purpose processor. It’s called Universal Software Radio Peripheral (USRP), a
hardware module that works together with a license-free software called GNU Radio in
to transform most of the hardware problems and activities into software ones. Some of
them are more detailed on Chapter 3.
For the evaluation system to have access to the PLC network an interface must be
developed. This interface may connect the GNU Radio software through the USRP
hardware module to the PLC network. Some requirements like safety coupling of the
analyzer system to the network and voltage signal’s levels must be verified and met by
the interface design. The development of this interface is detailed on Chapter 5.
After building the interface it’s necessary to know its frequency response. This
re-sponse aims to show the level of interference (gain, attenuation, phase delay, etc.) on the
system connected to it.
On the market there are some systems that do this kind of test and they are known
as Frequency Response Analysers (FRA). Their price start about US$ 2,400.00 up to
US$ 9,495.00 without taxes and shipping, the most basic ones including only the
dedi-cated hardware. The military standard, which is portable, and includes all the required
hardware embedded like battery and monitor costs about US$ 14,370.00 also without
taxes and shipping.
But the USRP is a low-cost hardware module with some capabilities and a
multi-purpose processor, then, before developing the PLC-USRP interface, a prototype for
amplitude frequency response acquisition was developed aiming to also perform one of
the most important function of the FRA equipment. The development of this prototype
is detailed in Chapter 4.
Finally, with the PLC-USRP interface and its amplitude frequency response, a small
PLC network was build and the prototype of the PLC network analyzer system was
con-nected to it in order to acquire its spectrum. This experiment and the related comments
are described at Chapter 6.
1.3
Final considerations of this chapter
This chapter showed the problem to be solved throughout this dissertation, the solution
to solve this problem and how this dissertation is structured.
The next chapter will make a general introduction on the Power line Communication’s
Chapter 2
Power line Communications
Power line Communications (PLC) is a technology that uses the high, medium and
low voltage electrical network to provide telecommunication services. It allows data
trans-mission over electrical wiring, which corresponds to the physical layer in the OSI model,
and is therefore, a complementary function to delivery of electrical power.
2.1
The basic principles
In 1838, an English man, Edward Davy, proposed a solution allowing remote
mea-surement to be taken of battery levels of sites far from the telegraph system between
London and Liverpool. In 1897, he submitted the first patent for a technique for the
remote measurement of electrical network meters communicating over electrical wiring.
In 1950, the first PLC systems known as Ripple Control (single-directional with carrier
frequency between 100 Hz and 1 kHz) were designed and deployed, over medium- and
low-voltage electrical networks, for the remote switching on and off of public lights or for
tariff changes [9] .
After 1960, the first European committee for electrotechnical standardization (Cen´elec)
band PLC system appeared in France, extending from 3 to 148,5 kHz allowing
bidirec-tional communications over the low voltage (LV) network for meter readings and home
automation.
By that time, there were more infrastructure of electrical lines than telephone lines, and
after the World War II the communications systems were designed for data transmission
by then.
One of the first PLC commercial technologies is known as X10, an older home
au-tomation mechanism developed in 1975, which communicates with a throughput of 20
bits per second. The X10 protocol consists of short commands that can switch short
distant devices on and off, for example [32].
Nowadays, some devices don’t need to communicate over radio, because when a wired
network is available it can be used too. A wired infrastructure can be more economical
if it is already in place, and in the case of the power lines widespread availability, the
network can deliver both power and communication.
There are some places where, also, the wireless communication is not efficient due
to long distances, high attenuation/interference, EMC (electromagnetic compatibility)
constraints, and most of the time the installation of additional cables, pipes, electronic
devices or any kind of environment modification are not allowed, but there is still the
need of a reliable data network to be widely deployed. In such a scenario there is a high
probability that may exist a power line inside this environment or even very near to it.
This is a suitable scenario for PLC to take place and deploy the required network.
With the science evolution and, consequently, the electronic developments the need
for high-resolution multimedia and interactive content, high-speed internet access, and
many others lead to the development of high-throughput standards with rates up to
200 Mbps and 500 Mbps up to 300 meters by 2012, which are widely deployed within
home networks. On the other hand, there are some applications that don’t require high
throughputs, but need to reach longer distances within a minimum data rate and high
security levels through high-voltage grids. Nowadays, for these two different reasons, the
two most important alliances, HomePlug Alliance and G3-PLC Alliance, are the main
PLC players and drive the development and researches related to this technology.
The HomePlug Alliance [14] is a comprised of industry leaders at each level of the
value chain (from technology to services and content) and its members bring the necessary
capabilities and financial commitment to the successful development and launch of the
technology. Its main objectives are to enable and promote rapid availability, adoption
and implementation of cost effective, interoperable and standards-based home power line
networks and products for low-voltage networks. Although, each alliance establishes a
text will be based on the HomePlug AV standard, because of its support for IEEE
1901-2010 [16] standard for high-speed communication devices.
The G3-PLC Alliance [1] was formed to support, promote and implement G3-PLC in
smart grid communications applications. Its missions are to support G3-PLC in
inter-nationally recognized standards bodies to achieve the rapid adoption of this specification
worldwide, develop a framework for equipment testing to facilitate interoperability among
its adopters, establish a forum to discuss revisions and enhancements to the specification
and identify developers and providers requirements for interoperability and general
us-ability.
The IEEE 1901-2010 standard was the first standard of IEEE related to PLC
tech-nology and the HomePlug techtech-nology was consolidated as the baseline standard for the
power line communications. Between all the existing standards, HomePlug AV is one of
the most deployed and used, that is why all the present study aims to be compatible to
this standard and will be a starting point and a reference for all the physical layer related
issues.
HomePlug Alliance calls the products adhering to IEEE 1901-2010 standard as
‘Home-Plug AV certified’, which are fully interoperable with any other 1901 standard product
and older HomePlug standards. HomePlug AV is an extension of the older HomePlug 1.0
standard which had a bit rate on the order of 14 Mbps in comparison with the theoretical
200 Mbps of the HomePlug AV.
Basically, PLC networks correspond to layers 1 (physical) and 2 (data link) of the OSI
model, supplying an Ethernet connection service to the layers above. HomePlug focuses
on two principal aspects:
• Physical layer:
Concerns with data transmission over the power line medium. The electrical
wiring wasn’t designed to transport high frequency data signals, but signals at 110
V or 220 V in frequencies of 50 Hz or 60 Hz. Also, all the electrical equipments that
are connected to the electrical network or disconnected create measurable level of
perturbations/noise on the transmission channel. And from the EMC point of view,
every powered device, in proximity to the wiring, generates electrical perturbations
which may be conducted (via wiring) or inducted (via radio signals). To improve
modula-tion and error correcmodula-tion which results in good connectivity and transmission rates
between devices;
On the electrical wiring, where a PLC network is deployed, the resulting signals
are the sum of the modulated PLC and the power signal as shown by Figure 2.1 [2].
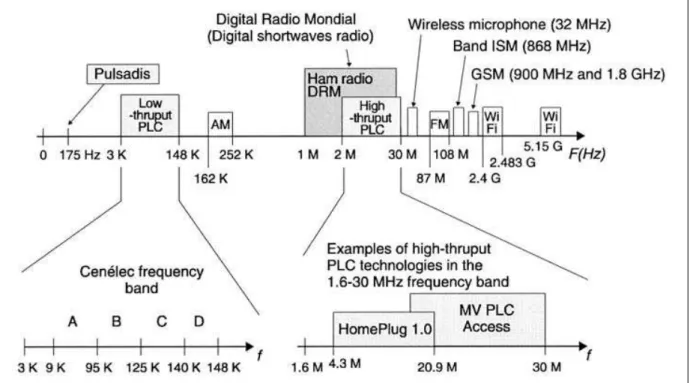
Figure 2.2 [9] shows the two frequency band allocated to the PLC networks: 3 to
148 kHz for low bit rate PLC and 2 to 30 MHz for high bit rate PLC. HomePlug
AV uses the bandwidth from 2 MHz up to 28 MHz.
Figure 2.1: Sum of modulated PLC and power signals
• Data link layer:
Defines the architecture and mechanisms to allow the transmission to take place
over the network under the best possible conditions. The network access technique
used determine its performance. Event though the PLC is wired, its data link layer
has more in common with wireless data link layer. In wired data link layers such as
Ethernet, Carrier Sense Medium Access/Collision Detection (CSMA/CD) is often
used for collision detection. But wireless and PLC transceivers cannot listen for
incoming signals while transmitting their own signals, therefore PLC used CSMA
Figure 2.2: PLC networks frequency bands
guarantee a minimum transmission time. This is why HomePlug AV implements
Time Division Multiple Access (TDMA) as the medium access system, allocating
transmission time slots, which is a required solution when dealing with real-time
based applications with a high throughput. It’s important to note that one of these
time slots are dedicated for the interoperability with PLC devices using CSMA/CA.
This way, the PLC equipment provides a terminal or any device, which needs to be
connected to the data network, an Ethernet connection service using a MAC protocol
and RJ-45 connectors allowing this device to access services in high layers such as IP,
TCP, HTTP, etc.
The topology of power lines networks can be viewed as a medium shared by all
equip-ment carrying multiple PLC signals, transporting data exchanged between terminals of a
local network. The concept of shared medium can be divided into two different domains.
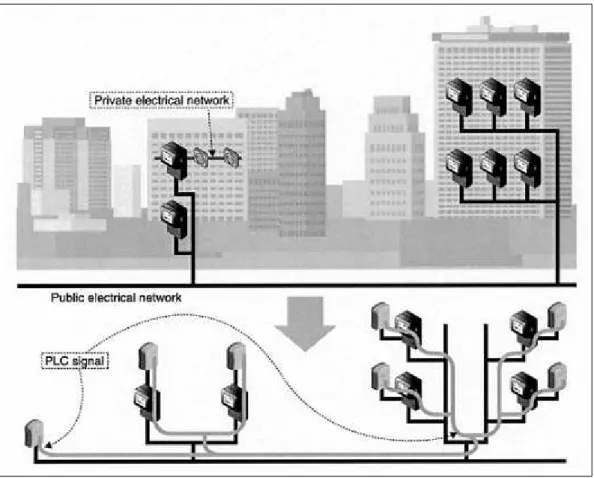
One is the private electrical network, as shown in Figure 2.3, located behind the meter
connecting it to the public electrical network and managed by those in the zone it serves,
like an apartment, a house, an office, a factory, etc. The other domain is the public
electrical network, as shown in Figure 2.4, which is the distribution network that supplies
public to the extent that anyone may be a subscriber.
Inside a home building, all branches of the network generally come out of the main
circuit breaker panel and meter, and the PLC signals circulate in all branches. The
electrical network can be seen as a data bus with PLC devices connected on both the
public and private zones [9].
Figure 2.3: Private electrical network
The PLC network acts as an antenna producing electromagnetic radiation in its
en-vironment and disturbs other services operating in the same frequency range. Therefore,
the regulatory bodies specify very strong limits regarding the electromagnetic emission
from the PLC networks, with a consequence that PLC networks have to operate with a
limited signal power. This causes a reduction of network distances and data rates and
increases sensitivity to disturbances. This is why the PLC transmission power is specified
by its Power Spectral Density, instead of the voltage amplitude [15].
Sometimes is necessary to repeat the signal in order to extent its coverage zone. To
do that, the PLC repeaters amplify and regenerate the signals by means of one of the
two different repeater types. The physical repeater physically amplifies the signal and
Figure 2.4: Public electrical network
data frame level. It is composed by two PLC repeaters connected by Ethernet interface,
one is connected at one segment of the electrical network where the signal is still good
and the second is connected at the segment where the signal cannot reach. By doing this,
the overall bandwidth is reduced by a factor of two, because two distinct logical PLC
networks are created on the same electrical network.
One of the major functionalities of the PLC networks is the network mode, which is
used to manage all PLC devices at the same network. There three network modes:
• Master-slave: like a client-server type in an IP network, in which the master device
manages the exchanges between the PLC devices of the network
• Peer-to-peer: like a peer-to-peer IP network, where all PLC devices play the same
role and have the same hierarchical level and are allowed to change data without
being monitored.
• Centralized: a mix of the previous ones where the CCo (central) device manages
the devices without going via CCo like in peer-to-peer mode. This is the actually
the mode of the HomePlug AV technology.
The disturbances that come from the electrical devices which are also attached to the
electrical network may be in the frequency band of the PLC devices. It is interesting to
install filters as close as possible to the disturbing devices in order to stop these disturbing
frequencies from getting into the PLC network. One must note that using such filters
makes the disturbing device unable to access the PLC network. But its manufacturer
can foresee this case and implement an internal split placing the filter only on the power
supply side, making sure that the PLC signal goes into the internal PLC modem without
any filter in its path.
Although the PLC electrical wiring is also a medium shared by the various network
devices it’s difficult to have access to it and it involves major dangers due to the presence
of power signal at 110-220 V/50-60 Hz. The PLC network security is not a big concern
because of the difficult to have access to its transmission physical medium as long as
in Wi-Fi anyone in the network coverage area has plenty access to the physical medium
layer and can even intercept the signals. However, the PLC network is subjected to
various types of attacks either to interfere with the PLC operation or to intercept the
transmitted information. Also, its signals propagates outside the limits of the private
electrical networks in a conducted or radiated way, which implies in the implementation
of suitable software security levels.
The main network attack types are eavesdropping, prevention of operation, which leads
to the network collapse and network reconfiguration. To avoid any information disclosure,
the network traffic must be encrypted in a way that anyone not allowed cannot recover or
decipher it. So, to counter-attack these attacks some security techniques are used such as
cryptography (to prevent intruders from accessing data), authentication (to identify and
authorize data exchange), and integrity control (to know whether the data exchanged was
not modified during transmission).
In the HomePlug standard, the PLC logical network is based on an encryption key
called Network Encryption Key (NEK) that encrypts the data exchanged between the
various PLC devices as shown in Figure 2.5. Each PLC logical network can be configured
and all the PLC devices connected by Ethernet interface recover this configuration.
• Electrical interface: The configuration frame of the NEK is sent over the electrical
network to the PLC devices. A second key, called Default Encryption Key (DEK)
which is specific to each PLC device, printed in a tag given by the manufacturer,
must be known. This way, an encrypted NEK is exchanged between two PLC
devices, the configuring station and the one that wants to get the NEK and to
connect to the network.
• Web interface: Some advanced PLC devices handle key configuration by Web
inter-face.
This assures that the data (encrypted frames) only flows between the electrical
in-terface and the Ethernet inin-terface if the device has the right NEK from the PLC logical
network. In addition to that, the PLC frames, known as physical frames which carries the
data exchanged over a PLC network, are carried in several frequency bands and the
modu-lation techniques used are different depending on the PLC channel quality, also preventing
from attacks intended to accumulate enough frames and to use brute force breaking tools
to later try out all possible combinations or decryption algorithms. At each PLC device
connected to a network there is a table called Tone Map, that has the information of what
modulation technique has been used for each link from itself toward to each other PLC
device. This table is continually refreshed in a dynamically time interval, from 10 ms up
to several seconds and doesn’t contain all the other link’s modulation techniques used at
the moment.
In HomePlug AV the security is guaranteed by functionalities such as: encryption
based on 128-bit AES in cipher block chaining (CPC) mode at data link layer, easy
connect button (each PLC device HomePlug AV has one, and it is possible to pair two
devices pushing this button on both within an interval of some seconds), rotation of NEK
values every hour, use of Direct Access Key (DAK), that is the same as DEK for HomePlug
1.0, a pair of Public-Private Key (PPK) encryption, higher layer authentication protocols
like Radius authentication server, among many others.
Many electrical and electronic devices connected to the electrical network produce
radio frequency electromagnetic emissions in the surrounding operational environment.
Figure 2.5: PLC logical networks using different NEK
communication if they are in the same PLC frequency range. Reciprocally, PLC devices
emit electromagnetic waves that may interfere with the close operating electronic devices.
To avoid this, some regulatory bodies such as International Special Committee on Radio
Interference (CISPR) establish limits on the transmission power and authorized frequency
bands to be used by for PLC devices.
In order to comply with transmission power and frequency band constraints, current
PLC technologies, such as HomePlug AV, implement a notching technique which is
ba-sically filtering techniques for frequencies already used by other radio communication
technologies and consist of listening to the radio channels to readjust the transmitted
power at some frequencies.
In the IEEE 1901[16] specifications there are two physical layer modulation standards
that can be selected among many other Physical Service Access Point (PHY-SAP)
pa-rameters: wavelet OFDM or windowed OFDM, also known as FFT OFDM. Windowed
OFDM provides flexible spectrum notching capability where the notches can exceed 30
dB in depth without losing significant useful spectrum outside of the notch. [3]. Also,
win-dowed OFDM has proven to be immune to impulsive noise and resistant to narrowband
In section ‘13.2.1 - FFT outline description’ of IEEE 1901-2010 is defined that the
FFT OFDM employs up to 1974 carriers in the range from 1.8 MHz to 50 MHz. Of
the carriers below 30 MHz, 917 carriers out of 1155, with an approximately bandwidth
of 24,414 kHz each, are used for modulation and the other 238 are turned off or masked
aiming not to interfere with licensed services like AM broadcast band, and higher amateur
band frequencies. The carrier and spectral mask table from IEEE 1901-2010 standard is
shown on Table 2.1.
Table 2.1: Modulation Characteristics
Frequency(MHz) PSD max. (dBm/Hz) Carrier status Service allocation
F ≤ 1.71 -92 0-70 OFF AM broadcast
1.71 <F <1.8 -85 71-73 OFF Between AM & 160 m
1.8 ≤ F ≤2 -85 74-85 OFF 160 m amateur
2 <F <3.5 -55 86-139 ON FFT carriers
3.5 ≤ F ≤4 -85 140-167 OFF 80 m amateur
4< F <5.33 -55 168-214 ON 1901 FFT carriers 5.33 ≤ F ≤5.407 -85 215-225 OFF 5 MHz amateur
5.407< F <7 -55 226-282 ON 1901 FFT carriers
7≤ F ≤7.3 -85 283-302 OFF 40 amateur
7.3 <F <10.10 -55 303-409 ON 1901 FFT carriers
10.10 ≤ F ≤10.15 -85 410-419 OFF 30 m amateur
10.15 <F <14 -55 420-569 ON 1901 FFT carriers 14≤ F ≤14.35 -85 570-591 OFF 20 amateur 14.35 < F <18.068 -55 592-736 ON 1901 FFT carriers
18.068≤ F ≤18.168 -85 737-748 OFF 17 m amateur
18.168 < F <21 -55 749-856 ON 1901 FFT carriers 21≤ F ≤21.45 -85 857-882 OFF 15 m amateur 21.45< F <24.89 -55 883-1015 ON 1901 FFT carriers
24.89 ≤ F ≤24.99 -85 1016-1027 OFF 12 m amateur
24.99 <F <28 -55 1028-1143 ON 1901 FFT carriers 28≤ F ≤29.7 -85 1144-1220 OFF 10 m amateur 29.70 <F <30 -55 1221-1224 OFF Unused carriers
30≤ F ≤50 -85 1225-2048 OFF Unused carriers
The HomePlug AV frequency band ranges from 2 MHz up to 28 MHz and is divided
into 917 frequency sub-bands at the physical layer complying with IEEE 1901-2010
stan-dard. Each band then uses OFDM symbols in order to encode the data in an orthogonal
manner in the frequency domain. In each frequency band the data and its OFDM
sym-bols are encoded using a turbo convolutional code. The IEEE 1901-2010 FFT OFDM
PLC modem is shown in Figure 2.6 [29]. The PLC modem basic architecture is shown in
Figure 2.6: IEEE 1901-2010 FFT OFDM PLC modem
Figure 2.7: PLC modem hardware architecture
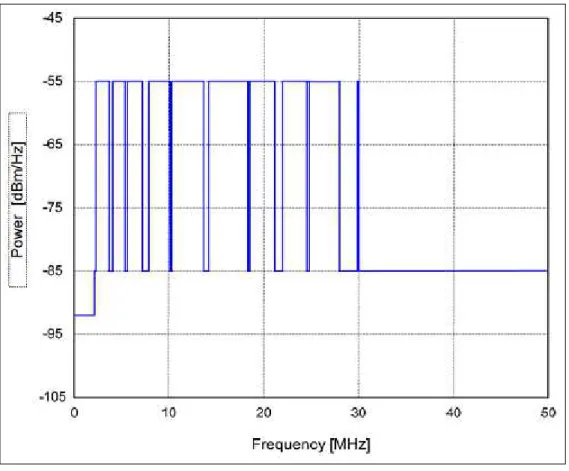
The transmission power of PLC devices is measured as a quasi-peak value and not
as a mean value, i.e., a uniform distribution of the total transmission power on all the
frequency sub-bands or simply, the Power Spectral Density (PSD).
The total transmit power of a transmitter terminated with a standard termination
impedance (50 Ohms) should not exceed +20 dBm (100 mW) in the range of 5 kHz-100
MHz in accordance with the recommendations of ITU-T G.9964 [28], IEEE 1901-2010 [16]
and IEC CISPR 22 [20]. Figure 2.8 shows the FFT OFDM transmission spectrum mask,
showing that the PSD of the PLC devices must be equal to or less than -55 dBm/Hz.
The PSD around -85 dBm/Hz or less, is not perceptible for the electrical network and the
devices close to the electrical wiring [9].
Figure 2.8: FFT OFDM transmission spectrum mask
current channel conditions between network stations. Depending on the link condition
and interference and attenuation levels originated by the other electrical devices connected
to the network or in proximity, the transmission speed must be permanently readjusted
by choosing the carrier modulation mode, which can be different for each carrier, between
BPSK, QPSK, 8-QAM, 16-QAM, 64-QAM, 256-QAM or 1024-QAM. The relation of each
of these modulation type and its number of bits per carrier are shown in Table 2.2 [9].
Table 2.2: Modulation Characteristics Modulation Type Bits per Carrier
BPSK 1
QPSK 2
8-QAM 3
16-QAM 4
64-QAM 6
256-QAM 8
1024-QAM 10
The hardware architecture of a PLC device (modem) is structured around the main
component (the HomePlug PLC chip). Around this chip, that implements all the
to optimize the operation of the PLC modem, like the coupling to the electrical network
(the physical connection to the electrical outlets), the PLC signal gain control,
memo-ries (SRAM - erased when restarting the modem) for storage of information of the PLC
network links state network encryption keys, etc. This basic architecture is shown in
Figure 2.9 [9]. On the transmitter side, all the encoded data, Frame Control Encoder
outputs are lead into a common OFDM modulator that feeds the Analog Front-End. On
the receiver side the process is inverted.
Figure 2.9: IEEE 1901 FFT OFDM transceiver
The methods for accessing the medium used by the PLC networks consists of
connect-ing the PLC devices to the electrical network aimconnect-ing to reach the best performance at
the physical level and useful throughput at the upper layer level. There are two different
methods or couplings types: capacitive coupling and inductive coupling. PLC devices
mostly use capacitive coupling. The inductive coupling is much more efficient than
ca-pacitive coupling. It uses the electromagnetic induction method between two electrical
wirings or between an electrical wiring and a coil wound around the power line wiring. An
inductive coupler reduces the attenuation by 10 to 15 dB for some frequencies in
compar-ison with a capacitive coupler [9]. However, this method requires access to the electrical
The low-voltage networks cover the last few hundreds of meters between the customers
and the transformer unit and offer an alternative solution through PLC technology for the
realization of the so-called “last mile” in the telecommunications access area. In order to
make the PLC signals available at a certain electrical network like just after the MV/LV
transformer aiming to deploy an access neighborhood network, PLC signal injectors also
known as PLC base/master stations are used as shown in Figure 2.10. These devices
usually use inductive coupling.
For a building that has one or many private PLC networks to isolate its indoor
(in-home) area from the outdoor area not allowing the PLC signal to be transmitted through
the power meter unit is used a gateway device. This gateway which is installed near to the
building meter is used to divide the PLC access network from an in-home PLC network
and can act also as a local base station or repeater. It also converts the transmitted signals
between the frequencies that are used in the access and in-home areas. The standards
and its related frequencies used for broadband PLC access networks is out of the scope
of this text.
Figure 2.10: PLC access network
Since none of the current communication system offers by itself the ideal capabilities
to be solely and widely deployed, hybrid networks appear to be the solution that makes
the best use of each of the existent technologies. One of the most successful example of
such coexistence and interoperability is seen between PLC and Wi-Fi. First of all, their
many different ways:
• PLC acting as a backbone network for Wi-Fi which in turn has a great capacity for
distribution of signals through wide areas that handle several mobile devices;
• Wi-Fi bypassing areas with high attenuation for PLC and vice-versa; and
• Wi-Fi and PLC manufactured together in one device aiming a high throughput
using the maximum transfer rate current available (depending on the Wi-Fi and
PLC channels conditions ) considering that both technologies dynamically adapts
to reach the best performance. This solution also gives a more reliable link because
the traffic can be balanced between the two systems. Finally this hybrid solution
can operate in redundancy mode if one of the systems (Wi-Fi or PLC) fails
com-pletely.
PLC technology can be associated with almost any existent communication system and the
major functionality responsible for allowing this interoperability is the Ethernet interface
implemented on the PLC standard.
2.2
Final considerations of this chapter
This chapter gave a basic insight on the PLC technology, its basic principles and some
operational technical information based on the IEEE 1901-2010 standard.
The next chapter will make a general introduction on the Software Defined Radio
concept including some basic technical information of the hardware and software used to
implement this concept which is a big part that composes the solution to the problem
Chapter 3
Software Defined Radio
This chapter aims to give a general idea about what is the technological concept of
the Software Defined Radio (SDR), its basics hardware and software modules and some
examples of applications.
3.1
The SDR concept
The science evolution affects many fields of knowledge and this wouldn’t be different
with the telecommunications engineering. One of the most recently evolution on this field
was the migration of the analog communications systems to a 100% digital environment.
As a result of this migration, the digital radio concept has been developed through the
Software Defined Radio (SDR) concept which seeks to replace most of all analog
compo-nents that process the signals for digital ones implemented on software. This is synthesizes
the main idea of a reconfigurable radio, which has its communications’ systems functions
implemented on software running on a multi-purpose processor.
The benefit of performing the required signal processing in software instead of using
dedicated integrated circuits in hardware is that since software can be easily replaced in
the radio system, the same hardware can be used to create many kinds of radios for many
different transmission standards and consequently in a variety of different applications [6].
This reconfigurability idea was firstly defined on a paper published in May, 1995 by Joe
Mitola on the IEEE Communication Magazine [23], but since 1990 the US Department
of Defence military program SPEAKeasy had already conceived the software radio as a
It’s interesting to note that since the SDR concept is a new model of
telecommu-nication’s systems, it is just one of several stages that compose the evolution process
of this technology concept maturity. This concept was firstly thought to ideally be an
Adaptive-Intelligent Software Radio (AI-SR), which because of its extremely complexity
for the time it was necessary to start developing models more simple like the SDR until
the scientists and engineers reach and domain all the required electronic technology to
deploy a Cognitive Radio (AI-SR)
The AI-SR will be a device capable of adapting to its operational environment aiming
an optimized performance and spectral efficiency (better spectrum management) through
transmitting and receiving signals at any allowed frequency, power level and bandwidth
using any modulation technique. Its basic functionality is its radio ability to automatically
adapt its own operation mode without human interference in order to reach those prior
objectives in accordance with the external propagation, spectrum and network conditions,
also meeting the QoS required on each type of service being executed at the time.
In order to execute these functions it will be necessary a high level of artificial
intelli-gence, high-performance processors, real-time adaptive algorithms including blind source
detection ones, minimum QoS protocols, etc. For example, the radio must adapt to the
actual environment in real time, its own waveform to an optimized one dynamically
de-veloped based on the actual environment attenuation levels requiring a high level support
of a mobile infrastructure network.
The objectives mentioned in this chapter aren’t to go deep inside the AI-SR world, but
to justify its base technology, the SDR, and to prove that it’s reliable while supporting
the basic principle of the future telecommunication’s systems.
Back to the SDR domain, it’s very important to remind that a digital radio is a radio
where the information is digitalized somewhere between the antenna and the I/O devices
(keypad, microphone, speaker, display). But not every digital radio can be a SDR. A
radio can be digital, but if the signal processing after the analog/digital conversion is
done by an Application-Specific Integrated Circuit (ASIC) it’s not a SDR.
Only a digital radio with a multi-purpose processor that allows flexible
reconfigura-tion of almost all funcreconfigura-tions used to implement the communicareconfigura-tion system is a SDR. An
example of such processor is the Field Processing Gate Array (FPGA) which accepts
sam-ple rates, error detection and correction algorithms, cryptography levels, transmission
rates, spectral efficiency (bits per Hertz), among many others.
The main objective of a SDR system is to digitally sample the signals as close as
possible to the antenna, while on the receiver mode and to convert the digital signals
into analog as close as possible to the antenna on the transmitter mode. Then process
the digitized signals in a multi-purpose processor using a reconfigurable software. In
Figure 3.1 there is the SDR concept flow graph [12].
Nowadays, there are some test-beds that allow the prototype of the some functionalities
of a SDR system and are composed by two main parts: one hardware module and one
software module, Parts 1 and 2 respectively, on Figure 3.1. One detail that must be
observed is that the SDR concept was originally conceived for mobile communications, so
the software will be running on the mobile stations or on the network’s base stations when
the system will be deployed. But, while using a test-bed the software will be running on
a PC.
The basic functions shown in Figure 3.1 are distributed as following: the software
module process in real time the signals and virtually implement any type of
modula-tor, demodulamodula-tor, filter, oscillator or any mathematical operation required to the signal
processing and the hardware module accommodates the receiver and the transmitter
an-tennas, makes the acquisition and conversion between analog and digital signals, etc.
Figure 3.1: SDR concept flow graph
A short description of each block of the flow graph shown on Figure 3.1:
FPGA: The hardware processor/function manager;
A/D and D/A: Are the converters from analog to digital and vice-versa;
RF Front End: the analog hardware interface;
The frequency shift between IF or higher frequencies and baseband is performed
by DDC’s and DUC’s in the USRP
• Part 2:
Baseband processing: signal modulation, demodulation, baseband filtering, etc.;
Bit-stream Processing: manage the information received or to be transmitted
digitally re-sampling the message to adequate the sample rate for transmission or
reception and all the digital processing over the ‘pure’ signal including the real-time
external control by human-machine interface; and
Data interface: software external I/O drivers and ports able to receive and
transmit informations inside and outside the processing software to/from external
devices like speakers, screen, storage files, etc.
• Control:
Allows the user/network to control the software for transmission or reception of
informations desired based on
Information from mobile network infrastructure;
Available RF bands;
Available air protocols;
User needs;
Minimum performance requirements;
etc;
It’s also possible to control the FPGA via software by customizing its image
Like in many technologies development processes, the market starts offering some
different options of hardware and software for standard development kits. In the SDR
area there are many options of both hardware and software, but one in special offers the
two most important characteristics desired on a kit: high performance hardware with
wide frequency range and bandwidth and a free-license open-source software that best
supports the hardware.
This chosen hardware is the USRP and the software is the GNU Radio both described
on the next two sections.
3.2
The hardware module Universal Software Radio
Peripheral (USRP)
The USRP is a low-cost software defined radio platform that implements the Part 1
(hardware) on Figure 3.1 and it’s made by the Ettus Research [27]. It has been the choice
of thousands of engineers worldwide for the SDR hardware for algorithm development,
exploration and prototyping.
It is originally designed for RF applications from DC to 6 GHz, supports
Multiple-Input Multiple Output (MIMO) antenna systems operations, etc. Some applications areas
are: white spaces, mobile phones, public safety, spectrum monitoring, radio networking,
cognitive radio, satellite navigation and amateur radio.
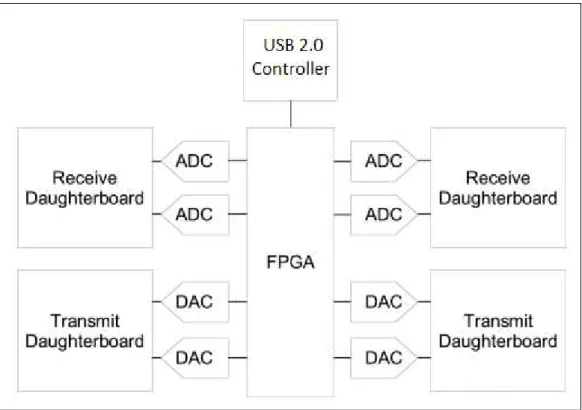
One USRP module is composed by one motherboard, some daughter-boards, some
analog/digital converters (ADC’s), some digital/analog converters (DAC’s), a central
pro-cessor unit, a computer interface and a power supply. The Figure 3.2 shows the basic
architecture of the USRP first motherboard model (USRP1).
There is a family of models of motherboards having different configurations listed on
Table 3.1 and a family of daughter-boards also having different configurations listed on
Figure 3.2: USRP1 motherboard architecture
Table 3.1: USRP Motherboards Family
Model Channel Interface BW DAC ADC Cost US
N200* 1 Tx/Rx GigE 50 16-bit,400 M sps 14-bit,100 M sps $1,500 N210* 1 Tx/Rx GigE 50 16-bit,400 M sps 14-bit,100 M sps $1,700 E100 1 Tx/Rx Emb.* 4-8 14-bit,128 M sps 12-bit,64 M sps $1,300 E110 1 Tx/Rx Emb.* 4-8 14-bit,128 M sps 12-bit,64 M sps $1,500 USRP1* 2 Tx/Rx USB 2 16 14-bit,128 M sps 12-bit,64 M sps $700
B100 1 Tx/Rx USB 2 16 14-bit,128 M sps 12-bit,64 M sps $650
Table 3.1 keys:
* = MIMO capable;
BW = Bandwidth in MHz using 16-bit sample; and
Table 3.2: USRP Daughter-boards Family
Model Type Frequency BW Power out Noise (dB) Cost US
TVRX2 Rx 50-860 MHz 10 n/a 4-10 $200
RFX900 FD 750-1050 MHz 30 200 mW 5-10 $275
RFX1200 FD 1150-1450 MHz 30 200 mW 5-10 $275
RFX1800 FD 1.5-2.1 GHz 30 100 mW 5-10 $275
RFX2400 FD 2.3-2.9 GHz 30 50 mW 5-10 $275
WBX FD 50 MHz-2.2 GHz 40 100 mW 5-10 $450
SBX FD 400 MHz-4.4 GHz 40 100 mW 5-10 $475
XCVR2450 HD 2.4-2.5 GHz 33 100 mW 5-10 $400
DBSRX2 Rx 800 MHz-2.35 GHz 1-60 N/A N/A $150
LFTX 2 Tx DC-30 MHz 60* 1 mW N/A $75
LFRX 2 Rx DC-30 MHz 60* N/A N/A $75
Basic Tx 2 Tx 1-250 MHz 100* 1 mW N/A $75
Basic Rx 2 Rx 1-250 MHz 100* N/A N/A $75
Table 3.2 keys:
*Only when the two ports are used as a complex pair;
FD = Full-Duplex;
HD = Half-Duplex; and
BW = Bandwidth in MHz;
From Table 3.1 the USRP1 model was chosen for two main reasons:
• 1) low-cost; and
• 2) two transmitter and two receiver sides which allows two modes of operation:
four communication channels: two single transmitter and two single receiver;
two communications channels: one complex transmitter and one complex
re-ceiver.
The USRP1 motherboard, which is depicted on Figure 3.3 [13] has a FPGA model
EP1C12 responsible for the coordination of activities like adjusting the signals’
transmis-sion (interpolation) or reception (decimation), data flow control, intermediate frequency
shift from/to baseband, high-speed operations like digital up/down conversions and so
on.
The main parts of this motherboard are the four high-speed ADC’s with a resolution
high-Figure 3.3: USRP1 motherboard
speed DAC’s with a resolution of 14-bits per sample sampled at a rate of 128 Msps. The
ADC’s and DAC’s are directly connected to the FPGA which uses an USB 2.0 interface
to connect with a computer that has the GNU Radio software running on it [13].
It’s interesting to note that the FPGA includes the digital down converters (DDC’s) in
the Rx path. They’re implemented with 4 stages cascaded integrator-comb (CIC)
high-performance filters and 31 tap half-band filters cascaded with these CIC’s for spectral
shaping and out of band signals rejection.
The basic function of the DDC is to down-convert the incoming signal’s frequency from
Intermediate Frequency band (IF) to baseband., after that it also decimates the signal in
order to adapt the ADC sample rate to fit the USB 2.0 data rate limitation. At the Tx
sample rate for the DAC and later convert it from baseband to IF band delivering the
resultant signal to the DAC. Part of the DUC’s, the CIC interpolators are inside FPGA
but all the rest, including frequency up-converters (complex multipliers) are inside the
DAC chip [13].
It isn’t explicated on Table 3.1 nor on Table3.2, but the USRP1 can operate on
Full-duplex mode with its four RF channels (two full-Full-duplex systems) and the only constraint
is that the USB 2.0 total data rate must be considered, this is, the sum of the amount of
all Tx and Rx paths must be 32 M Bytes per second (Bps) or less.
Another particularity of the USRP1 module is that it uses complex sampling, this
implies that all the USRP internal and the transmitted and received signals are in complex
format and each sample sent over the USB interface is composed of its real and imaginary
part, 16-bits or 8-bits each, resulting in a 4-bytes or 2-bytes size complex sample.
The total received or transmitted rate by the USRP1 through the USB interface using
4 B complex-sample size is:
32 M Bps
4B per complex sample = 8 M complex samples per second (3.1)
These samples are complex with real and imaginary parts, so the Nyquist sample rate
of 8 M complex samples per second (8 Msps from real branch and 8 Msps from imaginary
branch) allows the acquisition of an effective maximum complex bandwidth of 8 MHz
(4 MHz real and 4 MHz imaginary) [13],[25],[27]. On Table 3.1 the BW value of 16
MHz is achieved by the trade-off between bandwidth and precision when the sample size
is reduced from 16-bits to 8-bits each, which gives a 2 bytes complex sample. A little
bit more about the USRP complex sampling, data rates and bandwidth are detailed on
Chapter 6.
In order to allow the communication between any USRP module and the real external
world there are the daughter-boards which are responsible for implementing the RF Front
End of the SDR system on the Part 1 of the Figure 3.1. Its main function is to implement
a connection with an external antenna and to syntonize the on-board local oscillator
as nearest as possible to the target frequency for transmission, shifting the baseband
spectrum to a higher desired frequency or for reception where the high frequency signal
Some of the daughter-boards have two connectors on the same board to be used as
a complex pair, like in the LFTX, LFRX, Basic Tx and Basic Rx shown respectively on
Figure 3.4. These are the models used for all the prototypes tests described on this text.
As seen on Table 3.2, each model is responsible for covering an specific frequency range of
the spectrum. However, the range covered by each one of them is very wide and different.
But there is a common range between them allowing that applications become realizable
using more than one daughter-board like the ones which operates on the frequency range
from 1 MHz up to 30 MHz considering these four different models.
3.3
The software module GNU Radio
The GNU Radio is the software that implements the Part 2 (software) on Figure 3.1.
It’s an open source license-free development tool kit which runs on Linux Ubuntu and
implements the software radios using a readily-available, low-cost external RF hardware,
like USRP module’s family. It is widely used in academic and commercial environments
to support wireless communications research as well as to implement real-world radio
systems [6].
It can be downloaded from [7]. The installation guide can be found on [8]. It’s licensed
under the GNU General Public License (GPL) version 3. All of the code is copyright of
the Free Software Foundation.
There is also other paid software solutions like LabVIEWTM
running on Windows
XP/Vista/7 and SimulinkR inside MATLABR which offers support for Windows, Linux
and Mac platforms [27].
The GNU Radio implements a communication system through some baseband
pro-cessing blocks that were previously programmed to implement the desired functions like
modulation, demodulation, filtering, coding, decoding, frequency up or down conversions,
signal generators, equalization, synchronization, USRP interfacing and many others. Each
of these blocks has some configurable parameters which must be set correctly in order to
meet the design requirements and the USRP constraints. This software can handle only
digital data, so analog hardware is used to convert this data between analog and digital
and to shift the signals to the desired central frequency. That requirement aside, any data
type can be passed from one block to another - like bits, bytes, vectors, bursts or more
complex data types.
Some basic blocks are standard installed, but if it’s necessary to add new or customized
blocks its completely possible and feasible.
The concept behind GNU Radio communication systems relies on the flow graph
prin-ciple in which some information is got from the source(s) block(s), then goes through a
processing chain made from one or more processing blocks and finally gets out through
the sink(s) block(s). Each processing block is implemented using C++ coding because
of the performance-critical signal processing path and joint with a special ‘coding glue’
implemented through Python scripts which are, in fact, the source code of the
example of Python script is shown on Figure 3.6.
Figure 3.5: GNU Radio development layer stack
To make the building of a communication system simple, faster and intuitive, along
with the GNU Radio comes a graphical interface software called GNU Radio Companion
(GRC). This tool allows to build the systems in a visual drag-and-drop mode based on the
blocks flow graph concept. After choosing all the processing blocks, setting each one of
their parameters and linking all the blocks, for the communications system start working
it must be ran from GRC. The first event of the GRC is to create a Python script based
on the flow graph and deliver it to GNU Radio. From now on, the processing will run
normally by GNU Radio since all the parameters had been set correctly.
Also, it’s possible to create a complete communication system through command lines
directly at the Linux terminal using the same GNU Radio processing blocks, however, it
will be more difficult and take too long.
On Figure 3.7 there is a GRC flow graph designed to implement a Wideband FM
Transmitter using GNU Radio. It’s possible to see some processing blocks like the source,
low-pass filter, band-pass filter, frequency modulator, sink, among many others. Also it
is important to note the source and sink blocks. The source blocks can feed the signals
into the communication system and can be a local file source or a signal generator, also
they can be combined with many others. The sink blocks are the output blocks which
are responsible for implementing the interface with the hardware module, like the USRP,
where the virtual processed signals meet the real world and come to reality.
Through the flow graph is possible to connect some signal analyzers like oscilloscope
fre-Figure 3.6: Python script
is to record the received signals, also from different points of the system. Some of the
configurable parameters can be set during the execution of the system
3.4
Final considerations of this chapter
This chapter gave a basic insight on the SDR concept, the GNU Radio software and
the USRP hardware module.
The next chapter will describe the design of the frequency response amplitude
ac-quisition prototype. This prototype allows the acac-quisition of the frequency response of
an electronic circuit using the SDR concept. A customized software based on GNU
Ra-dio software was completely designed to perform all the required tasks using the USRP
Chapter 4
A low-cost electronic circuit
frequency response amplitude
acquisition prototype
This chapter describes the development of a prototype for frequency response
am-plitude acquisition of electronic circuits. The prototype uses the software defined radio
concept and is composed by two main parts: the communication system software based
on GNU Radio and the USRP hardware module.
4.1
Objective
The main objective of this prototype development is to create a low-cost tool for
acquisition of the frequency response amplitude of an external electronic circuit. In this
text the external electronic circuit under test is the PLC-USRP interface. It’s important
to know exactly the attenuation level of such device through the PLC operating frequency
range and to make any correction if necessary while using the interface on future PLC
signal analyzer systems.
The second objective is to use this prototype to acquire the frequency response
ampli-tude of the transceiver system itself, in order to know the frequency response ampliampli-tude
of all the different possible configurations allowed with the four USRP daughter-boards
used. With the transceivers’ frequency response amplitude it’s possible to choose the
through the entire frequency range to be used on the acquisition of the frequency response
amplitude of the interface [12].
The four daughter-boards used are the following: BasicTx and BasicRx both covering
the 1-250 MHz range and LFTX and LFRX both covering the DC-30 MHz. Even though
they cover a very wide and different frequency range, there is a common range between all
of them, allowing that transmission and/or reception applications can be deployed using
more than one configuration. This fact justifies that a comparative study between the
frequency response amplitude of the four different transceiver system configurations be
done.
4.2
The prototype
Basically, the frequency response amplitude acquisition prototype must transmit a
frequency varying signal to the device under test, syntonize the current transmission
fre-quency at the receiver and finally, read and save the measured level of the received signal.
When acquiring the PLC-USRP interface frequency response amplitude, the interface is
connected between the transmitter and the receiver. But as the first tests will be the
ac-quisition of the transceiver response, the transmitter and receiver are connected directly.
Using the SDR concept, most part of the prototype is software-based, developed on
GNU Radio, and only the RF interface and sampling are done using the USRP hardware
module. The first part of the prototype is the transmitter side and is the most simple.
The second part is the receiver side, which is a little more complex. Both were developed
on GRC using the GNU Radio processing blocks and some additional Python codes [12].
The prototype was developed based on the USRP model USRP1 and on the software
GNU Radio v.3.2 installed on the Ubuntu 10.04 LTS.
4.2.1
The transmitter path
The transmitter major objective is to make the frequency sweep. It is composed
by two software processing blocks: the signal generator block, known as Signal Source
and the USRP interface block known as USRP Sink. The signal generator block allows
the generation of some different kinds of waveforms at a maximum frequency which is