Using moran's I to plan poten al regional avia on
airports: The case of Brazil
Luciano Lopes de Azevedo Freire1, Alan Ricardo da Silva2 1Agência Nacional de Aviação Civil, ANAC, [email protected] 2Universidade de Brasília, UnB, [email protected]
Recebido:
2 de maio de 2017
Aceito para publicação:
5 de novembro de 2017
Publicado:
30 de abril de 2017
Editor de área:
Anderson Ribeiro Correia
ABSTRACT
Budget constraints pose a challenge for the decision maker in transporta on, which is how to priori ze those projects that are more likely to have tangible results. That can be said for the case of determining airports that are more likely to be viable for having air-line services. Having a method that aids transporta on planner to iden fy loca ons where poten al for regular airline service lies is therefore fundamental for planning where part of the budget for airport investment for regional avia on, for instance, will go. This ar cle uses the spa al sta s c method of Moran´s I for the variable “interstate bus trips generated by municipali es” to iden fy loca ons with poten al to have regular airline service, using data of Brazilian interstate bus trips from 2005 to 2014, because this sta s c is widely used for spa al correla on analysis. An online survey was also conducted with the Brazilian airlines, asking them about their interest in opera ng in any of 40 airports, which had no regular airline service un l the end of 2015. Using the data gathered from the survey applied to airlines and road trips generated by all 5565 Brazilian municipali es from 2004 to 2015, it could be noted that loca ons of interest pointed out by airlines were in regions considered either in High-High or High-Low Mo-ran quadMo-rants. This result shows that MoMo-ran’s I is a good planning tool for iden fying places with poten al to commercial flights, because the loca ons pointed out by Mo-ran’s I were the same pointed out by the Brazilian airlines companies.
RESUMO
Restrições de custo são um desafio para o tomador de decisão em transportes, que pre-cisa priorizar aqueles projetos que são mais prováveis de alcançar os resultados proje-tados. Esse pode ser o caso de determinar aeroportos que são mais prováveis de terem serviços de companhias aéreas. Por isso, ter um método que auxilia o analista de trans-portes a iden ficar locais com potencial para serviços regulares de aviação é fundamen-tal para o planejamento. Esse ar go u liza a estaGs ca I de Moran para a variável “via-gens de ônibus geradas pelos municípios” para iden ficar locais com potencial para ter serviços regulares de aviação, u lizando dados de viagens geradas por ônibus de 2005 à 2014, porque essa estaGs ca é amplamente u lizada para analisar correlação espacial. Uma pesquisa online com as empresas aéreas também foi feita, perguntando se elas teriam interesse em operar em qualquer um dos 40 aeroportos, que não tem serviço regular de aviação até o final de 2015. U lizando os dados da pesquisa aplicada às com-panhias aéreas e as viagens rodoviárias geradas por todos os 5565 municípios brasileiros de 2004 a 2015, pode-se verificar que as localidades de interesse das companhias aéreas foram as regiões consideradas pelos quadrantes Alto-Alto e Alto-Baixo do Moran Map. Esse resultado mostra que o índice I de Moran é uma boa ferramenta de planejamento para iden ficar localidades com potencial para voos regulares, uma vez que as regiões potencias indicadas pelo indicador foram as mesmas indicadas pelas empresas.
Keywords:
Moran’s I, Airport planning, Regional avia on.
Palavras-chaves: I de Moran, Planejamento aéreo, Aviação regional. DOI:10.14295/transportes.v26i1.1369
1. INTRODUCTION
Airports are important assets for any country because they connect people and cities and thus contrib-ute for integrating economies as well. There are many studies showing the importance of airports around the world: Green (2007) has shown that there is a positive relationship between airports andthe economic development of a city; Marazzo et al. (2010) studied the relationship between air passen-ger demand and economic growth in Brazil, and veri(ied they are cointegrated; Fernandes and Pacheco (2010) also found positive correlation between air passenger demand and economic growth; Hakim and Merkert (2016) focused their study in low-income countries in South Asia and also found evidence be-tween air passenger demand and the Gross Domestic Product (GDP). Airports are strategic and are an ingredient in regional development (Percoco, 2010), and therefore it makes sense for a country to invest in such infrastructure. Nevertheless, if investments in air trans-portation are not correctly directed, the expected output (economic development of a region) may not occur (Hakim and Merket, 2016). That is why selecting airport location correctly is important to cor- rectly direct public investment (Percoco, 2010), and avoid results and may not return to society the ex-pected result, such as the example of some Spanish airports, which received huge public investments and produced no results in terms of air passenger demand (Hakim and Merket, 2016). In this sense, this paper aims to verify whether the use of Moran’s I statistic is suitable to predict those locations with potential to have regular airline services by a case study in Brazil.
2. REGIONAL AIRPORTS: THE CASE OF BRAZIL
In an immense country such as Brazil, airports play a fundamental role in connecting all of its regions (Silva, 1990). Despite most of the country´s transportation activity being road-related, airports play a signi(icant role in proving access to remote regions, such as the small communities in the Brazilian Am-azon region to more developed urban centers. The number of passengers transported by airline companies in Brazil has increased substantially, especially in the 2000 years. According to the Brazilian Civil Aviation Agency – ANAC, there was a growth of 142% in the number of airline passengers per 100 inhabitants in 10 years, jumping from 22.8% in 2004 to 55,1% in 2013 (ANAC, 2013). For long distance interstate travels, air transportation is quite competitive with road passenger transportation, and as an example, in 2013, 59.38% of all passengers from interstate trips were transported by an airline company, whereas passengers transported on buses represented 40.62% (ANAC, 2013; Silva, 2012). This is a major change, when compared to the 27.93% of (lying passengers in 2004 (ANAC, 2013), showing how important the aviation system is to a continen-tal country like Brazil. Despite the Chinese-rate growth of the air-transported passengers in Brazil (McKinsey&Company, 2010), the same cannot be said of the number of airports served by airlines. After the de-regulation of aviation markets in the 1990´s the air-transported passengers in Brazil increased, but also decrease the number of airports served by airlines companies, which fell from over 300 in the 1980´s to less than 150 in the 2000´s (Oliveira, 2007). With no subsidies to the airlines, they started concentrating on pro(itable routes and airports with better infrastructure to serve (lights (Oliveira, 2007). The negative side is that regional aviation was compromised, and now the country has to (ind ways to reverse this decrease. In order to develop regional airports, the Civil Aviation Secretariat – SAC, a branch of the Brazilian Ministry of Transportation, launched in 2012 the Regional Aviation Program. The main objective of this program is to enhance connectivity between Brazilian regions, especially the Amazon region. When it was launched, the plan was to invest R$ 7.3 billion (approximately US$ 2.3 billion) in 270 airports all over the country. The idea was to guarantee that 40 million people would be no farther than 100km from an airport (SAC, 2016). Therefore, (inding a method to correctly locate regional airports is important in the context of na-tional network (Redondi et al., 2013), and to make sure public investment will not be wasted in airports that will not provide the expected development in a region.
3. THE CHOICE FOR MORAN’S I IN LOCATING POTENTIAL AIRPORTS
Being one of the most used tool for spatial correlation analysis, Moran’s I was chosen for being relatively easy to use, with useful results (especially for transport planner, when making a decision as where to prioritize investments). The Moran’s I is useful to determine whether or not certain attributes in a two dimensional plane affect attributes with the same characteristics, meaning they exhibit spatial autocor-relation (Drück et al., 2004). Moran’s I is calculated as follows: 1 1 2 1n n ij i j i j n i i
n
w z z
I
z
= = ==
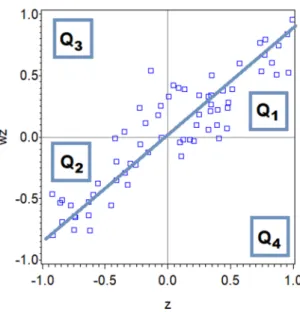
(1) In Equation (1), n is the number of evaluated sites or regions, zi is the difference the evaluated region i and the mean of all regions; and wij is a weighed value based on the relation between regions i and j (usually 1 when analyzed regions share borders and 0 otherwise). In matrix notation, Moran’s I is writ-ten as: ′ (2) where (x is the variable in analysis) and is a matrix of spatial dependence, with each element represented, in general, by 1 when analyzed regions share borders and 0 otherwise. Using this parametrization, this matrix is known as contiguity matrix. Also, is common to use this matrix as a row standardized matrix, i.e., each row sums to 1. When results are normalized and compared one to another, they can take place in 4 quadrants known as Moran Scatterplot (Figure 1): Q1 or High-High, if the location has an attribute higher than the average and its neighboring also has attributes higher than the average; Q2 or Low-Low, if the location has an attribute lower than the average and its neighboring also has attributes lower than the average; Q3 or High-Low, if the location has an attribute higher than the average and its neighboring has attributes lower than the average; and Q4 or Low-High, if the location has an attribute lower than the average and its neighboring has attributes higher than the average. When these results are placed on a map (Known as Moran map), it is possible to identify those regions where chosen variable/attribute is high, and where it is low.
Figure 1. Example of a Moran Scatterplot
In practical terms, transport planner can select a variable, or group of variables related to air passen- ger demand, to de(ine areas throughout a region, and calculate Moran’s I. The results vary from -1 (neg-ative spatial autocorrelation) to +1 (positive spatial autocorrelation). Air passenger demand studies
usually consider GDP as the main variable, or most signi(icant variable, but other variables can also be taken into account (Fernandes et al., 2014). Percoco (2010), for instance, used an econometric method, which took Moran’s I into account, to analyze correlation between variables such as level of education, college, etc. with the passenger/(light movement and level of employment in service area in Italian re-gions. His study concluded that airports do increase activities in cities (as long as cities chosen to bear airports are carefully planned). In this study, the variable chosen for using in Moran’s I calculation was the number of “Bus Trips Generated by Municipalities”, because as was seen by Silva (2012), air transportation is quite competi- tive with road passenger transportation in long-distance interstate trips. Thus, we are using the data-base gently provided by the National Land Transport Agency (ANTT) about the generated interstate bus trips between 2005 and 2014 in all regions of Brazil. In addition, this variable was chosen because it is a simple way to measure potential users for air transportation.
4. METHODOLOGY
In order to verify whether Moran’s I is a suitable method to determine potential airports for having reg-ular airline service, the following methodology was applied: Step 1: 40 airports not served by airlines in 2015 (but sometime between 2005 and 2014 had airline services on them), were chosen out of a list of airports selected for governmental investment from the Brazilian Bureau for Civil Aviation Development (SAC, 2016). See Appendix A for the list of the 40 air-ports chosen for this study. Step 2: An online survey was developed and applied to the 10 airlines in Brazil, which operated reg-ular scheduled domestic (lights in 2016. In such survey, these airlines were asked if they were interested in operating in any of the 40 locations selected in step 1. Step 3: A comparison between step two results (observed results) and Moran’s I results (by using Moran Scatterplot) need to be done. To do that, all interstate bus trips generated by Brazilian cities be-tween 2005 and 2014 were obtained from ANTT’s database (ANTT, 2015) (ANTT is the Brazilian agency responsible for road transportation regulation). Step 4: By using software SAS 9.4 on the interstate bus trips generated by Brazilian municipalities between 2005 and 2014, Moran’s I was calculated and Moran maps with its results based on the Moran quadrants were created (Note that any Geographic Information Systems (GIS) software can compute Moran’s I and Moran Scatterplot). Target airports were placed on the maps in order to make a compari-son between Moran’s I results and the results observed in the survey. The results were also placed on a frequency table to better compare Moran’s quadrant with survey results of airports with potential to receive regular airline service (quadrants High-High and High-Low). Step 5: Case studies with 5 airports undergoing the ANAC’s certi(ication process was made to check if these airports are either Q1 or Q3 airports. The list of airports and process number was obtained from ANAC by sending a request to e-mail [email protected]. According to ANAC’s RBAC (Brazilian Civil Aviation Regulation) 139 rule for airport certi(ication (ANAC, 2015), an airport can only operate regular airline (lights if successfully completing the certi(ication process. The informed airports had no regular airline service before 2015.5. RESULTS
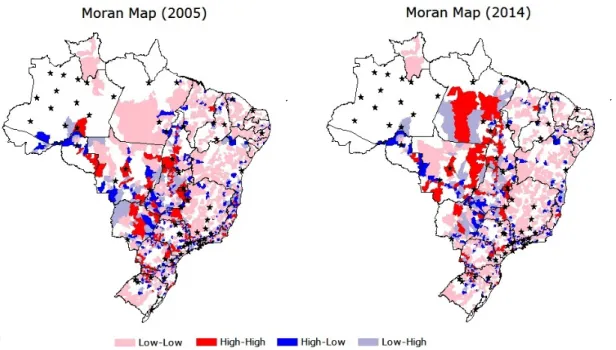
After having used the software SAS 9.4 on ANTT database of generated interstate bus trips between 2005 and 2014, Figure 2 shows the results for year 2005 and 2014. A total of 53 airports are represented by stars (40 of these airports are the target study group and the others 13 airports from the states of Pará and Amazonas, both in the amazon region, were included on the Moran maps just to show that they exist but we cannot use them because there are no bus trip generated from these locations). We can see in Figure 2 that in general, the municipalities are classi(ied in Low-Low Moran’s quadrant,and that the municipalities classi(ied in High-High quadrants are in the central region and in the south of Brazil. In the other hand, the municipalities classi(ied in High-Low quadrants are scattered around Brazil. The Moran’s I in 2005 was 0.13 and in 2014 it was 0.24, showing a low spatial dependence, but out interest is in the classi(ication of the municipalities in the Moran’s quadrant.
Figure 2. Moran Maps for Interstate Bus Trips generated by Brazilian municipalities in 2005 and 2014 A homogeneity test was conducted between the whole time series and the most recent result (in 2014), in order to verify if the series results were stable enough to consider only one year to compare with the results from the online survey with airlines, instead of using all series results to draw any con-clusion from the model. Table 1 shows the frequency of 2014’s result and the most common Moran’ quadrant found in time series from 2005 to 2014 (most common quadrant is the one that is shown in more than 50% of the series. See Appendix B).
Table 1: Frequency of results in terms of airports per Moran’s quadrant
Moran’s Quadrant Number of Airports per Moran’s quadrant in 2014
Number of Airports per Moran’s quadrant in Most Common Value of Moran of the Time Series
High-High 3 5
High-Low 14 14
Low-High 8 8
Low-Low 13 11
The p-value for test for 3 (three) degrees of freedom was 0.8348. According to Walpole et al. (2009), this result indicates strong probability of homogeneity between pairs. In this case, it makes sense to use one time series result to gather conclusions from the system behavior over time. It also makes transport planner’s life easier as only the results from a year is necessary to determine potential airports, from the number of interstate bus trips generated by cities. After having checked that most recent time series results (2014 results) can be used, for the drawing conclusion on the viability of using Moran’s I (quadrant) to determine potential airports for regular air-line service, a frequency table (Table 2) was made, with the number of airports per Moran’s quadrant, the number of interests airlines pointed for study target airports in each of the Moran’s quadrant and
the average number of airlines interested in (lying to location in each Moran’s quadrant – which is cal- culated by dividing the number of positive answers from airlines with the number of airports per corre-sponding quadrant. From 10 Brazilian airlines companies, 6 have answered the survey and they have showed interest in (lying to 37 locations. In Table 2, we found only 37 locations because one of them have showed interest in (lying to Maués/AM, but this location is not included in our analysis because there are not register in the interstate bus trip database.
Table 2: Average number of interested airlines in flying to location per Moran’s quadrant
Moran’s Quadrant Airport per Quadrant in 2014
Number of airline posi?ve answers per Quadrant
Average number of Airlines interested in flying to airports per Quadrant
High-High 3 7 2.333 High-Low 14 15 1.071 Low-High 8 7 0.875 Low-Low 13 7 0.538 Total 38 37 As expected, the highest frequency of Moran’s I quadrant is also the highest frequency of interesting of an airline in operating a regular (light service in that location. If considering that an airport is viable for regular airline service if at least one airline intends to (ly there, then airports in quadrants High-High (Q1) and High-Low (Q3) ful(ill this requirement. Transport planner, consequently, can determine which locations are eligible for receiving investments by using Moran’s I for the attribute “bus trips generated by municipalities”, without having to interview airlines.
5.1 Adequacy of Moran’s I to Real Cases (Comparing Moran’s I Results to Real Cases)
The (inal step was to put Moran’s I in test before real cases of airports that recently started having regular airline service. The list of airports was obtained after consulting ANAC. According to ANAC, 5 ((ive) airports managed to have their certi(ication completed in 2016. The rea-son for choosing these airports is that since December of 2015, Brazilian regulation RBAC 139 states that if an airport not served by airline services until the publication of the regulation desires to have such type of operation, a certi(ication process must be done. In this sense, airports without previous operations could be tracked. These airports, as well as their corresponding Moran’s quadrant in 2014 are shown in Table 3.
Table 3: Airports that completed their certification process in 2016 to be able to have regular airline service
Airport/ ICAO Code
Cer?fica?on Process Number in ANAC
Moran’s quadrat associated to the airport in 2014
Number of weekly flights approved to operate in loca?on aFer cer?fica?on process (ANAC, 2016)
Sorriso Airport/MT (SBSO) 00058.027386/2016-15 High – High 6 Lages Airport /SC (SBLJ) 00058.028765/2016-14 High – Low 6 Ponta Grossa Airport/PR (SSZW) 00058.076075/2016-71 High – Low 6 Barra do Garças Airport /MT (SBBW) 00058.083094/2016-54 High – High 6 Santo Ângelo Airport/RS (SBNM) 00058.056414/2016-01 High – Low 6
The results above show that 100% of airports that started having regular airline operations are in either High-High Moran’s quadrant or High-Low Moran’s quadrant, as expected. We can conclude that using Moran’s I to (ind out locations where airline service is viable and, therefore, useful and valid for planning and prioritizing airports in terms of investment in infrastructure.
6. CONCLUSIONS AND DISCUSSIONS
The objective of this study was to verify if the use of Moran’s I statistic (Moran’s quadrant), which is a spatial correlation between variables, is a good planning tool for determining airports with potential for
regular airline service. The chosen variable to analyze that was the number of interstate bus trips gen- erated by municipalities and the database used was the one available in ANTT´s website, where the reg-ister of interstate bus trips generated by Brazilian cities between 2005 and 2014 was available. This variable was chosen because it is a simple way to measure potential users for air transportation in rela-tion to desire of the Brazilian airlines companies for (lying to these locations. By using Moran’s I, and having results placed in one of the four quadrants (High-High, High-Low, Low- High and Low-Low) it would be possible to identify theoretical potential airports for regular airline ser-vice. An online survey with the Brazilian airlines, asking them about their interest in operation in 40 different locations that did not have airline service prior to 2016, provided results of which cities pro- vided more interest from the airlines companies. After crossing these survey results on Moran´s quad-rant results, it was veri(ied that airports in High-High Moran’s quadrant provided more interest from the airlines, followed by High-Low Moran’s quadrant. These results indicate that using Moran’s I with the variable “number of interstate bus trips generated by municipalities” is useful for determining those locations where investments on the airports are more likely to provide results, in terms of regular airline service and the desire of airlines companies for (lying to there. Nevertheless, limitations in this study have also been identi(ied. As Low-High and Low-Low results did not result in null results – which leads to the question ‘Why did an airline show interest in an airport in either one of these Moran’s quadrants?’, it can inferred that more precise results could probably be obtained if other variables were added to the model. Future studies could also be held on trying to determine transshipment rate of those airports in High-Low areas (High-Low areas are those that develop their neighboring areas, i. e., the passengers arriving or leaving from those airports would not necessarily remain in the airport’s municipality, but also they are going to the surrounding cities/towns). REFERENCES Abreu e Silva, J.; Gonçalves, J.; Correia, M. D. F. and Marreiros, S. (2015) Airport Planning Process. The case of the new Lisbon Airport. Finisterra, v. 50, n. 99, p. 63-79. DOI: 10.18055/Finis4119 Allroggen, F. and Malina, R. (2014) Do regional growth effects of air transport differ among airports?. Journal of Air Transpor-tation Management, v. 37, p. 1-4. DOI: 10.1016/j.jairtraman.2013.11.007 ANAC (2015). Agência Nacional de Aviação Civil. Regulamento Brasileiro de Aviação Civil - RBAC nº 139, Amendment- 05. Cer- ti(icação Operacional de Aeroportos. Available at: <www.anac.gov.br/assuntos/legislacao/legislacao-1/rbha-e-rbac/rbac/rbac-139-emd-05>. (Access in 17/09/2015). ANAC (2013). Agência Nacional de Aviação Civil. Relatório Estatı́stico Anual do Transporte. Available at: <www.anac.gov.br/assuntos/dados-e-estatisticas/anuario>. (Access in 18/05/2015). ANTT (2015). Agência Nacional de Transportes Terrestres. Consulta Horário de Transporte de Empresa. Available at: <www.antt.gov.br/passageiros/Detalhamento-de-linhas-horarios-e-itinerarios.html>. (Access in 28/09/2015). Andrew, D. (2012) Institutional policy innovation in aviation. Journal of Air Transport Management, v. 21, p. 36-39. DOI:10.1016/j.jairtraman.2011.12.015 BNDES (2002). Banco Nacional de Desenvolvimento Econômico e Social. Aviação Regional Brasileira (Modal Aéreo IV). Re- vista Informe Infra-Estrutura, v. 50, p. 1-9. Available at: <http://www.bndes.gov.br/SiteBNDES/export/sites/de-fault/bndes_pt/Galerias/Arquivos/conhecimento/infra/Inf02-50.pdf>. (Access in 23/08/2015). Brütsch, U. (2014) Comment – International airport management: The government perspective. Airport Management, v. 8, n. 2, p. 100-104. Dewey, O. F. and Davis, D. E. (2013) Planning, Politics, and Urban Mega-Projects in Developmental Context: Lessons from Mex-ico City´s Airport Controversy. Journal of Urban Affairs, v. 35, n. 5, p. 531-551. DOI: 10.1111/juaf.12012 Drück, S., Carvalho, M.S., Câmara, G., Monteiro, A.V.M. (2004). Análise Espacial de Dados Geográ(icos. Brası́lia: EMBRAPA. Conover, W.J. (1999). Practical Nonparametric Statistics. 3rd Edition. U.S.A: Wiley. Fernandes, E.; Pacheco, R. R. and Braga, M. E. (2014) Brazilian airport economics from a geographical perspective. Journal of Transport Geography, v. 34, p. 71-77. DOI: 10.1016/j.jtrangeo.2013.11.003 Green, R. K (2007) Airports and Economic Development. Real Estate Economics, v. 35, p. 91-112. DOI: 10.1111/j.1540-6229.2007.00183.x Hütig, G.; Busch, W. and Gronak, N. (1994) Growing demand and capacity of Airports. Transport Research Part A, v. 28, n. 6, p. 501-509. DOI: 10.1016/0965-8564(94)90048-5 ICAO (1981). International Civil Aviation Organization. International Civil Aviation Convention. Available at: <https://www.icao.int/publications/Documents/7300_orig.pdf >. (Access 06/07/2015).
Hakim, M. M. and Merket, R. (2016) The causal relationship between air transport and economic growth: Empirical evidence from South Asia. Journal of Transport Geography, v. 56, p. 120-127. DOI: 10.1016/j.jtrangeo.2016.09.006 Humphreys, I. and Francis, G. (2002) Policy issues and planning of UK regional airports. Journal of Transport Geography, v. 10, n. 4, p. 249-258. DOI: 10.1016/S0966-6923(02)00040-6 Koo, T.T.R. and Lohmann, G. (2013) The spatial effects of domestic aviation deregulation: a comparative study of Australian and Brazilian seat capacity, 1986–2010. Journal of Transport Geography, v. 29, p. 52–62. DOI: 10.1016/j.jtrangeo.2012.12.011 Marazzo M.; Scherre R. and Fernandes E. (2010) Air transport demand and economic growth in Brazil : a time series analysis. Transportation Research Part E: Logistics and Transportation Review. v. 46, n. 2, p. 261–269. DOI: 10.1016/j.tre.2009.08.008 Martens, K.; Golub, A. and Robinson, G (2012) A justice-theoretic approach to the distribution of transportation bene(its: Im-plications for transportation practice on the United States. Transportation Research Part A. v. 46, n. 4, p. 684-695. DOI:10.1016/j.tra.2012.01.004 McKinsey & Company (2010). Estudo do Setor de Transporte Aéreo do Brasil: Relatório Consolidado. Available at: <http://ab-taer.org.br/wp-content/uploads/2018/03/E-3-2-16-Relatorio_consolidado.pdf>. (Access 10/08/2015). O´Connor, K. (2010) Global city regions and the location of logistics activity. Journal of Transport Geography, v. 18, n. 3, p. 354-362. DOI: 10.1016/j.jtrangeo.2009.06.015 Oliveira, A. V. M (2007) Regulação da oferta no transporte aéreo: do comportamento de operadoras em mercados liberaliza-dos aos atritos que emergem da interface público-privado. Journal of Transport Literature ,v. 1, n. 2, p. 22-46. Oliveira, A. V. M.; Lohmann, G. and Costa, T. G. (2016) Network concentration and airport congestion in a post de-regulation context: A case study of Brazil 2000-2010. Journal of Transport Geography, v. 50, p. 33-44. DOI: 10.1016/j.jtrangeo.2015.01.001 Percoco, M. (2010) Airport Activity and Local Development: Evidence from Italy. Urban Studies Journal Limited. v. 47, n. 11, p. 2427–2443. DOI: 10.1177/0042098009357966 Redondi R.; Malighetti P. and Paleari S. (2013) European connectivity: the role played by small airports. Journal of Transport Geography. v. 29, p. 86-94. DOI: 10.1016/j.jtrangeo.2013.01.010 SAC (2016). Secretaria de Aviação Civil. List of regional airports under SAC’s aviation development program. Available at: <http://www.aviacao.gov.br/assuntos/aviacao-regional/localizacao-aeroportos>. (Access in 15/01/2016). Silva, A. (1990). Aeroportos e Desenvolvimento. 1ª Edição. Editora Villa Rica. Silva, C. M. (2012). Comparativo entre a demanda dos transportes aéreo e rodoviário interestadual de passageiros. Estudo da Câmara dos Deputados. Available at: <http://www2.camara.leg.br/documentos-e-pesquisa/publicacoes/estnottec/areas-da-conle/tema14/2012_921.pdf>. (Access in 08/08/2015). Walpole, R. E.; Myers, R. H.; Myers, S. L. (2009). Probability and Statistics for Engineering and Sciences. 8th Edition - U.S.A: Prentice Hall (Pearson Group) Yang, Z.; Yu, S. and Notteboom, T. (2016). Airport location in Multiple Airport Regions (MARs): the role of lad and airside ac-cessibility. Journal of Transport Geography. v. 52, p. 98-110. DOI: 10.1016/j.jtrangeo.2016.03.007 Abreu e Silva, J.; Gonçalves, J.; Correia, M. D. F. and Marreiros, S. (2015) Airport Planning Process. The case of the new Lisbon Airport. Finisterra, v. 50, n. 99, p. 63-79. DOI: 10.18055/Finis4119
APPENDIX A – ONLINE SURVEY FOR AIRLINES
The link to the online survey is available at: https://docs.google.com/forms/d/e/1FAIpQLSc7O9198TN7_lRECMpob9aXvgQRRc-Ue3Z9yYj9sAm_KqNh4g/viewform The contents of such survey translated into English follow below: In the next the pages 40 airports that do not currently have regular airline service. For each one of them, choose whether your airline desires to operate in one of these locations. If the answer is ‘Yes’ to any airport, a list of obstacles will be shown to select the ones that currently impede the airline from oper-ating there. Is there interest in operating in …? 1.Rio Grande/RS 2.Bagé/RS 3.Santo Ângelo/RS 4.Santa Rosa/RS 5.Erechim/RS 6.Lages/SC 7.Bacacheri(Curitiba)/PR 8.Ponta Grossa/PR 9.Registro/SP 10.Itanhaém/SP 11.Sorocaba/SP 12.Jundiaí/SP 13.Bragança Paulista/SP 14.Ubatuba/SP 15.Guaratinguetá/SP 16.São Carlos/SP 17.Araraquara/SP 18.Barretos/SP 19.Resende/RJ 20.Varginha/MG ( )Yes ( ) No ( )Yes ( ) No ( )Yes ( ) No ( )Yes ( ) No ( )Yes ( ) No ( )Yes ( ) No ( )Yes ( ) No ( )Yes ( ) No ( )Yes ( ) No ( )Yes ( ) No ( )Yes ( ) No ( )Yes ( ) No ( )Yes ( ) No ( )Yes ( ) No ( )Yes ( ) No ( )Yes ( ) No ( )Yes ( ) No ( )Yes ( ) No ( )Yes ( ) No ( )Yes ( ) No 21.Juiz de Fora/MG 22.São João del Rei/MG 23.Carlos Prates (BH)/MG 24.Diamantina/MG 25.Paracatu/MG 26.Minaçu/GO 27.Gurupi/TO 28.Barra do Garças/MT 29.Tangará da Serra/MT 30.Lucas do Rio Verde/MT 31.Ponta Porã/MS 32.Ariquemes/RO 33.Maués/AM 34.Almerim/PA 35.Carolina/MA 36.Picos/PI 37.São Raimundo Nonato/PI 38.Sobral/CE 39.Mossoró/RN 40.Caruaru/PE ( )Yes ( ) No ( )Yes ( ) No ( )Yes ( ) No ( )Yes ( ) No ( )Yes ( ) No ( )Yes ( ) No ( )Yes ( ) No ( )Yes ( ) No ( )Yes ( ) No ( )Yes ( ) No ( )Yes ( ) No ( )Yes ( ) No ( )Yes ( ) No ( )Yes ( ) No ( )Yes ( ) No ( )Yes ( ) No ( )Yes ( ) No ( )Yes ( ) No ( )Yes ( ) No ( )Yes ( ) NoAPPENDIX B – MORAN’S QUADRANT RESULTS FOR TARGET LOCATIONS
Location 2005 2006 2007 2008 2009 2010 2011 2012 2013 2014 % of Most Common Result Most Common Result Number of Airline positive answer in online sur-vey Ariquemes/RO High-Low High-Low High-Low High-High High-Low High-Low High-Low High-Low High-Low High-Low 90 High-Low 1 Maués/AM - - - 1 Almerim/PA - - - 0 Lucas do Rio Verde/MT High-High High-High High-High High-High High-High High-High High-High High-High High-High High-High 100 High-High 3 Tangará da Serra/MT Low-High Low-High Low-High Low-High High-High Low-High Low-High Low-High Low-High High-Low 80 Low-High 2 Barra do Gar-ças/MT High-High High-High High-High High-High High-Low High-Low High-Low High-High High-High High-High 70 High-High 2 Carolina/MA Low-High Low-High Low-High Low-High Low-High Low-High Low-High Low-High Low-High Low-High 100 Low-High 0 Picos/PI Low-High Low-High Low-High Low-High Low-High Low-High Low-High Low-High Low-High Low-High 100 Low-High 0São Raimundo No-nato/PI Low-High Low-High Low-High Low-High Low-High Low-High Low-High Low-High Low-High Low-High 100 Low-High 1 Sobral/CE High-Low High-Low High-Low High-Low High-Low High-Low High-Low High-Low High-Low High-Low 100 High-Low 2 Mossoró/RN Low-Low High-Low Low-Low Low-Low Low-Low Low-Low High-Low High-Low Low-Low Low-Low 70 Low-Low 2 Caruaru/PE High-Low High-Low High-Low High-Low High-Low High-Low High-Low High-Low High-Low High-Low 100 High-Low 1 Minaçu/GO High-Low Low-Low Low-Low Low-Low Low-High Low-High Low-High Low-High Low-High Low-High 60 Low-High 1 Gurupi/TO High-High High-High High-High High-High High-High High-High High-High High-High High-High High-High 100 High-High 2
Ponta Porã/MS
Low-High Low-High Low-High Low-High Low-High Low-High Low-High Low-High Low-High Low-High 100 Low-High 3 Paracatu/MG High-High High-Low Low-High Low-Low High-High Low-High Low-Low Low-Low Low-Low Low-Low 50 Low-Low 1 Diamantina/MG Low-Low Low-Low Low-Low Low-Low Low-Low Low-Low Low-Low Low-Low Low-Low Low-Low 100 Low-Low 0
Carlos Prates/MG Low-Low Low-Low Low-Low Low-Low Low-Low Low-Low Low-Low Low-Low Low-Low Low-Low 100 Low-Low 0
São João Del Rei/MG Low-Low Low-Low Low-Low Low-High Low-High Low-High Low-Low Low-Low Low-Low Low-Low 70 Low-Low 0 Varginha/MG Low-Low Low-Low Low-Low Low-Low Low-Low Low-Low Low-Low Low-Low Low-Low Low-Low 100 Low-Low 2
Juiz de Fora/MG
High-Low High-Low High-Low High-Low High-Low High-Low High-Low High-Low High-Low High-Low 100 High-Low 3 Resende/RJ High-High High-High High-High High-High High-High High-High High-High High-Low High-High High-Low 80 High-High 0 Guaratinguetá/SP High-Low High-Low High-Low High-Low High-Low High-Low High-Low High-Low High-Low High-Low 100 High-Low 0 Ubatuba/SP Low-Low Low-Low Low-Low Low-Low Low-Low Low-Low Low-Low Low-Low Low-Low Low-Low 100 Low-Low 0 Bragança Paulista/SP Low-High Low-High Low-High Low-High Low-High Low-Low Low-High Low-High Low-Low Low-Low 70 Low-High 0
APPENDIX B – MORAN’S QUADRANT RESULTS FOR TARGET LOCATIONS
(con?nua?on) Location 2005 2006 2007 2008 2009 2010 2011 2012 2013 2014 % of Most Common Result Most Common Result Number of Airline positive answer in online sur-vey Sorocaba/SP High-Low High-Low High-Low High-Low High-Low High-Low High-Low High-Low High-Low High-Low 100 High-Low 0 Itanhaém/SP High-Low Low-Low Low-Low Low-Low High-Low High-Low Low-Low Low-Low Low-Low High-Low 60 Low-Low 0 Registro/SP High-Low High-Low High-Low High-Low High-Low High-Low High-Low High-Low High-Low Low-Low 90 High-Low 0 Barretos/SP High-High High-Low High-High High-Low High-Low High-High High-Low High-Low Low-Low Low-Low 50 High-Low 1 Araraquara/SP High-Low High-Low High-Low High-Low High-Low High-Low High-Low High-Low High-Low High-Low 100 High-Low 1São Carlos/SP
Low-High Low-High Low-High Low-High High-High Low-High Low-High Low-High Low-High Low-High 90 Low-High 0 Bacacheri/ PR High-Low High-Low High-Low High-Low High-Low High-Low High-Low High-Low High-Low High-Low 100 High-Low 1
Ponta Grossa/PR
High-High High-High High-High High-Low High-High High-Low High-Low High-Low High-Low High-Low 60 High-Low 1 Lages/SC High-Low High-Low High-Low High-Low High-Low High-Low High-Low High-Low High-Low High-Low 100 High-Low 2 Erechim/RS High-High High-High High-High High-High High-High High-Low High-Low Low-High Low-High Low-High 50 High-High 0
Santa Rosa/RS
Low-High Low-High High-Low High-Low Low-Low Low-High Low-Low Low-Low Low-Low Low-Low 50 Low-Low 0
Santo Ângelo/RS
High-Low High-Low High-Low High-Low Low-Low High-Low High-Low High-Low Low-Low High-Low 80 High-Low 2 Bagé/RS Low-Low Low-Low Low-Low - Low-Low Low-Low Low-Low Low-Low Low-Low Low-Low 100 Low-Low 1
Rio Grande/RS Low-Low Low-Low Low-Low - Low-Low Low-Low Low-Low Low-Low Low-Low Low-Low 100 Low-Low 1 TOTAL 37