Virgínia Mara Pereira Ribeiro(1), Fernanda Albuquerque Merlo(2), Gabriela Canabrava Gouveia(1),
Larissa Kretli Winkelstroter(1), Luíza Rodrigues Alves Abreu(1), Marcos Vinícius Gualberto Barbosa da Silva(3),
João Cláudio do Carmo Panetto(3), Leandro de Carvalho Paiva(4), Marcello de Aguiar Rodrigues Cembranelli(4)
and Fabio Luiz Buranelo Toral(1)
(1)Universidade Federal de Minas Gerais, Escola de Veterinária, Departamento de Zootecnia, Avenida Antônio Carlos, no 6.627, Caixa Postal 567, Campus Pampulha, CEP 31270-901 Belo Horizonte, MG, Brazil. E-mail: [email protected],
[email protected], [email protected], [email protected], [email protected] (2)Associação Brasileira dos Criadores de Zebu, Praça Vicentino Rodrigues da Cunha, no 110, Parque Fernando Costa, CEP 38022-330 Uberaba, MG, Brazil.
E-mail: [email protected] (3)Embrapa Gado de Leite, Rua Eugênio do Nascimento, no 610, Dom Bosco, CEP 36038-330 Juiz de Fora, MG, Brazil. E-mail: [email protected], [email protected] (4)Associação Brasileira dos Criadores de Girolando, Rua Orlando Vieira do Nascimento, no 74, CEP 38040-280 Uberaba, MG, Brazil. E-mail: [email protected], [email protected]
Abstract – The objective of this work was to determine whether the random regression model using linear splines (RRMLS) is suitable to estimate the genetic parameters for productive and reproductive traits of a multiple-breed dairy cattle population, as well as to investigate the effect of the genetic group of the progeny on the genetic merit of the sire. The multiple-trait model (MTM) and the RRMLS with one knot fitted for every genetic group were used to obtain the genetic parameters. Records of 1/2 Holstein + 1/2 Gyr (1/2HG), 5/8 Holstein + 3/8 Gyr (5/8HG), and 3/4 Holstein + 1/4 Gyr (3/4HG) crossbreed dams were considered. The RRMLS showed better fitting. The additive and residual variances estimated by the MTM and the RRMLS were similar. Heritability varied from 0.20 to 0.33 for age at first calving, from 0.09 to 0.22 for first lactation length, and from 0.15 to 0.35 for first lactation 305-day milk yield, according to the genetic composition of the dams. The RRMLS is suitable to estimate the genetic parameters for productive and reproductive traits of multiple-breed dairy cattle populations. The genetic merit of the sires is affected by the genetic group of the progeny by which they are evaluated.
Index terms: Gyr, heritability, heterosis, Holstein, selection.
Análise genética de características produtivas e reprodutivas
em populações multirraciais de bovinos leiteiros
Resumo – O objetivo deste trabalho foi verificar se o modelo de regressão aleatória com polinômios lineares do tipo spline (MRAPLS) é adequado para estimar os parâmetros genéticos de características produtivas e reprodutivas em uma população multirracial de bovinos leiteiros, bem como investigar o efeito do grupo genético da progênie sobre o mérito genético do touro. Foram utilizados o modelo multicaracterístico (Mult) e o MRAPLS com nós ajustados aos grupos genéticos, para obtenção dos parâmetros genéticos. Foram considerados os registros de vacas 1/2 Holandesa + 1/2 Gir (1/2HG), 5/8 Holandesa + 3/8 Gir (5/8HG) e 3/4 Holandesa + 1/4 Gir (3/4HG). O MRAPLS apresentou os melhores ajustes. As variâncias aditivas e residuais estimadas por Mult e MRAPLS foram semelhantes. As herdabilidades variaram de 0,20 a 0,33 para idade ao primeiro parto, de 0,09 a 0,22 para duração da primeira lactação e de 0,15 a 0,35 para produção de leite em até 305 dias na primeira lactação, de acordo com a composição genética das vacas. O MRAPLS é adequado para estimar parâmetros genéticos de características produtivas e reprodutivas em populações multirraciais de bovinos leiteiros. O mérito genético do touro é influenciado pelo grupo genético da progênie por meio do qual ele é avaliado.
Termos para indexação: Gir, herdabilidade, heterose, Holandesa, seleção.
Introduction
The success of a genetic breeding program depends
on the definition of the selection goals and on the choice
al., 2014) and adaptive traits (Berman, 2011). These crossings also contribute to increase the productive and economic performance of the production systems (Wolfová et al., 2007; Dal Zotto et al., 2009).
For more accurate genetic evaluations, differences in breed composition, in terms of additive and non-additive effects and of heterogeneous variances, should be taken into account (Cardoso & Tempelman, 2004; VanRaden et al., 2007). In addition, the interactions between the breeding value of the bull and the genetic group its progenies belong to are important to establish
breeding strategies aiming to obtain greater benefits
for future generations (Vallée et al., 2013; Lukaszewicz et al., 2015). Therefore, the genetic evaluation of multiple-breed populations may be improved when the
traits of each genetic group are specifically assessed.
Multiple-trait models (MTM) allow considering any characteristic (e.g., milk yield) as a distinct one in each group it is measured in. This approach has already been adopted in other studies (Vallée et al., 2013; Lukaszewicz et al., 2015) and allows detecting differences related to variances and covariances. However, these models tend to become more parameterized as the number of genetic groups increases. This parametrization may be reduced by using random regression models for multiple-breed genetic evaluations.
The use of a random regression model using linear splines (RRMLS) is an alternative for cases in which the MTM shows limitations. Misztal (2006) pointed out that polynomial splines can be used to adjust the effect of a continuous variable, such as the expected percentage of alleles of a certain breed. The author also found that the (co)variances of the polynomial
random regression coefficients are equivalent to those obtained for the traits evaluated in the levels defined
by the knot polynomials. That is, if the knots are positioned along the possible percentage values for the alleles of a certain breed (e.g., 0.0, 0.5, 0.75, and 1.0),
the (co)variances of the random regression coefficients
will be equivalent to the those between the trait evaluated in each animal and the breed group (in this case, 0.0, 0.5, 0.75, and 1.0). In the RRMLS, the knots can be positioned in points of interest or based on the statistical criteria analysis. Therefore, this model may be less parameterized than the MTM, when the (co) variances for some intermediary groups (with a small
number of observations) may be obtained through interpolation.
The objective of this work was to determine whether the RRMLS is suitable to estimate the genetic parameters for productive and reproductive traits of a multiple-breed dairy cattle population, as well as to investigate the effect of the genetic group of the progeny on the breeding value of the bull.
Materials and Methods
The phenotypic data were obtained from the milk
production services of Associação Brasileira dos
Criadores de Girolando and are part of the Brazilian archive on dairy cattle of Embrapa Gado de Leite.
The assessed traits were: age at first calving (AFC), first lactation length (FLL), and first lactation
305-day milk yield (305MY). Records of 1/2 Holstein + 1/2 Gyr (1/2HG), 5/8 Holstein + 3/8 Gyr (5/8HG), and 3/4 Holstein + 1/4 Gyr (3/4HG) crossbreed dams were used (Table 1).
The records considered were those of dams with AFC from 560 to 1,650 days, born from 1997 to 2010, which calved from 1998 to 2013. Data on lactations terminated due to low yield or to the start of calving were also taken into account, being considered within normality. Only data on contemporary groups with, at least, three records and female progenies of at least two sires were considered (Table 2). The contemporary groups were formed by the variables herd and birth year for AFC and herd and calving year for FLL and 305MY.
A MTM with three traits was used to analyze AFC, FLL, and 305MY. This way, the same one traits evaluated in the 1/2HG, 5/8HG, and 3/4HG genetic groups was considered as three distinct ones. The MTM may be represented by:
yijklmn =cgi+mj+b PHet1 k+b PHol2 l
+b age3 m+b age4 m2 +an+eijklmn
where yijklmn is the phenotype of the traits; cgi is the
effect of contemporary group i; mj is the effect of
month j (calving month for FLL and 305MY or birth month for AFC); b1, b2, b3, and b4 are the regression coefficients that adjust the heterozygosis effects, the
heterozygosis k and of alleles of the Holstein breed l, respectively; agem represents dam age at calving m; an
is the additive genetic value of animal n; and eijklmn is
the error associated with each observation. The effects of dam age at calving (linear and quadratic) were adjusted only for the traits FLL and 305MY.
The PHol of each animal was obtained from the average PHol of its parents, based on their oldest ancestors. The PHet was determined using the equation: PHet = PHols × (1 - PHold) + PHold × (1 - PHols)
where PHet is the percentage of heterozygosis of the individual of interest; PHols is the expected percentage
of alleles of the female Holstein parent; and PHold is
the expected percentage of alleles of the male Holstein parent.
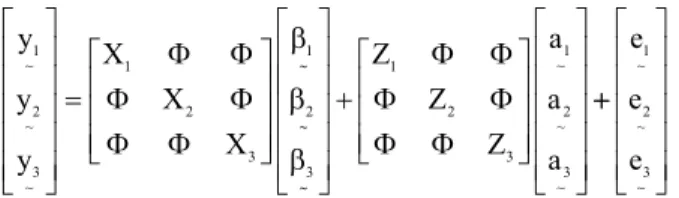
The MTM model may be represented by the following matrix: y y y X X X 1 ~ 2 ~ 3 ~ 1 2 3 = 1 ∼ 2 ∼ 3 ∼ Φ Φ Φ Φ Φ Φ β β β + Z Z Z a a a 1 2 3 1 ~ 2 ~ 3 ~ Φ Φ Φ Φ Φ Φ ++ e e e 1 ~ 2 ~ 3 ~
where
y
~
h are the vector observations of trait h (h = 1,2, and 3); Xh is the incidence matrix of the effects of
trait h; Φ is a null matrix; βh
~ is the solution vector for
fixed effects; Zh is the incidence matrix of the direct additive genetic effects; ah
~ is the solution vector for the direct additive genetic effects; and eh
~ is the error
vector.
The trait AFC, FLL, and 305MY were also evaluated through the RRMLS. In this model, knots were positioned at the 0.5, 0.625, and 0.75 points, which correspond to the expected percentage of the alleles of the Holstein breed in the 1/2HG, 5/8HG, and 3/4HG genetic groups. The residual variances were considered heterogeneous, and a variance class was for each of the three genetic groups.
To adjust the RRMLS, PHol and PHet were
transfor-med into covariables, {φi(PHol)} and {φi(PHet)},
respectively, where φi is the ith covariable for PHol or
PHet. Assuming n knots in point Ti (i = 1, ..., n) and
that Ti ≤ t < Ti+1, the covariables may be obtained in the knots i and i + 1 through the equations:
ϕi ϕ
i 1
i 1 i
i 1
i 1
i 1 i
(t) T t
T T (t) 1
T t T T = − − = − − − + + + + +
and ,
respectively. For other values of the Ti and Ti+1 interval, φi(t) = 0. Assuming that the value found for the genetic group corresponds exactly to the adjusted knot,
Table 1. Crossings between sires and dams of different genetic groups and their respective progenies, as well as number
of records for age at first calving (AFC), first lactation length (FLL), and first lactation 305-day milk yield (305MY) of a multiple-breed Holstein (H) x Gyr (G) dairy cattle population.
Crossing(1) AFC FLL 305MY
Sire Dam Progeny NS(2) NP(3) NS NP NS NP
G H 1/2HG 163 1,357 167 1,276 172 1,349
Subtotal - - 163 1,357 167 1,276 172 1,349
5/8HG 3/8HG 1/2HG 25 36 25 35 25 36
5/8HG 5/8HG 5/8HG 169 1,140 167 1,106 171 1,152
5/8HG 7/8HG 3/4HG 81 455 80 428 82 447
Subtotal - - 185 1,631 184 1,569 189 1,635
3/4HG 1/4HG 1/2HG 10 12 9 11 9 11
3/4HG 1/2HG 5/8HG 60 279 58 272 60 286
3/4HG 3/4HG 3/4HG 93 719 88 685 90 718
Subtotal - - 103 1,010 98 968 101 1,015
H G 1/2HG 460 2,490 438 2,295 454 2,459
H 1/4HG 5/8HG 437 1,578 440 1,499 450 1,589
H 1/2HG 3/4HG 684 3,748 668 3,551 693 3,757
Subtotal - - 1,008 7,811 980 7,345 1,013 7,805
Total - - 1,459 11,809 1,429 11,158 1,475 11,804
(1)The fraction in front of the letters HG represents the expected percentage of alleles of the Holstein breed. (2)NS, number of sires. (3)NP, number of
ϕi(T )k 1 if i k 0 if i k
= =
≠
.
The mean trajectories were also adjusted by linear polynomial splines. For PHol, the knots
were positioned at the same points defined by the
adjusted genetic effects, whereas, for PHet, the knots were positioned at the 0.375, 0.5, and 1.0 points. The effect of dam age at calving was not included in the analysis of AFC. However, the effects of contemporary groups and birth month for AFC or calving month for FLL and 305MY were considered. The random regression model may be presented as:
yijklmn gi mj b1 he he PHetk b PHol he 1
H
2 ho ho l
ho
3
= + + ( )∑ +
=
(
)
( ) =(
)
c ϕ ϕ
1 1 H
3 m 4 m
2 ho l ho 1 H 3 3
b age b age PHol
∑
+ + + ∑
(
)
+= ( )
ϕ an ho eijkklmn
where b1(he) and b2(ho) are the regression coefficients
associated with the heterozygosis effects and the percentage of alleles of the Holstein breed, respectively;
φhe(PHetk) and φho(PHol1) are the polynomials
associated with knots he and ho, respectively; an(ho) is the random regression coefficient for the additive
genetic effects of animal n associated with knot ho; eijklmn is the error associated with each observation; and the remaining terms are defined as previously
described.
Under a matrix, the regression model may be represented by:
y X Z a e
~ ~ ~
= + +
∼ β
where y
~
is the vector of phenotypes observed; X is
the incidence matrix of fixed effects; β
~
is the vector of
solutions for fixed effects; Z is the incidence matrix of the polynomial coefficients used to moldel the direct
additive genetic effects; a
~ is the vector of solutions for the random regression coefficients of the direct
additive genetic effects; and e
~ is the vector of residues.
The following assumptions were made for the effects included in the MTM model:
β1 β β
~ 2 ~ 3 ~ t ~constant;
a1 a a A,G ~N 0 0 0 ,G A ~ 2 ~ 3 ~ t 0 t 0
(
[
]
⊗)
, ande1 e e R ~N 0 0 0 ,R I
~ 2 ~ 3 ~ t 0 t 0
(
[
]
⊗)
;where A represents the additive genetic relationship matrix among the animals; G0 is the matrix of
additive genetic (co)variances between traits, so that
G0=
2 1 2 12 2 13 2 12 2 2 2 23 2 13 2 23 2 3
σ σ σ
σ σ σ
σ σ σ
;
N is the normal distribution; ⊗ is the direct product operator between matrices; R0 is the matrix of residual
variances for the traits, so that
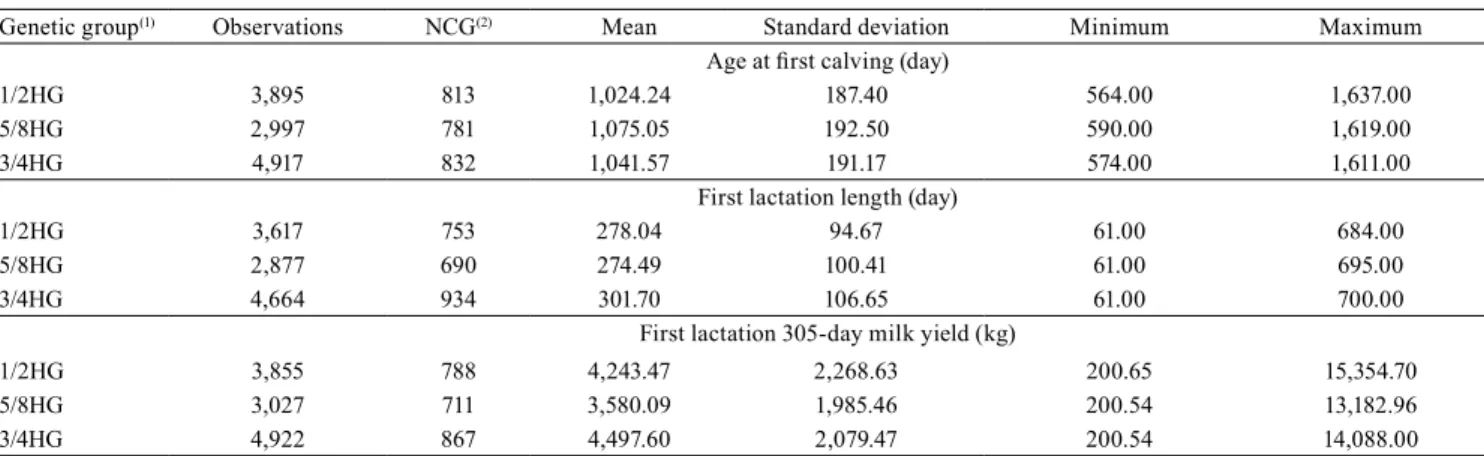
Table 2. Descriptive statistics of age at first calving (AFC), first lactation length (FLL), and first lactation 305-day milk yield
(305MY) of a multiple-breed Holstein (H) x Gyr (G) dairy cattle population.
Genetic group(1) Observations NCG(2) Mean Standard deviation Minimum Maximum
Age at first calving (day)
1/2HG 3,895 813 1,024.24 187.40 564.00 1,637.00
5/8HG 2,997 781 1,075.05 192.50 590.00 1,619.00
3/4HG 4,917 832 1,041.57 191.17 574.00 1,611.00
First lactation length (day)
1/2HG 3,617 753 278.04 94.67 61.00 684.00
5/8HG 2,877 690 274.49 100.41 61.00 695.00
3/4HG 4,664 934 301.70 106.65 61.00 700.00
First lactation 305-day milk yield (kg)
1/2HG 3,855 788 4,243.47 2,268.63 200.65 15,354.70
5/8HG 3,027 711 3,580.09 1,985.46 200.54 13,182.96
3/4HG 4,922 867 4,497.60 2,079.47 200.54 14,088.00
R0=
0 0
0 0
0 0
2 11
2 22
2 33
σ σ
σ ;
and I is an identity matrix of order equal to the number of observations. For the RRMLS, the following assumptions were made a priori: β
~
~constant, a A,G ~N 0, A
~ 0
* *
G0⊗
(
)
, and e R| * ~N( ,R*)0 0 0 . For
both models, inverse-Wishart (IW) distributions were assumed for the matrices of genetic and residual (co)variances, with G0 and G ~IW0 ,n
* a 2
a
Σ
(
)
andR0
*
~IW e,n
2 e Σ
(
)
, where Σ Σa2e 2
, , na, and ne represent the
hyperparameters of inverse-Wishart distributions. Information on the complete conditional distributions a priori is available in Sorensen & Gianola (2002).
The samples of the complete conditional distributions of the covariance components were obtained by Gibbs sampler using the GIBBS3F90 software (Misztal et al., 2014). Chains of 1,100,000 iterations were considered, with a burn-in of 100,000 iterations and sampling of (co)variance components for each 100 cycles. Chain
size was defined in preliminary analyses, according
to the method of Raftery & Lewis (1992), available in the Bayesian output analysis program package (Smith, 2005) of the R software (R Core Team, 2015). The convergence of the chains was evaluated by the criterion proposed by Geweke (1992), available in the same software, and by the visual inspection of the values sampled in each iteration.
Results and Discussion
The RRMLS was considered equivalent to the MTM, since the means of the additive and residual variances obtained by both models were, overall, similar in the three genetic groups evaluated due to the overlap of the high-density intervals (Table 3). This result was already expected, as shown by Misztal (2006).
The values of the deviance information criterion for the MTM and RRMLS were equal to 79.40 and 41.88 for AFC, 43.20 and 29.88 for FLL, and 246.24 and 98.25 for 305MY, respectively, indicating the best
fittings for RRMLS. The superiority of the RRMLS in
relation to the MTM in terms of statistical adjustment and applicability would be even greater if the number of genetic groups were higher. In the case of the MTM, there could be problems related to the estimability
and convergence of the (co)variance components of the genetic groups that showed few records. The data of these less representative genetic groups could be excluded in order to guarantee estimability and convergence in the MTM. However, in the RRMLS, there is no need to include a knot for each genetic group – the knots may be included only for the genetic group that is considered more representative and of greater interest, or according to statistical criteria. This is an indicative that, if the data were analyzed by the RRMLS, it would not be necessary to exclude the records of the less important genetic groups.
Other works on multiple trait evaluations, carried out with data on beef (Cardoso & Tempelman, 2004; Toral et al., 2012; Lukaszewicz et al., 2015) and dairy (Heins et al., 2011; VanRaden et al., 2011) cattle,
showed that variances and heritabilities are specific to
each genetic group. Similar results were obtained in the present study, since the additive genetic variances and heritabilities of AFC and 305MY were higher in the 1/2HG groups than in the 5/8HG and 3/4HG groups (Table 3). The lowest averages a posteriori were observed in groups 5/8HG and 3/4HG. These differences may be a consequence of the different processes and intensities of selection to which the different genetic groups were subjected to (Toral et al., 2012).
The intense selection performed on the Holstein breed to increase milk yield (SØrensen et al., 2008;
Heins et al., 2011) and the use of a small number of bulls with greater breeding value may have altered the allele frequency in a short period of time (Kim et
al., 2013). These authors also verified that there was an increase in the means of the endogamy coefficients
of the Holstein breed and a consequent reduction in genetic variability. Therefore, lower values were found for genetic variances, mainly in the groups with a higher fraction of alleles of the Holstein breed (Table 3).
It should be noted that the significant differences
observed for the variances and heritabilities among groups may be associated with the selective recording of records. In practice, the records of some genetic groups, and not of others, are recorded in the breeding programs of multiple-breed populations. Selective milk recording may also be carried out depending on the yield level of the cow.
groups for both models (Table 3), which was attributed to the overlap of the high-density intervals. This result was a consequence of the formation of contemporary groups, since each group included animals of different racial compositions. In this case, it would be impossible to observe differences in the residual variances due to the environmental variations to which the genetic groups were subjected to. Considering the similarities found for residual variances, the heritabilities of AFC, FLL, and 305MY followed the same tends already described for the additive genetic variances.
The correlations between the random regression
coefficients used to adjust the breeding values for
AFC between groups 1/2HG and 3/4HG and between 5/8HG and 3/4HG did not differ from zero, for both models (Table 4). The same results were obtained for FLL between groups 1/2 HG and 3/4HG. These same genetic correlations did not differ from zero when the MTM was adopted.
In the case of 305MY, the correlations between all genetic groups differed from zero when the RRMLS was used, and the highest correlation was found between groups 5/8HG and 3/4HG (Table 4). The means a posteriori of the genetic correlations between groups 1/2HG and 5/8HG and between 1/2HG and 3/4HG were similar. When estimated by the MTM, the correlation between groups 1/2HG and 5/8HG did not differ from zero (Table 4).
The high-density intervals of the correlations that included zero should be highlighted, since the
classification of the sires used in the formation of these
genotypes may vary according to the genetic group of the targeted female progenies. In this case, distortions may occur when animals with a superior breeding value are chosen as sires and evaluated using data on progenies from different groups. Therefore, predicting breeding values for bulls, according to the genetic composition of progenies, may contribute to improve the quality of the genetic evaluation of multiple-breed populations.
Table 3. Posteriori means and limits of the high-density
intervals, for 90% of the samples (between parentheses), of the additive (σa2) and residual (σe2) genetic variances and heritabilities (h2) estimated by the multiple-trait model (MTM) and the random regression model using linear splines (RRMLS) for age at first calving (AFC), first lactation length (FLL), and first lactation 305-day milk yield (305MY) of 1/2 Holstein + 1/2 Gyr (1/2HG), 5/8 Holstein + 3/8 Gyr (5/8HG), and 3/4 Holstein + 1/4 Gyr (3/4HG) cows.
Genetic group
Additive genetic variance
Residual genetic
variance Heritability (h
2)
Multiple-trait model AFC(1)
1/2HG 558 (335; 786) 1,461 (1,268; 1,659) 0.27 (0.17; 0.38)
5/8HG 245 (97; 372) 1,872 (1,716; 2,018) 0.11 (0.05; 0.17)
3/4HG 193 (74; 290) 1,741 (1,625; 1,856) 0.09 (0.04; 0.15)
FLL(2)
1/2HG 1,043(413; 1,569) 5,605 (5,108; 6,202) 0.15 (0.06; 0.23)
5/8HG 1,051 (607; 1,511) 6,431 (5,903; 6,929) 0.14 (0.08; 0.20)
3/4HG 804 (398; 1,175) 7,880 (7,425; 8,330) 0.09 (0.04; 0.13)
305MY(3)
1/2HG 684 (430; 948) 2,018 (1,795; 2,260) 0.25 (0.16; 0.34)
5/8HG 320 (200; 438) 1,626 (1,492; 1,756) 0.16 (0.10; 0.22)
3/4HG 284 (192; 377) 1,982 (1,871; 2,091) 0.12 (0.08; 0.16)
Random regression model using linear splines AFC(1)
1/2HG 730 (488; 970) 1,448 (1,252; 1,660) 0.33 (0.16; 0.38)
5/8HG 283 (117; 428) 1,862 (1,704; 2,026) 0.13 (0.04; 0.19)
3/4HG 422 (268; 585) 1,627 (1,483; 1,770) 0.20 (0.13; 0.27)
FLL(2)
1/2HG 1,549 (925; 2,139) 5,385 (4,815; 5,927) 0.22 (0.13; 0.30)
5/8HG 864 (528; 1,202) 6,599 (6,161; 7,053) 0.11 (0.07; 0.16)
3/4HG 826 (338; 1,275) 7,893 (7,398; 8,388) 0.09 (0.01; 0.20)
305MY(3)
1/2HG 1,042 (743; 1,324) 1,884 (1,161; 2,080) 0.35 (0.26; 0.44)
5/8HG 356 (227; 488) 1,541 (1,493; 1,764) 0.17 (0.11; 0.24)
3/4HG 362 (237; 491) 1,987 (1,856; 2,112) 0.15 (0.07; 0.16)
(1)Variances expressed as days2x10-1. (2)Variances expressed as days2. (3)
Va-riances expressed as kg2x10-3.
Table 4. A posteriori means and limits of the high-density
intervals, for 90% of the samples (between parentheses), of the correlations between the random regression coefficients used to adjust the breeding values for age at first calving (AFC, in days), first lactation length (FLL, in days), and first lactation 305-day milk yield (305MY, in kg) of a multiple-breed Holstein (H) x Gyr (G) dairy cattle population, estimated by the multiple-trait model (MTM) and the random regression model using linear splines (RRMLS).
Genetic group AFC FLL 305MY
MTM
1/2HG–5/8HG 0.55 (0.13; 0.96) 0.63 (0.37; 0.87) 0.33 (-0.10; 0.74)
1/2HG–3/4HG -0.35 (-0.84; 0.08) 0.10 (-0.83; 0.54) 0.64 (0.40; 0.84)
5/8HG–3/4HG -0.15 (-0.84; 0.55) 0.81 (0.67; 0.95) 0.88 (0.80; 0.98)
RRMLS
1/2HG–5/8HG 0.55(0.18; 0.94) 0.77 (0.33; 0.98) 0.52 (0.18; 0.89)
1/2HG–3/4HG -0.26 (-0.58; 0.07) 0.09 (-0.29; 0.47) 0.41 (0.14; 0.70)
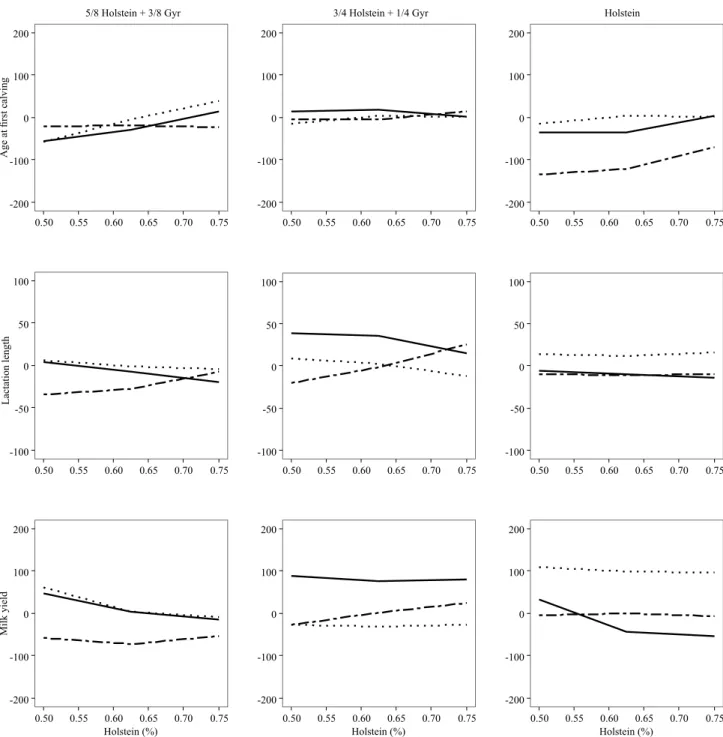
The breeding value of the three sires with the greater number of female progenies were plotted according with the genetic group of the progenies by which the evaluations were performed (Figure 1), and there were
reclassifications. This result confirms those obtained
by Martinez et al. (2000), who found that different Gyr
bulls were selected based either on the milk yield of their pure or of their crossbreed female progenies.
The differences in the specific combination
capacities (Falconer & Mackay, 1996) of each bull may be responsible for part of the interactions observed between the genetic groups of bulls and cows. It should
Figure 1. Breeding values for age at first calving (in days), first lactation length (in days), and first lactation 305-day milk
be pointed out that, even when there is an interaction between the breeding value of the bull and the genetic group of the progeny, including yield records of crossbred animals may increase the accuracy of the genetic evaluations of pure-breed sires (VanRaden et al., 2007), as observed for the Holstein and Gyr breeds.
When random regression using linear splines is adopted in the genetic evaluation of a multiple-breed dairy cattle population, it is possible to predict the breeding value of sires and to obtain distinct solutions for each genetic group of progenies. Furthermore, the use of polynomial splines allows simplifying evaluations when knots are precisely adjusted in the genetic groups to be assessed.
Conclusions
1. The random regression model using linear splines, via spline polynomials, is adequate to estimate the genetic parameters for productive and reproductive traits of multiple-breed dairy cattle populations.
2. The breeding value of the sires is affected by the genetic group of the progeny by which it is evaluated.
References
BERMAN, A. Are adaptations present to support dairy cattle productivity in warm climates? Journal of Dairy Science, v.94, p.2147-2158, 2011. DOI: 10.3168/jds.2010-3962.
CARDOSO, F.F.; TEMPELMAN, R.J. Hierarchical Bayes multiple-breed inference with an application to genetic evaluation of a Nelore-Hereford population. Journal of Animal Science, v.82, p.1589-1601, 2004. DOI: 10.2527/2004.8261589x.
DAL ZOTTO, R.; PENASA, M.; DE MARCHI, M.; CASSANDRO, M.; LÓPEZ-VILLALOBOS, N.; BITTANTE, G. Use of crossbreeding with beef bulls in dairy herds: Effect on age, body weight, price, and market value of calves sold at livestock auctions. Journal of Animal Science, v.87, p.3053-3059, 2009. DOI: 10.2527/jas.2008-1620.
DHAKAL, K.; MALTECCA, C.; CASSADY, J.P.; BALOCHE, G.; WILLIAMS, C.M.; WASHBURN, S.P. Calf birth weight, gestation length, calving ease, and neonatal calf mortality in Holstein, Jersey, and crossbred cows in a pasture system. Journal
of Dairy Science, v.96, p.690-698, 2013. DOI:
10.3168/jds.2012-5817.
FALCONER, D.S.; MACKAY, T.F.C. Introduction to
quantitative genetics. 4th ed. London: Longman, 1996. 464p.
GEWEKE, J. Evaluating the accuracy of sampling-based approaches to the calculation of posterior moments. In: BERNARDO, J.M; BERGER, J.O; DAWID, A.P; SMITH, A.F.M.
Bayesian statistics 4. Oxford: Oxford University, 1992.
p.164-193.
HEINS, B.J.; HANSEN, L.B.; SEYKORA, A.J.; HAZEL, A.R.; JOHNSON, D.G.; LINN, J.G. Jersey × Holstein crossbreds compared with pure Holsteins for production, mastitis, and body
measurements during the first 3 lactations. Journal of Dairy
Science, v.94, p.501-506, 2011. DOI: 10.3168/jds.2010-3232.
KIM, E.-S.; COLE, J.B.; HUSON, H.; WIGGANS, G.R.; VAN TASSELL, C.P.; CROOKER, B.A.; LIU, G.; DA, Y.;
SONSTEGARD, T.S. Effect of artificial selection on runs of
homozygosity in U.S. Holstein cattle. PLoS ONE, v.8, e80813, p.808-813, 2013. DOI: 10.1371/journal.pone.0080813.
LUKASZEWICZ, M.; DAVIS, R.; BERTRAND, J.K.; MISZTAL, I.; TSURUTA, S. Correlations between purebred and crossbred body weight traits in Limousin and Limousin-Angus populations.
Journal of Animal Science, v.93, p.1490-1493, 2015. DOI:
10.2527/jas.2014-8285.
MARTINEZ, M.L.; VERNEQUE, R. da S.; TEODORO, R.L.; CAMPOS, J. de P.; CRUZ, M.; PAULA, L.R.O. de. Relações
entre as capacidades preditas de transmissão de touros Gir e a produção de leite de suas filhas puras e mestiças. Revista
Brasileira de Zootecnia, v.29, p.692-699, 2000. DOI: 10.1590/
S1516-35982000000300008.
MISZTAL, I. Properties of random regression models using linear splines. Journal of Animal Breeding and Genetics, v.123, p.74-80, 2006. DOI: 10.1111/j.1439-0388.2006.00582.x.
MISZTAL, I.; TSURUTA, S.; LOURENÇO, D.; AGUILAR, I.; LEGARRA, A.; VITEZICA, Z. Manual for BLUPF90 family of
programs. Athens: University of Georgia, 2014. 125p.
R CORE TEAM. R: a language and environment for statistical computing. Vienna: R Foundation for Statistical Computing, 2015. RAFTERY, A.E.; LEWIS, S.M. One long run with diagnostics: implementation strategies for Markov Chain Monte Carlo.
Statistical Science, v.7, p.493-497, 1992. DOI: 10.1214/
ss/1177011143.
SMITH, B.J. Bayesian output analysis program (BOA) version
1.1 user’s manual. 2005. 43p. Available at:
<http://www.public-health.uiowa.edu/boa/boa.pdf>. Accessed on: Mar. 5 2016. SORENSEN, D.; GIANOLA, D. Likelihood, Bayesian, and
MCMC methods in quantitative genetics. 2nd ed. New York:
Springer, 2002. 740p. DOI: 10.1007/b98952.
SØRENSEN, M.K.; NORBERG, E.; PEDERSEN, J.; CHEISTENSENS, L.G. Crossbreeding in dairy cattle: a Danish perspective. Journal of Dairy Science, v.91, p.4116-4128, 2008. DOI: 10.3168/jds.2008-1273.
TORAL, F.L.B.; TORRES JÚNIOR, R.A. de A.; LOPES, P.S.; CARDOSO, F.F.; SILVA, L.O.C. da. Heteroskedasticity for weaning weight of Charolais-Zebu crossbred calves. Revista
Brasileira de Zootecnia, v.41, p.1163-1172, 2012. DOI: 10.1590/
S1516-35982012000500013.
calves. Journal of Animal Science, v.91, p.5582-5588, 2013. DOI: 10.2527/jas.2013-6490.
VANRADEN, P.M.; OLSON, K.M.; WIGGANS, G.R.; COLE, J.B.; TOOKER M.E. Genomic inbreeding and relationships among Holsteins, Jerseys, and Brown Swiss. Journal of Dairy
Science, v.94, p.5673-5682, 2011. DOI: 10.3168/jds.2011-4500.
VANRADEN, P.M.; TOOKER, M.E.; COLE, J.B.; WIGGANS, G.R.; MEGONIGAL JR., J.H. Genetic evaluations for
mixed-breed populations. Journal of Dairy Science, v.90, p.2434-2441, 2007. DOI: 10.3168/jds.2006-704.
WOLFOVÁ, M.; WOLF, J.; KVAPILÍK, J.; KICA, J. Selection for
profit in cattle: II. Economic weights for dairy and beef sires in
crossbreeding systems. Journal of Dairy Science, v.90, p.2456-2467, 2007. DOI: 10.3168/jds.2006-615.
YAO, C.; WEIGEL, K.A.; COLE, J.B. Genetic evaluation of stillbirth in US Brown Swiss and Jersey cattle. Journal of Dairy
Science, v.97, p.2474-2480, 2014. DOI: 10.3168/jds.2013-7320.