journal, except where otherwise noted, is licensed under a Creative Commons Attribution License
The elderly in Brazil: demographic transition,
profile, and socioeconomic condition
Guilherme Fonseca Travassos* Alexandre Bragança Coelho** Mary Paula Arends-Kuenning***
This paper presents a revision about the elderly population in Brazil, addressing aspects of the demographic transition as it relates to socio-economic conditions and some consequences and trends associated with policies affecting Brazil’s elderly. Since a demographic transition has been occurring as a result of the aging of the Brazilian population, we identify a majority profile of Brazilian elderly as White women who live in urban areas in couple-without-children households, and possessing on average an education of 6.1 years and a smaller than minimum wage. We show that the vast majority of the elderly in Brazil receive some form of government income transfer that have a positive effect on poverty reduction in the segment. Finally, we show that there will be some future natural consequences and trends affecting the profile of the aging population, and that adjustments will need to be made by the government in terms of health and social security spending in order to mitigate the increased demands in these areas as the country's demographic change.
Keywords: Demographic transition. Elderly. Poverty.
* Universidade Federal de Viçosa (UFV), Viçosa-MG, Brazil ([email protected];
https://orcid.org/0000-0002-9868-7386).
**Universidade Federal de Viçosa (UFV), Viçosa-MG, Brazil ([email protected]; https://orcid.org/0000-0002-9735-7035). *** University of Illinois at Urbana-Champaign, Champaign-IL, United States of America ([email protected]; https://
Introduction
The study of population aging has prompted important debates on causes of poverty in the elderly population, aggregated consumer demand and possible policies to reduce inequalities resulting from the demographic transition. Understanding Brazil’s present situation is key to designing cost-effective policies for the future. While the international literature has advanced in this area, Brazil lags behind in terms of understanding the economic consequences of population aging within its borders.
As emphasized by Saad (2011) and Medici (2011), the period of rapid population aging in Latin America countries – LAC – is different from the trajectories of developed countries, and will therefore pose novel social and economic challenges to Brazilian society. These challenges require the implementation of public policies and programs in multiple areas in the present, including the provision of long-term health care and the financing of pensions for a progressively aging population. The social and economic circumstances faced by the aging population, such as late retirement, improvement of health and functional ability, and public and private policies that influence individual well-being are in a state of continuing evolution and transition.
In this paper, we present an overview of the status of the elderly in Brazil, addressing aspects of the demographic transition, the profile of the Brazilian elderly and the socio-demographic conditions of this segment of the population; establishing a parallel across these topics and population aging, as well as its consequences from a macroeconomic point of view. Understanding the complexities of this growing population segment and the interactions between demographics, policy, social behavior and economics affecting them is essential to informing policy design that ensures an optimal quality of life for the elderly in Brazil. The World Health Organization (WHO) defines elderly people as people aged equal to or greater than 60 years old (IBGE, 2009). We applied this definition to our research.
The demographic transition
The Brazilian population has undergone significant changes over the 19th and 20th centuries. Among those changes were a reduction in mortality followed by a decline in fertility rates. Compared to the European experience, the movement from a relatively stable population stage, due to high mortality and fertility rates, to a low mortality and fertility stage, would happen in Brazil at an accelerated rate (BELTRÃO et al., 2004). According to the World Bank database (2019), the percentage of elderly and the life expectancy at birth in 2019 in Brazil are the same as those provided by the Organization for Economic Co-operation and Development (OECD) for these countries in 1960 and 1980, respectively.
Demographic transition is defined as the movement of the population from high to low levels of mortality and fertility associated with the advent of technological development
and modernization. Warren Thompson, a pioneer researcher on demographic transition theory, says this passage occurs in four stages: first (pre-industrial stage), when fertility and mortality are high (low population growth); second (industrialization/urbanization stage), when mortality is reduced and fertility remains constant (rapid population growth); third (industrial maturity stage), when fertility is reduced and mortality are low; and fourth (post-industrial stage), when fertility and mortality are low (low population growth) (ZUANAZZI; STAMPE, 2014).
According to Instituto Brasileiro de Geografia e Estatística – IBGE (2019), the approximately 210 million inhabitants living in Brazil in 2019 are a result of a population history marked by unequal economic growth and the consequent regional imbalances. Consequently, over the course of many decades, the demographic transition has been selective, both from a spatial and social point of view (MEDICI; BELTRÃO, 1995). However, we can summarize the Brazilian demographic transition in three basic periods. In the first one, which extends from the middle of nineteenth century to about 1930, the Brazilian population had high mortality and fertility rates with moderate population growth rates below 2% per year on average, mainly due to rising international migration. This period can be characterized as the first phase of demographic transition in Brazil.
The second period of Brazilian population history accelerated from 1950 when mortality rates and international migration declined sharply. However, the mortality rate had been falling, at least, since the beginning of the 20th century, in some cities of Brazil such as São Paulo, spreading its decline to the entire country starting in the 1950s (SEADE, 2018). Thus, the decline in mortality rates in all age groups together with the high fertility rates in the decades 1950 and 1960 caused the growth of the Brazilian population to reach its peak with growth rates of approximately 3% per year on average. Therefore, the second period of Brazilian population history fits the so-called second stage of the demographic transition and extended until the end of the 1960s when fertility levels began to decline, offsetting the relative reduction in mortality, preventing the population growth rates from continuing to increase (IBGE, 2014a).
A group of authors presented evidence that the second period of the Brazilian demographic transition ended early in some regions of Brazil in the mid-1930s or 1940s, with the fall in fertility and mortality rates in urban areas of the South and Southeast regions (POTTER et al., 2010; SCHMERTMANN et al., 2013; GONÇALVES et al., 2019). However, in the North and Northeast regions, the fertility rate increased until the beginning of the 1970s, sustaining the Brazilian fertility rate at higher levels until the decades 1950 and 1960 (FRIAS; CARVALHO, 1994; FRIAS; OLIVEIRA, 1991; GONÇALVES et al., 2019).
Therefore, two phases of the fertility transition in Brazil were identified: the first, similar to the European transition, was long and slow, and concentrated in the Center-South of the country in Rio de Janeiro, São Paulo and the South region; and the second was fast, similar to that observed in developing countries during the second half of the 20th century (RIOS-NETO, 2000; GONÇALVES et al., 2019).
In this context, the third period of Brazilian population history was spread throughout all territories during the late 1960s, characterized by a rapid reduction in population growth. From the rate of almost 3% per year observed between 1950 and 1970, Brazilian population growth decreased to approximately 1.3% per year after 1990. Therefore, the main variables responsible for the demographic transition, the fertility and mortality rates, show that the Brazilian population has already reached the third stage of demographic transition (IBGE, 2014a). Table 1 shows in detail further evidence of demographic transition and projections for some indicators of age structure, fertility, and mortality in the period between1960 and 2060.
Brazil has been experiencing a rapid drop in fertility levels since the 1960s. While in 1960 the average number of children per woman was around 6.3, this number dropped to about 1.8 children per woman in 2020 and will drop to 1.7 by 2060. The crude birth rate defined as the number of live births per thousand inhabitants also decreased significantly after the 1960s from 44 births to 14 births per thousand in 2020. According to IBGE (2009), the late 1960s and increasingly throughout the 1970s, Brazilian society was transformed by strong migratory movements from the countryside to the city, leading to an intensification of urbanization. Additionally, wage increases and greater participation among women in the labor market sparked the spread of an economic model focused on the consumption of durable goods, with an associated spread of relationship marketing and an increase in family and social reproduction costs. These factors combined with the industrial production and acceptance of contraceptive means by a significant portion of women, contribute to the sharp decline in fertility rates after the 1970s. However, according Martini (1996), there are important distinguishing characteristics of Brazil's situation. For instance, Brazil experienced higher rates of abortion and sterilization, resulting from the policies and agendas of key social actors that limited access to other effective methods of contraception. Additionally, institutional changes in the areas of health and social security, along with the strong influence of global mass media on social and reproductive behavior affected Brazil uniquely. IBGE projections show that as a result of these influences the fertility rate will continue to fall in the coming years reaching 1.7 children per woman in 2060 (IBGE, 2019).
The mortality rates have also been decreasing steadily in Brazil. Thus, life expectancy at birth for both genders increased from 50 in 1960 to 76.7 years by 2020, reaching 81 years in 2060. In the same period, infant mortality rates fell from 124 deaths per thousand live births in 1960 to only 12 deaths in 2020 and it is expected to decrease to 7 deaths by 2060. The crude death rate defined as the number of deaths per thousand inhabitants also decreased significantly after the 1960s from 15 deaths to only 6.6 deaths per thousand inhabitants in 2020. According to IBGE (2009), while the causes leading to a reduction in mortality are not fully understood, public health systems, social security, urban infrastructure, and labor regulations in key regions of the country established during the 1930s have played
important roles. These institutional factors, along with technological advances in the chemical – pharmaceutical industry, contributed to the control and reduction of various diseases, especially infectious and pulmonary, which previously had high prevalence with high mortality rates.
TABLE 1
Age structure, fertility and mortality indicators Brazil – 1960-2060 Indicators 1960 1980 2000 2020 2040 2060 Population 70,070,457 119,002,706 169,799,170 211,755,692 231,919,922 228,286,347 Median age 18 20 25 33 41 46 Aging index (%) (1) 11.2 15.9 28.9 46.9 103.6 173.5 Age dependency ratio (%) (2) 90.0 79.5 61.7 44.3 52.0 67.2
Total fertility rate (3) 6.3 4.4 2.4 1.8 1.7 1.7
Crude birth rate (4) 44.0 31.8 21.1 14.0 10.6 9.3
Crude death rate (5) 15.0 8.9 6.9 6.6 8.9 12.5
Child mortality rate (6) 124.0 82.8 27.4 11.6 7.8 6.9 Life expectancy at birth 51.6 62.8 70.4 76.7 79.8 81.0
1940-1960 1960-1980 1980-2000 2000-2020 2020-2040 2040-2060
Annual growth rate 3.5 1.6 1.4 1.2 0.5 -0.1
Source: Vasconcelos and Gomes (2012); IBGE (2019).
(1) Number of people 60 or more years old, for every 100 people under 15 years. (2) The ratio of the total population in potentially inactive age (under 15 and over 60) in relation to the population in potentially active age (15-59 years) of older dependents (people older than 64) to the working-age population (those ages 15- 64). (3) The average number of children that would be born per woman if all women lived to the end of their childbearing years and bore children according to a given fertility rate at each age. (4) The number of live births per thousand inhabitants. (5) The number of deaths per thousand inhabitants. (6) The death of infants and children under the age of five or between the age of one month to four years thousand inhabitants.
As Alves (2008) indicates, the demographic transition is the result of different socio- economic and cultural determinants and there is ample literature in Brazil1 that explains
the causes of the reduction in mortality and fertility rates as a result of structural and institutional changes that have occurred both at the macro and micro levels, affecting inter-generational and gender relations. However, the major effect for social and economic policies is the changing in the population age structure. According to Brito (2007), from the point of view of the transition of the age structure, three phenomena must be considered: reduction of the relative weight of the young population; increasing the degree of population aging, that is, the proportion of people aged sixty years old or more; and the growth of the working-age population. It can be understood that the set of public policies that are conditioned by the age structure of the population, such as, for example, education, health, labor market and social security policies, must consider demographic changes. Otherwise, it will reduce its efficiency and move away from the larger objectives of economic development with the reduction of social inequalities.
1 Carvalho et al. (1981), Merrick and Berquó (1983), Faria (1989), Alves (1994), Martine (1996), Monteiro (1997), Carvalho
and Wong (1998), Alves (2002), Beltrão et al. (2004), Carvalho and Brito (2005), Brito et al. (2007), Alves (2008), Castiglioni (2012), Vasconcelos and Gomes (2012) and Gonçalves et al. (2019).
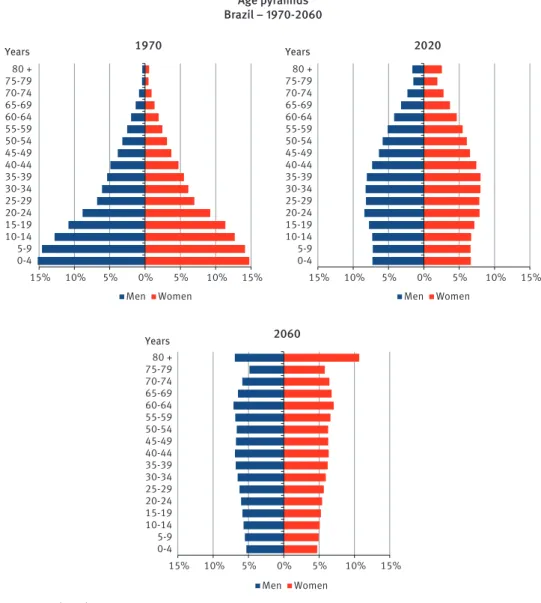
The process of declining fertility and mortality rates. and the reduction in the percentage of children and youth of the population makes the age pyramid start a gradual process of aging (ALVES, 2008). According to Wong and Carvalho (2006), this process is called Age Structural Transition – AST, which results in changes in the size of various age groups and modifies the proportional weight of these age groups of the population. Thus, note that the age pyramid in Brazil in 1970 had a very wide base and a very narrow top (Figure 1). In 1970, the Brazilian age pyramid still had the shape of a pyramid, where each older group had fewer members than the previous group, although the bottom of the pyramid had been reduced in percentage terms. With the fall of fertility and mortality rates, the age pyramid in 2020 had three younger age groups with lower percentages than the group aged 15 to 19 years. Therefore, lower fertility and mortality rates transformed the age structure of the population, reducing the weight of children and young people and increasing, initially, the weight of the adult group and then the weight of the elderly group.2 This is clear when
observing the projected age pyramid in 2060, when the age structure of the population will have a rectangular shape and the percentage of elderly is expected to exceed the number of children, especially for women (IBGE, 2019).
According to Brito (2008), another economic challenge for Brazilian society due to the demographic transition is the result of social inequalities and the corresponding differences in total fertility rates, where the poorest population has grown most, with strong consequences for changes in the age structure. The relationships between the various indicators of the demographic transition and per capita household income show that, in Brazil, social differences lead to greater demographic inequalities than those observed between different regions. The demographic bonuses are different according to socio-economic status. Thus, the ability of the demographic transition to enhance the intergenerational transfer of resources is closely associated with the implementation of policies that enhance the social transfer of these same resources.
Therefore, Brazil’s population growth up until 2025 will be driven by an increase in the older population, while the population of working age people (between 15 and 59 years old) will begin to decline. An interesting indicator that emerges from this statement is the ratio of total dependence, which relates the total population in potentially inactive age (under 15 and over 60) in relation to the population in potentially active age (15-59 years). This indicator reflects the weight or “economic burden” from the group of children, adolescents and the elderly on the segment of the population that is considered to be in the correct age to engage in economically productive activity. As seen in Table 1, the dependency ratio decreased from 90% in 1960 to 44.3% in 2020. After this, the trend of “economic burden” decreased until it reaches a minimum in 2017 (44 inactive for every 100 people of working age) with the reversal of this trend extending from that date, mainly due to the increase in the elderly population in both absolute and relative terms. By 2060, the ratio
2 The World Health Organization (WHO) defines elderly people as people with age equal or greater than 60 years old (IBGE,
is projected to be 67 inactive people for every 100 of working age. Taking into account only the elderly, this quota will rise from 14 per 100 people in 2020 to 43 in 2060. Therefore, there is a growing increase in the aging index of the population (number of people of 60 and more years old, for every 100 people under 15 years), which rise from 11.2% in 1960 to 46.9% in 2020. Maintaining the forecasts of future declines in fertility and mortality rates, Brazilian population will have a ratio of 173 elderly persons for every 100 children and adolescents in 2060 (IBGE, 2019).
FIGURE 1 Age pyramids Brazil – 1970-2060 15% 10% 5% 0% 5% 10% 15% 0-4 5-9 10-14 15-19 20-24 25-29 30-34 35-39 40-44 45-49 50-54 55-59 60-64 65-69 70-74 75-7980 + 1970 Men Women Years
15% 10% 5% 0% 5% 10% 15% 0-4 5-9 10-14 15-19 20-24 25-29 30-34 35-39 40-44 45-49 50-54 55-59 60-64 65-69 70-74 75-7980 + 2020 Men Women Years 15% 10% 5% 0% 5% 10% 15% 0-4 5-9 10-14 15-19 20-24 25-29 30-34 35-39 40-44 45-49 50-54 55-59 60-64 65-69 70-74 75-7980 + 2060 Men Women Years
The Brazilian elderly profile
Along with the demographic transition, the elderly population in Brazil has grown significantly since 1950. According to IBGE (2014a), the national population was composed in 1950 of 2.6 million seniors representing about 4.9% of the population. In 2020, the elderly population is already 30.1 million representing about 14.3% of the population. IBGE estimates (2019a) show that by 2060, this group will grow at a rate of 3.6% per year compared to 0.2% of the population, reaching 73.4 million people by 2060, which will be equivalent to 32.2% of the population. According to the World Bank (2019), this percentage will be close to the Japan’s demographic, the country with the highest proportion of elderly in the world.
However, the distribution of the elderly throughout the national territory is not homogeneous, due to the behavior of fertility and mortality rates, migration, socio-economic and political aspects of each region (TORRES; SÁ, 2008). According to IBGE (2019b), most of the population aged 60 or more is concentrated in the Southeast region (46.4%) and the Northeast region (25.5%), followed by the South region (15.5%). The lower percentage of elderly is in the Midwest region (6.6%) and North region (5.8%). It is noteworthy that 70% of the population aged 60 or more are concentrated in the Southeast and Northeast regions. When analyzing the proportion of elderly in the population of each region, this segment is more representative in the Southeast region (16.5%) and South region (16.1%) followed by the Northeast region (13.5%) and Midwest region (12.4%) and, finally, the North region (9.4%). Therefore, the Southeast region represents the pioneer region in the decline of fertility and mortality rates in Brazil followed by the South region; while the North region has the lowest concentration and relative proportion of elderly (IBGE, 2019b).
According to Cunha (2000), the highest concentration of elderly in the Southeast region can be explained by the attractiveness of their metropolitan areas, which have experienced significant economic growth, mainly due to the development of the industrial sector. However, as Otero (2001) explains, the concentration of elderly in the Northeast region results from the emigration of the young population to more developed regions. According to IBGE (2014a), the low percentage of elderly in the North and Midwest region is due to the high levels of past fertility, although in recent years, the population in these regions has been aging.
Table 2 shows differences among the elderly population in Brazil. According to the gender ratio, the number of women is higher than men in this segment. In 1980, women accounted for 52.7% of the elderly population, rising to 55.8% in 2018. By analyzing regional differences, the distribution by gender of the elderly is more pronounced in the Southeast region (56.6% of women), followed by the Northeast and South regions (56.2% and 54.9% of women, respectively), Midwest region (53.6% women) and, finally, the North region (53.2% female). This disparity can be explained by global differences in life expectancy between genders; though these differences are greater in Brazil given that on average women live eight years longer than men (IBGE, 2019b).
TABLE 2
Distribution of people 60 years or older by gender, household situation and race, by major regions Brazil – 2018
Percentage
Major
regions MaleGenderFemale Household situationUrban Rural White EthnicityBlack Other (1)
Brazil 44.15 55.85 85.56 14.44 51.30 9.69 39.02 North 46.84 53.16 76.05 23.95 22.35 13.10 64.55 Northeast 43.78 56.22 72.45 27.55 28.83 12.58 58.59 Southeast 43.42 56.58 93.52 6.48 58.34 9.44 32.23 South 45.07 54.93 84.12 15.88 80.35 4.37 15.28 Midwest 46.40 53.60 89.83 10.17 41.15 10.30 48.55 Source: IBGE (2019b).
(1) Asian, bi/multiracial and indigenous ethnicities.
The difference in life expectancy in Brazil can be explained by the ratio of male to female mortality. This index demonstrates how high male mortality in Brazil is compared to female mortality across all age groups. This higher mortality rate among Brazilian men is largely due to complications of coronary atherosclerosis, homicide, transport accidents, mental and behavioral disorders, including those resulting from the abuse of alcohol and other psychoactive substances, and diseases of the digestive system, with emphasis on liver cirrhosis, associated or not with alcoholism (ORTIZ; YAZAKI, 1984; VALLIN, 2004; LAURENTI et al., 2005).
The urban-rural distribution of the elderly population is also related to the constant continual urbanization of Brazil’s population. The proportion of elderly people living in rural areas decreased from 23.3% in 1990 to 16.5% in 2010. The urbanization of the elderly population followed the trend of the total population, which was around 85.6% in 2018 (IBGE, 2019b). According to Barbot-Coldevin (2000), demographic projections show a trend towards greater urbanization along with an increase in the elderly population, with a higher proportion of elderly men in rural areas and elderly women in urban areas. According to the authors, living in the city affords elderly women, especially those who are single or widowed, the benefit of close proximity to family members, healthcare services and other amenities. Distribution by race shows that the vast majority of the elderly population identified themselves as White (51.3%), followed by Other (39.0%) and Black (9.7%). This proportion changes in parts in the North, Northeast and Midwest regions, which have a higher percentage of elderly who reported as Other (64.6%, 58.6% and 48.5% respectively). In the South, the vast majority of the elderly population identifies as White (80.3%) (IBGE, 2019b).
When looking at the status of the elderly within households, 50.3% were household heads in 2018. Elderly spouses accounted for about 18.6% in 2018, which means that the vast majority (68.9%) of this population occupies a prominent role in the organizational model of Brazilian families. Among single person households, 15.2% were those of elderly men compared to 23.2% for older women in 2018 (IBGE, 2019b). It is worth noting that in 1970, the single person households were approximately 5% for elderly men and 8%
for older women (IBGE, 2014a). According to Berquó et al. (1990), an explanation for this phenomenon is that the number of elderly women in a population determines the growth of single-parent families and single-person female – led households. Widowers and divorced Brazilian men remarry more frequently than do widowed or divorced Brazilian women. Therefore, household circumstance varies significantly according to the gender and age of the household head.
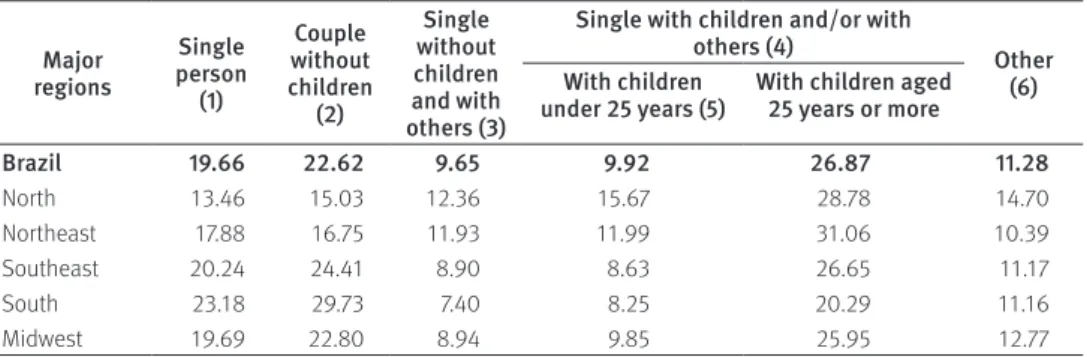
Table 3 shows the distribution of elderly people living in private households by type of living arrangement and major regions in 2018. The most common household type is still composed of couples with children and/or other relatives (36.8%), followed by households of couples without children (22.6%), single-person households (19.7%), other (11.3%) and single living with others (9.7%). The distribution does not change in the major regions, and the highest proportion of households consisting of elderly couples without children (29.7%) and single person households (23.2%) is found in the South region (IBGE, 2019b).
TABLE 3
Distribution of elderly people living in private households by type of living arrangement and major regions
Brazil – 2018 Percentage Major regions Single person (1) Couple without children (2) Single without children and with others (3)
Single with children and/or with
others (4) Other (6) With children
under 25 years (5) With children aged 25 years or more
Brazil 19.66 22.62 9.65 9.92 26.87 11.28 North 13.46 15.03 12.36 15.67 28.78 14.70 Northeast 17.88 16.75 11.93 11.99 31.06 10.39 Southeast 20.24 24.41 8.90 8.63 26.65 11.17 South 23.18 29.73 7.40 8.25 20.29 11.16 Midwest 19.69 22.80 8.94 9.85 25.95 12.77 Source: IBGE (2019b).
(1) Household with people 60 years or older living without spouses, children and other relatives or individual. (2) Household with responsible person and spouse, having at least one person aged 60 or over, without children, other relatives and household members. (3) Household with a responsible person with or without a spouse, having at least one person aged 60 or over, living with other relatives and/or individual of any age and without children. (4) Household with a responsible person with or without a spouse, at least 60 years of age or older, living with children and/or with other relatives and/or individual, of any age. (5) Household with at least one child under 25 years of age. (6) Household with people aged 60 or over, only as another relative and/ or family member.
Educational levels are an indicator of the socio-economic status of a population. In the case of the elderly, literacy is an indicator of past Brazilian educational policies. Literacy within a population is measured by the proportion of those declaring themselves as knowing how to read and write at least a simple note. The proportion of the literate elderly population increased from 55.8% in 1991 to 77.7% in 2018. The average number of years of study among the elderly varies by region, ranging from 6.8 years in the Southeast to 5 years in the Northeast region (IBGE, 2019b) (Table 4).
TABLE 4
Average years of study attained by the elderly and distribution by groups of years of study, by major region
Brazil – 2015
Percentage
Major
regions Average years of study
Distribution by groups of years of study No education or
less than 1 year 1 to 3 years 4 to 8 years 9 years or more
Brazil 6.1 25.8 17.1 34.7 22.4 North 5.3 32.7 18.9 30.6 17.9 Northeast 5.0 39.0 17.1 25.5 18.3 Southeast 6.8 17.6 15.6 40.3 26.4 South 6.6 15.6 18.3 43.0 23.1 Midwest 6.1 26.4 18.1 31.4 24.1 Source: IBGE (2016).
Despite the increase in elderly literacy in recent years, the low average education of this population is a reflection of unequal access to primary education among particular social groups from the 1930s to at least the 1950s. Using as the definition of “functionally illiterate” those people with less than 4 years of study, Table 4 shows that approximately 43.9% of the elderly population as a whole had not obtained even this minimum level of education as of 2015. In the case of the Northeast and North regions, this percentage is even higher, about 56.1% and 51.5%, respectively. In the Southeast and South regions, functional illiteracy affects about 33.3% and 33.9% of the elderly, respectively. However, there was a significant improvement in the number of literate elderly people in Brazil, which represented 45% in 1991, compared to 23.3% in 2015, indicating greater access to education due to improvements in access to education since the 1950s (IBGE, 2016).
The average income of the elderly indicates the ability to purchase goods and services by this segment of the population. Whereas the minimum wage value is based on the basic needs of individuals, it is possible to consider this variable as an indicator of welfare and poverty. In this case, there has been no improvement in the last decades: while in 1991 more than half of the elderly (52.1%) had income less than the minimum wage, in 2018 this proportion remained consistent, at around 51.1%. However, regional differences are observed with most of the elderly in the Northeast (53.2%) and North (51.1%) regions presenting income up to minimum wage (Table 5) (IBGE, 2014a).
While labor income is usually responsible for most household income, for the elderly, labor income is not the major income share. In 2015, about 68.6% of an elder person’s income came from retirement and/or pension, 27.7% from labor, and 3.7% from other sources. This difference is even greater in the Northeast and South regions, where the income derived from retirement and/or pension reached 74.5% and 70.4%, respectively (Table 6) (IBGE, 2016). Brazil was one of the few countries in which it was possible to retire without a minimum age. Women and men who retired by contribution years were on average 8 to 9 years younger than in LAC (or 11 and 10 years younger, respectively,
than Organization for Economic Co-operation and Development – OECD countries), with the average retirement ten years later (for both groups of countries and for both genders) (ROCHA; CAETANO, 2008). The death pension benefit in Brazil, mostly received by women, has no criteria restricting eligibility: there is no minimum or maximum age requirement; no contributory shortage is required; nor does the number of children, or their age at the death of the father (or mother) matter. The pension is equivalent to 100% of the benefit or salary to which the insured was entitled before they died. For this reason, death pensions in Brazil are considered one of the most benevolent in the world (GIAMBIAGI et al., 2004; TAFNER, 2007).
TABLE 5
Distribution of the elderly by monthly income classes from all sources, by major region Brazil – 2015
Percentage
Major regions Up to 1/2 minimum Distribution of the elderly by monthly income classes from all sources wage More than 1/2 to 1 minimum wage More than 1 to 2 minimum wages minimum wagesMore than 2
Brazil 10.0 41.1 23.5 25.4 North 9.8 51.2 21.1 17.9 Northeast 9.4 52.5 22.2 15.9 Southeast 11.5 32.3 24.7 31.4 South 8.5 34.0 25.5 32.1 Midwest 9.0 39.4 22.4 29.2 Source: IBGE (2016).
Note: No results are shown for people with zero monthly income from all sources or without a declaration of monthly income from all sources.
TABLE 6
Distribution of elderly income by source of income, by major region Brazil – 2015
Percentage
Major regions Distribution of elderly income by source of income Labor Retirement and/or pension Other sources
Brazil 27.7 68.6 3.7 North 27.5 67.0 5.5 Northeast 21.6 74.5 3.9 Southeast 30.2 67.2 2.6 South 27.0 70.4 2.6 Midwest 32.6 64.2 3.2 Source: IBGE (2016).
In summary, the elderly profile in Brazil has the following characteristics: the majority are women (55.8%), and the percentage of women varies across regions from 53.2% in the Northern region to 56.6% in the Southeast region; most elderly identify themselves as White (51.3%), with this indicator reaching 80.3% of elderly people in the South and only 22.3% in the North; about 85.6% of the elderly live in urban areas, especially in the
Southeast region (93.5%); 36.8% of the elderly live as couples with children and/or other relatives, with the highest proportion in the North region (44.4%); 50.3% of the elderly were male household heads, 54.5% of the elderly had an education averaging 6.1 years, ranging from 5.0 years in the Northeast region to 6.8 years in the Southeast; 25.8% had less than a year of study, in the Northeast region this indicator reached 39%; and 51.1% of the elderly have income from all sources equaling less than the minimum salary wage.
Socioeconomic condition of the elderly
After identifying the socio-demographic profile of the elderly, it is important to understand the socioeconomic condition of this important segment of the Brazilian population. The elderly is more vulnerable to falling into poverty than other age groups. The elderly has a lesser chance of recovering from a negative income shock, and they have difficulties (re)entering the labor market, because productivity and employability decline with age from around the age of 60 (HURD, 1991). As a result of the difficulty of recovering from negative income shocks among the elderly, poverty tends to be a more permanent feature than with other groups in society.
It is evident that the State and Federal governments face a challenge in terms of providing social security to Brazil’s aging population. To address this challenge, Brazil approved a social security reform (Nova Previdência) at the end of 2019. The most relevant changes were as follows: minimum age – private sector and public service workers must be at least 65 years old (men) and 62 (women) to retire; retirement by age – for those already in the labor market, 15 years of contribution is required for both men and women; and for new entrants into the labor force, the time contribution remains the same for women, but rises to 20 years for men; retirement calculation – the benefit will be calculated based on the employee's entire contribution time: for those who are already in the labor market, with 15 years of contribution, it is already possible to be entitled to 60% of the benefit amount; post-death pension – the amount will fall to 60% of the holder's benefit, plus 10% per additional dependent, limited to 100% of the benefit amount; accumulation of benefits – the insured will remain with the benefit of the highest value and a portion of the lowest value, in a staggered manner; welfare benefits for the elderly and the disabled – there was no change in the rule for the Benefício de Prestação Continuada (BPC), which is paid to elderly and low-income people, even if they have not contributed to Social Security. Obviously, there is a transition period that will still allow many people to retire under the old rules.
Table 7 shows the percentage distribution of the elderly retired3 and/or pensioners4 by
gender in 2015, by major Brazilian regions. Of the elderly, 31.4% did not receive retirement
3 Action to move away from work after completing a certain period of service (stipulated by law) or reached a certain age,
or for health reasons, is put into inactivity and starts receiving an income.
4 A monthly payment corresponding to the value of the remuneration or income of the server due to its dependents, from
the date of their death. It may originate from the Armed Forces, the Social Security Plan or a Federal Social Security Institute (INSS), state or municipal, including FUNRURAL – Rural Workers' Assistance Fund.
or pension, whereas 9.9% of the elderly accumulated retirement and death pension. The retiree’s ratio does not change much regionally, being higher in the Northeast (54.8%) and North regions (52.8%). The proportion of elderly receiving retirement and pension is higher in the South region (12.3%). However, the proportion of elderly who accumulated both was differentiated by gender: while only 2.8% of men received both benefits, about 18.4% of women were in this condition. The high proportion of elderly who did not receive retirement or pension plans (31.4%) may be related to greater inclusion in the labor market, as the occupancy rate was 20.9% in this age range. However, for those who were not retired or pensioners, the occupancy rate was 43.7% (IBGE, 2016).
TABLE 7
Distribution of elderly who receive retirement and/or death pension by gender, by major region Brazil – 2015
Percentage
Major regions Distribution of elderly income by source
Retirees Pensioners Retirees and pensioners Other Total Brazil 50.8 7.9 9.9 31.4 North 52.8 7.7 6.2 33.2 Northeast 54.8 7.9 11.0 26.2 Southeast 48.6 8.7 9.5 33.4 South 50.7 7.1 12.3 30.0 Midwest 49.3 6.8 7.7 36.0 Elderly men Brazil 54.9 0.8 2.8 41.6 North 51.7 2.0 2.2 44.1 Northeast 60.4 0.8 3.9 34.9 Southeast 53.9 0.5 2.3 43.2 South 56.0 0.7 3.7 39.6 Midwest 49.0 0.9 1.3 48.5 Elderly women Brazil 46.0 16.5 18.4 19.2 North 54.2 14.7 11.2 19.9 Northeast 49.3 14.9 18.0 17.9 Southeast 41.4 19.3 18.7 20.6 South 44.1 15.1 22.9 17.9 Midwest 49.6 14.9 16.3 19.2 Source: IBGE (2016).
This vulnerability, or the difficulty of recovering from negative income shocks, depends directly on the state's role in ensuring income for the elderly. According to Turra and Rocha (2010), reducing the level of poverty among this segment in Brazil was mainly due to the increase in public spending on retirement and pensions after the 1988 Constitution. Over the past three decades, poverty rates in Brazil across all segments have been declining gradually.
There were two distinct periods of poverty reduction: 1980-2000, characterized by a moderate reduction; and 2001-2015, when there was a significant acceleration in the reduction of poverty. According to Ferreira and Leite (2009), four factors contributed to this reduction during the first period: the non-contributory benefits established after the 1988 Constitution, providing income for retirees who failed to meet the contribution criteria; all the measures taken by the Brazilian government in the early 1990s that stabilized the economy by keeping inflation under control, which exerted positive effects primarily on the real wages of the poorest; changes associated with the first and second phases of demographic transition, which reduced the size of families, and their dependence ratio, thereby reducing poverty by increasing the relative number of adults; and finally, progress and steady increase in human capital, investment in health and education, as well as female participation in the workforce, helping to boost family income.
As Barros et al. (2006) state, policies to reduce inequality have been the key to poverty reduction in the second period of poverty reduction (2001-2015). Income transfer programs and the minimum wage policy explain much of the reduction of poverty and inequality in Brazil during that period. The authors also assert that counterfactual analyses reveal a 48% decline in income inequality between 2001 and 2005 due to the creation of income transfer programs (especially the Bolsa Familia Program) and the expansion of the non-contributory social security system. In addition, the minimum wage increases favored lower income workers and beneficiaries of the death pension system, helping to further reduce levels of inequality and poverty.
Poverty reduction through income transfer has not been homogeneous among segments of the population. A large number of studies in Brazil5 emphasize the importance of public
transfers, particularly of social security benefits,6 in reducing poverty by age groups. Some of
these studies use simple counterfactual analysis to compare poverty rates with and without the public benefits. Turra et al. (2008), among the most recent studies, uses 2005 data for households to show that the incidence of poverty among the elderly in Brazil would grow from 3.9% to 63.5%, if they did not receive government benefits. Coetlar and Tornarolli (2009) compared poverty rates with and without pensions for two major age groups – over 60 years and below 15 years – using 2008 data for several countries in Latin America. According to the authors, Brazil, Argentina, Chile and Uruguay are countries with large and generous pension systems, which have relatively greater impact on poverty rates among the elderly. Coetlar and Tornarolli (2010) confirm that the simulated poverty rate among the elderly in Brazil in 2008 would fall from 49.3% to 4.2% after considering income transfers.
5 Lavinas and Versanos (1997), Rocha (1998), Brant (2001), Silva (2002, 2003, 2004, 2005), Rocha (2005), Barreto (2005),
Barros et al. (2006, 2007), Costa and Salvato (2008), Turra et al. (2008), Cotlear and Tornarolli (2010), Turra and Rocha (2010) and Marinho et al. (2011).
6 Benefits that are intended to replace the remuneration of the activity in disease occurrences, disability, death, old age
The influence of public transfers on poverty reduction among different age groups in Brazil is demonstrated by Turra and Rocha (2010), who compared poverty rates by age in three years: 1981, 1995 and 2008. The authors estimated poverty rates based on the World Bank's poverty line of US$ 2.00 per day in purchasing power parity in 2005 with and without public transfers, including contributory and non-contributory retirement benefits as well as conditional cash transfers from the Bolsa Familia program. Before the Constitution of 1988 and the expansion of social welfare programs, on average 53% of the population lived in poverty, and the incidence varied little according to age – 65.2% for children under 15 years and 47.7% among the elderly. The authors maintain that since income transfer programs had not yet been established in 1981, these results were not surprising. The impact of excluding transfers was virtually zero for poverty rates among children, but about 25% of the elderly population had not received public pensions in 1981, so the exclusion of social security benefits had a moderate effect on the poverty levels of elderly, approximately 20% on average.
In 1995, the incidence of poverty was much lower among the elderly (13.6%) than among children (40.8%). Turra and Rocha (2010) confirm that the main factor in reducing poverty among the elderly has been the expansion of social security benefits. Finally, in the 2008, poverty rates declined again for all ages. The development and expansion of the conditional cash transfer programs (Bolsa Familia) reduced the percentage of children living in poverty. However, the impact of social protection to the elderly with increasing of non-contributory benefits is even higher, and virtually eradicates poverty in the segment. The authors conclude that for every elderly person in poverty there were almost 16 children in the same condition in 2008. Combined with the data from Turra and Rocha (2010), it can safely be said that public transfers in Brazil have been very effective in reducing poverty among the elderly.
Moreover, the percentage of the elderly who have monthly income less than or equal to one minimum wage was reduced from 52.1% in 1991 to 39.7% in 2013; the income of the elderly from the retirement and/or pension accounts on average for 67.6% of the total income of the elderly and approximately 76.1% of the elderly receive retirement, pensions or both benefits. These information, coupled with other studies such as Turra and Queiroz (2005), Turra et al. (2008), Coetlar and Tornarolli (2009), and Turra and Rocha (2010), that assessed the impact of cash transfers on the levels of poverty among the elderly, show that the vast majority of the elderly in Brazil receive government income transfer funds that have a positive effect on poverty reduction in the segment. For example, Turra and Queiroz (2005) showed that while family transfers are the primary source of care for children, the public sector is the main guarantor subsidizing the income of Brazil’s elderly. The volume of resources per capita transferred by the public sector to the elderly is close to 7 times higher than that transferred to children.
These studies are very instructive, but they have a methodological flaw in terms of causal relationships, since they do not include behavioral effects. In the case of poverty rates, for example, the simulations ignore the possibility that a slower expansion of welfare programs could have created incentives for a greater supply of labor and savings. In addition, many counterfactuals analyses found in the literature are data-driven by an artificial generation and thus ignore the historical determinants of poverty trends related to period and generation changes. Despite these factors however, it is clear that public transfers in Brazil have been very effective in reducing poverty among the elderly. Additionally, these studies show that poverty levels for this group are very low by international standards, while in the opposite would be true in the absence of public transfers.
Conclusions, consequences, and trends of population aging
The rapid aging of the Brazilian population and the reliance of the elderly population on income transfer programs will have great impact on Brazil into the future. The increase in the dependency ratio of the elderly and the fall of the pension support ratio7 can cause
an increasing number of beneficiaries who depend on a decreasing number of workers. In addition, early retirement and informality in the labor market decrease the pension support ratio, making it difficult to project population distributions and predict the demographic dependency ratio. These issues may affect policies aimed to help the elderly to avoid poverty in the future (WORLD BANK, 2011). According to information from the IBGE (2019), the demographic situation is still favorable, because the number of potential contributors in 2015 is six times higher than the number of elderlies. In 2050 the situation will be less favorable; the number of potential contributors will only be twice as large as the number of elderly people.
The share of the working-age population will grow until 2025, resulting in more workers in the labor force, which means that there will be an increase in the resources production. While it is expected that the mature fraction of the labor force (19-25 years) will continue to grow until the end of 2020, the growth of the future workforce (5-24 years) has started to slow. Since the mature workforce is responsible for most of the economic activity and consequently generates a larger part of wealth, Brazil has the opportunity to increase growth, savings and government revenues. However, in the medium term, the expected changes in the age structure due to aging will pose challenges to economic growth.
Queiroz, Turra and Perez (2006) showed that demographic changes in Brazil had positive impacts on economic growth, but the lack of investments in human capital and the inefficiency of some institutions in the country have hindered economic growth, outpacing the potential growth produced by demographic dividends or demographic bonuses. According to Queiroz and Turra (2010), this concept has been presented as a combination
of two dividends: the first is related to a temporary increase in the ratio of producers to consumers in the population; and the second is related to the creation of wealth that arises in response to the population aging. However, Brazil is not taking advantage of the positive impacts of both demographic dividends. In recent decades, the Brazilian economy grew at slower rates than what the demographic dividends alone would predict (QUEIROZ; TURRA, 2010). Therefore, to compensate for the slower economic growth, Brazil will need to increase productivity in the labor market. Aging can have negative effects on productivity, which can affect the aggregate economy in the coming years when a large proportion of the workforce will be beyond their peak of productivity.
International experience shows that specific training and improvement programs can be effective to soften or nullify the decreased ability to learn new skills related to age. Such programs may stabilize or even reverse declines of inductive reasoning and spatial orientation. In addition, exercises for speed, reasoning and memory can improve the functional level (WORLD BANK, 2007). The effectiveness of these programs depends crucially on the time and the quality of education that workers received when younger (HECKMAN et al., 2005). Therefore, the country’s choice in terms of education, health and welfare at this stage will determine the country’s ability to invest adequately in their youth.
As the World Bank (2011) discusses, economic behavior and macroeconomic indicators change both systematically and endogenously with aging. The impact of population aging on savings (and consequently on growth) is particularly important. It is traditionally believed that aging will reduce savings and thus growth, because of the decline in the share of savers in the population, as implied by life-cycle theory. However, under certain circumstances, Brazil can avoid a reduction in savings and growth. In fact, if government policies are formulated appropriately, properly and in time, it is likely that strong capital accumulation and growth will increase permanent income and the wealth associated with it.
According to Turra and Holz (2009), the savings rates by age do not follow a conventional pattern in Brazil and do not diminish as people age, being stable and low after the age of 40, below the OECD average. However, developing countries often have high savings rates for the elderly. Therefore, we expect that the savings rate will increase in the future given that the high savings rate of the current aging population in Brazil. This result will depend on several things: the future structure of the pension system which needs a large part of the population must contribute in order to be successful; whether public pensions remain relatively high, which can discourage savings; and whether the State continues to promote the reduction of poverty and social inequality.
The impact of population aging becomes quickly apparent when examining projections of public expenditure on education, health and welfare. These costs depend on the average robustness of these benefits received by each individual and the age structure of the population. The portion of economic output directed to education, health, welfare and the public sector can be broken down into two multiplicative components. First, the demographic factor measures the size of the demand for a specific benefit (education, health and security) by the working
age population. Second, the economic factor measures the average benefit received by the beneficiary. Regarding some benefit levels, public sector spending on education (20.20% of GDP per capita in Brazil vs. 20.28% in the OECD members) and health (11.77% of GDP in Brazil vs. 12.58% in the OECD members) in Brazil resembles that of the OECD countries, but the age structure of its population is much younger (high demographic factor) (WORLD BANK, 2019).
According to World Bank (2011), while each sector faces different challenges and opportunities with population aging, the projection of all three trajectories of spending through a comparable methodology provides an understanding of the interconnections and choices available to Brazilian policy formulators. Very often, political reforms of the social security system, health system, and education systems are discussed, analyzed and implemented separately without considering relationships among the three systems. The changes in the age structure of the population projected for the next four decades will cause additional fiscal pressures on the social security and health systems financed by the government.
So, what policies could be adopted to help mitigate the inevitable strain on the growing social spending caused by rapid population aging in Brazil? First, with respect to education, the accelerated reduction of school-age population provides a unique opportunity to increase investment per student without adding much weight to public finances. Some of the resources saved in primary education could support the expansion of day-care centers and preschools, and help in financing the expansion of better quality and full-time education at the secondary and high school level. As a result, the share of GDP allocated for education would decline gradually according to the reduction of the school-age population – while maintaining levels of investment per student at the levels of OECD countries (WORLD BANK, 2011). According to Lam and Marteleto (2008), population aging is associated with great changes in family size and the size of birth cohorts. Brazil experienced a period of falling family and cohort size. From the standpoint of a child entering school and education investments, smaller families may mean less competition for resources at the family level and public level, leading to higher school enrollment and better school outcomes.
Second, health care is emerging as a major fiscal challenge in the coming decades. There are two main forces behind the need for increased health spending with population aging: the growing proportion of elderly in the population and the increasing use of health care among the elderly. According to World Bank (2011), the health care system must adapt to the different demographic and epidemiological profiles of the growing elderly population in Brazil, because the magnitude of the increase in health spending associated with population segment will depend crucially on the overall health of the aging population. According to Mendes et al. (2012), population aging and increased life expectancy are already putting pressure on the Sistema Único de Saúde – SUS due to the epidemiological transition experienced in Brazil, characterized by a decrease in mortality from infectious diseases, an increased incidence of chronic degenerative diseases and mental disorders, as well as the growth of external causes, such as homicide. Therefore, public investments should be made to increase outpatient services, medical clinics, surgical clinics and rehabilitation.
Preventing and delaying disease and disability, and maintaining health, independence and mobility in an aging population will continue to be one of Brazil’s greatest challenges.
As noted in the previous sections, regional differences in the Brazilian demographic transition resulted in regional differences in the proportion of elderly people, with this population concentrated in greater numbers in the South and Southeast regions. These differences complicate public policies addressing investments in health care and education, which should be targeted differently in different Brazilian regions. For example, because the elderly population is more concentrated in the South and Southeast regions, citizen voters may indicate a preference for spending on health care rather than education in these regions, whereas in the North and Northeast regions the priorities are different. Another contrast is that the North and Northeast regions are more rural than other regions, making access to health care more difficult. Investments in clinics and telemedicine will be important in these regions. Finally, a focus on wellness programs targeting nutrition and exercise as a prevention against chronic diseases like diabetes and heart disease will be important in the South and Southeast regions whereas gaining access to running water will be important in the North and Northeast regions. The Federal Government bears a greater share of health investment compared to states and municipalities and, consequently, a higher capacity to correct the inequalities generated by regional age differences (SALDIVA; VERAS, 2018). Regarding investments in education, states and municipalities have a higher share in the total investments, being the main parties responsible for perceiving age changes and balancing investments in education (MACIEL, 2012). In addition, it is also important to improve the regulation of public service management alternatives by private parties, always with the objective of improving the service provided to the population.
Finally, in terms of public security, without recent reforms (1999 and 2003), spending on pensions would have increased from 10% of GDP in 2005 to an astounding 37% of GDP in 2010, purely the result of aging out of the workforce. The problem of sustainability in terms of Brazil’s social security expenditure has not been resolved, with the projection that spending on social security will double to 22.4% of GDP in 2050 (WORLD BANK, 2011). According to Tafner et al. (2015), retirement, pension and old-age care expenses will at least double in real terms over the next 20 years, reflecting the effect of an aging populations combined with poorly enforced benefits rules. It is estimated that this spending will increase from R$ 338 billion in 2015 to R$ 725 billion in 2025 and reach at least R$ 1 trillion in 2050, at today's values, not counting the retirement of public servants. The authors do not take into consideration the 2015 Progressive Rule 85/95-point system in their calculations for women/men retiring by contribution time.8
8 The General Social Security Regime (RGPS) established that retirement by age would be granted upon proof of a minimum
of 180 contributions or 15 years, as well as 60 years for women and 65 for men. However, at the end of 2015, the government changed the rules for retirement, in which the calculation includes the number of points reached by summing the age and year of contribution of the insured – the so-called Progressive Rule 85/95. Thus, the sum of the age and years of contribution of the women must reach 85 points and men, 95 points.
For this review, we verified that the Brazilian demographic transition has been occurring along with the growing and progressive aging of the Brazilian population. First, we examined the profile of the Brazilian elderly population, looking at the differences in gender, income, geographical characteristics and household structure. We then found that the great majority of the elderly rely on income from public social security programs that are demonstrably and directly responsible for the reduction of poverty in this segment in recent years. Finally, there have been some natural consequences and changing trends in population aging requiring that the government devote significant effort to adjust health and social security spending in response to the greater demand due to the country's demographic change. Therefore, this review paper serves as a starting point for new research problems related to the elderly population that will be emerging in the future Brazil.
References
ALVES, J. E. D. Transição da fecundidade e relações de gênero no Brasil. 1994. 152f. Tese (Doutorado) – Centro de Desenvolvimento e Planejamento Regional, Universidade Federal de Minas Gerais, Belo Horizonte, 1994.
ALVES, J. E. D. A polemica Malthus versus Condorcet reavaliada à luz da transição demográfica. Rio de Janeiro: Escola Nacional de Ciências Estatísticas, 2002. (Textos para Discussão, n. 4). ALVES, J. E. D. A transição demográfica e a janela de oportunidade. São Paulo: Instituto Fernand Braudel de Economia Mundial, 2008.
BARBOT-COLDEVIN, J. Desigualdades baseadas en el gênero: la adulta mayor y su mayor vulnerabildad. In: ENCUENTROLATINOAMERICANO Y CARIBEÑO SOBRE LAS PERSONAS DE EDAD. Santiago. Anais [...]. Santiago: Celade, 2000. p. 257-270.
BARRETO, F. A. Crescimento econômico, pobreza e desigualdade: o que sabemos sobre eles? Fortaleza: UFC/CAEN Laboratório de Estudos da Pobreza, 2005. (Série Ensaios sobre a Pobreza). BARROS, R.; CARVALHO, M.; FRANCO, S.; MENDONÇA, R. Uma análise das principais causas da queda recente na desigualdade de renda brasileira. Econômica, Rio de Janeiro, v. 8, n. 1, p. 117-147, 2006.
BARROS, R.; CARVALHO, M.; FRANCO, S.; MENDONÇA, R. Determinantes imediatos da queda da desigualdade brasileira. Rio de Janeiro: Ipea, 2007. (Texto para Discussão, n. 1253).
BELTRÃO, K. I.; CAMARANO, A. A.; KANSO, S. Dinâmica populacional brasileira na virada do século XX. Rio de Janeiro: Ipea, 2004. (Texto para Discussão, n. 1034).
BERQUÓ, E. M.; COLETA, O. de; CAVENAGHI, S. M. Arranjos familiares não-canônicos no Brasil. In: VII ENCONTRO NACIONAL DE ESTUDOS POPULACIONAIS. Anais […]. São Paulo: Abep, 1990. BRANT, R. Desenvolvimento social, previdência e pobreza no Brasil. Conjuntura Social, v. 12, n. 2, p. 65-117, 2001.
BRITO, F. C. A transição demográfica no Brasil: as possibilidades e os desafios para a economia e a sociedade. Belo Horizonte: UFMG/Cedeplar, 2007. (Texto para Discussão, n. 318).
BRITO, F. C. Transição demográfica e desigualdades sociais no Brasil. Revista Brasileira de Estudos de População, São Paulo, v. 25, n. 1, p. 5-26, 2008.
BRITO, F. C.; CARVALHO, J. A. M. de; BAENINGER, R.; TURRA, C. M.; QUEIROZ, B. L. A transição demográfica e as políticas públicas no Brasil: crescimento demográfico, transição da estrutura etária e migrações internacionais. Cadernos NAE (Núcleo de Assuntos Estratégicos da Presidência da República). Belo Horizonte, n. 7, 2007.
CARVALHO, J. A. M.; PAIVA, P. T. A.; SAWYER, D. R. A recente queda da fecundidade no Brasil: evidências e interpretação. Belo Horizonte: Cedeplar/UFMG, 1981.
CARVALHO, J. A. M.; WONG, L. Demographic and socioeconomic implications of the rapid fertility decline in Brazil: a window of opportunity. In: MARTINE, G.; GUPTA, M.; CHEN, L. (ed.). Reproductive change in India and Brazil. Oxford: Oxford University Press, 1998. p. 208-239. CARVALHO, J. A. M.; BRITO, F. A demografia brasileira e o declínio da fecundidade no Brasil: contribuições, equívocos e silêncios. Revista Brasileira de Estudos de População, v. 22, n. 2, p. 351-369, 2005.
CASTIGLIONI, A. H. Inter-relações entre os processos de transição demográfica, de envelhecimento populacional e de transição epidemiológica no Brasil. In: CONGRESO DE LA ASOCIACIÓN LATINOAMERICANA DE POBLACIÓN, 5. Anais […]. Montevideo, Uruguay: Alap, 2012.
COSTA, A. A. B.; SALVATO, M. A. Análise contrafactual do programa de transferência de renda bolsa família para o período 2004-2006. In: SEMINÁRIO SOBRE A ECONOMIA MINEIRA, 13. Anais […]. Diamantina, MG: Cedeplar/UFMG, 2008.
COTLEAR, D.; TORNAROLLI, L. Poverty, the aging and the life cycle in LAC. In: WORKSHOP FOR THE REGIONAL STUDY ON DEMOGRAPHIC CHANGE AND SOCIAL POLICY IN LAC. Proceedings […]. Washington: World Bank, 2009.
CUNHA, J. M. P. da. Dinâmica demográfica e seus impactos na trajetória da população em idade escolar. In: CUNHA, J. M. P. da et al. Demografia e educação: incursões preliminares. Campinas: Nepo/Unicamp, 2000.
FARIA, V. E. Políticas de governo e regulação da fecundidade: consequências não antecipadas e efeitos perversos. Ciências sociais hoje. São Paulo: Anpocs, 1989. p. 62-103.
FERREIRA, F. H. G.; LEITE, P. G. Halving Brazil's poverty: 1983-2006. In: VON BRAUN, J.; HILL, R. V.; PANDYA-LORCH, R. (ed.). The poorest and the Hungry: assessments, analyses and actions. Washington, DC: IFPRI, 2009.
FRIAS, L. A. de M.; CARVALHO, J. A. M. de. Uma avaliação de fecundidade no Brasil, ao início do século. Revista Brasileira de Estudos de População, v. 9, n. 2, p. 193-199, 1992.
FRIAS, L. A. de M.; OLIVEIRA, J. de C. Níveis, tendências e diferenciais de fecundidade no Brasil a partir da década de 30. Revista Brasileira de Estudos de População, v. 8, n. 1, p. 72-111, 1991. GIAMBIAGI, F.; MENDONÇA, J. L. O.; BELTRÃO, K. I.; ARDEO, V. L. Diagnóstico da previdência social no Brasil: o que foi feito e o que falta reformar? Rio de Janeiro: Ipea, 2004. (Texto para Discussão, n. 1050).
GONÇALVES, G. Q.; CARVALHO, J. A. M. de; WONG, L. R. R.; TURRA, C. M. A transição da fecundidade no Brasil ao longo do século XX – uma perspectiva regional. Revista Brasileira de Estudos de População, v. 36, p. 1-34, 2019.
HURD, M. Research on the elderly: economic status, retirement, and consumption and saving. Journal of Economic Literature, v. 28, n. 2, p. 565-637, 1991.
IBGE – Instituto Brasileiro de Geografia e Estatística. Indicadores sociodemográficos e de saúde no Brasil. Rio de Janeiro, 2009.
IBGE – Instituto Brasileiro de Geografia e Estatística. Projeções da população: Brasil e Unidades da Federação. Rio de Janeiro, 2013.
IBGE – Instituto Brasileiro de Geografia e Estatística. Síntese de indicadores sociais: uma análise das condições de vida da população brasileira. Rio de Janeiro, 2014a.
IBGE – Instituto Brasileiro de Geografia e Estatística. Pesquisa Nacional por Amostra de Domicílios – PNAD. Síntese de indicadores 2013. Rio de Janeiro: IBGE, 2014b.
IBGE – Instituto Brasileiro de Geografia e Estatística. Síntese de indicadores sociais: uma análise das condições de vida da população brasileira. Rio de Janeiro, 2015.
IBGE – Instituto Brasileiro de Geografia e Estatística. Projeção da população. Rio de Janeiro, 2019a. IBGE – Instituto Brasileiro de Geografia e Estatística. Microdados da POF 2017-2018 (Pesquisa de Orçamentos Familiares). Rio de Janeiro, 2019b.
HECKMAN, J. J. F.; CUNHA, L.; LOCHNER, D. V.; MASTERO, V. Interpreting the evidence on life cycle skill formation. Cambridge, MA: NBER, 2005. (NBER Working Paper, 11331).
JORGENSEN, O. H. Macroeconomic and policy implications of population aging in Brazil. World Bank, 2011. (Policy Research Working Paper, n. 5519).
LAM, D.; MARTELETO, L. Stages of the demographic transition from a child's perspective: family size, cohort size, and children's resources. Population and Development Review, v. 34, n. 2, p. 225-252, 2008.
LAURENTI, R.; JORGE, M. H. P. de M.; GOTLIEB, S. L. D. Perfil epidemiológico da morbi-mortalidade masculina. Ciência & Saúde Coletiva, v. 10, n. 1, p. 35-46, 2005.
LAVINAS, L.; VARSANO, R. Programas de garantia de renda mínima e ação coordenada de combate à pobreza. Brasília: Ipea, 1997. (Texto para Discussão, 534).
MACIEL, W. K. S. Metodologia para o cálculo do indicador “Investimento Público em Educação em relação ao PIB” de 2000 a 2010. Brasília: Instituto Nacional de Estudos e Pesquisas Educacional Anísio Teixeira, 2012.
MANTON, K. G.; GU, X.; LAMB; V. L. Change in chronic disability from 1982 to 2004/2005 as measured by long-term changes in function and health in the U.S. elderly population. Proceedings of the National Academy of Sciences of the United States of America, Washington, v. 103, n. 48, p. 18374-79, 2006.
MARINHO, E.; LINHARES, F.; CAMPELO, G. Os programas de transferência de renda do governo impactam a pobreza no Brasil? Revista Brasileira de Economia, v. 65, n. 3, p. 267-288, jul.-set. 2011. MARTINE, G. Brazil's fertility decline, 1965-95: a fresh look at key factor. Population and Development Review, v. 22, n. 1, p. 47-75, 1996.
MEDICI, A. C.; BELTRAO, K. I. Transição demográfica no Brasil: uma agenda para pesquisa. Planejamento e Políticas Públicas, n. 12, p. 16, 1995.
MEDICI, A. C. How age influences the demand for health care in Latin America. In: COTLEAR, D. (ed). Population aging: is Latin America ready? Washington, DC: World Bank, 2011.
MENDES, A. da C. G.; SÁ, D. A. de; MIRANDA, G. M. D.; LYRA, T. M.; TAVARES, R. A. W. Assistência pública de saúde no contexto da transição demográfica brasileira: exigências atuais e futuras. Cadernos de Saúde Pública, v. 28, n. 5. p. 955-964, 2012.
MERRICK, T. W.; BERQUÓ, E. S. The determinants of Brazil's recent rapid decline in fertility. Washington: National Academy, 1983.
MONTEIRO, M. Transição demográfica e seus efeitos sobre a saúde da população. In: BARRADAS, R. et al. (ed.). Equidade e saúde: contribuições da epidemiologia. Rio de Janeiro: Abrasco, Editora Fiocruz, 1997. p. 189-204.
OTERO, V. B. Estudo da mortalidade por desnutrição em idosos na região Sudeste do Brasil, 1980-1997. Dissertação (Mestrado em Ciências na Área de Saúde Pública) – Escola Nacional de Saúde Pública, Fundação Osvaldo Cruz, Rio de Janeiro, 2001.
ORTIZ, L. P.; YAZAKI, L. M. Aumento do diferencial por sexo da mortalidade no Estado de São Paulo. Revista Brasileira de Estudos de População, v. 1, n. 1/2, p. 145-170, 1984.
POTTER, J. E. et al. Mapping the timing, pace, and scale of the fertility transition in Brazil. Population and Development Review, v. 36, n. 2, p. 283-307, 2010.
RIOS-NETO, E. L. G. Passado, presente e futuro da fecundidade: uma visão de idade, período e coorte. Revista Brasileira de Estudos de População, v. 17, n. 1, p. 5-15, 2000.
QUEIROZ, B. L.; TURRA, C. M.; PEREZ, E. R. The opportunities we canoot forgo: economic consequences of population chances in Brazil. In: ENCONTRO NACIONAL DE ESTUDOS POPULACIONAIS, 15. Anais […]. Caxambu: Abep, 2006.
QUEIROZ, B. L.; TURRA, C. M. Window of opportunity: socioeconomic consequences of demographic changes in Brazil. Washington, DC: NTA, 2010.
ROCHA, S. Desigualdade regional e pobreza no Brasil: a evolução – 1981/95. Rio de Janeiro: Ipea, 1998. (Texto para Discussão, 567).
ROCHA, S. Impacto sobre a pobreza dos novos programas federais de transferência de renda. Revista de Economia Contemporânea, Rio de Janeiro, v. 9, n. 1, p. 153-185, jan./abr. 2005. ROCHA, R.; CAETANO, M. O sistema previdenciário brasileiro: uma avaliação de desempenho comparada. Rio de Janeiro: Ipea, 2008. (Texto para Discussão, n. 1331).
SAAD, P. M. Demographic trends in Latin America and the Caribbean. In: COTLEAR, D. (ed.). Population aging: is Latin America ready? Washington, DC: World Bank, 2011. p. 43-78.
SALDIVA, P. H. N.; VERAS, M. Gastos públicos com saúde: breve histórico, situação atual e perspectivas futuras. Estudos Avançados, v. 32, n. 92, p. 47-61, 2018.
SEADE – Fundação Sistema Estadual de Análise de Dados. Estatísticas do registro de civil: mais de um século de informações para o Estado de São Paulo. São Paulo, 2017.
SILVA, M. O. da S. O debate sobre a pobreza: questões teórico-conceituais. Revista de Políticas Públicas, v. 6, n. 2, p. 65-102, 2002.
SILVA, M. O. da S. A política pública de transferência de renda enquanto estratégia de enfrentamento à pobreza no Brasil. Revista de Políticas Públicas, v. 7, n. 2, p. 233-253, 2003. SILVA, M. O. da S. Os programas de transferência de renda na política social brasileira: seu desenvolvimento, possibilidades e limites. Revista de Políticas Públicas, v. 8, n. 2, p. 113-133, 2004.
SILVA, M. O. da S. Os programas de transferência de renda e a pobreza no Brasil: superação ou regulação? Revista de Políticas Públicas, v. 9, n. 1, p. 251-278, 2005.
SCHMERTMANN, C. P. et al. Bayes plus Brass: estimating total fertility for many small areas from sparse census data. Population Studies, v. 67, n. 3, p. 255-273, 2013.
TAFNER, P. Simulando o desempenho do sistema previdenciário e seus efeitos sobre pobreza sob mudanças nas regras de pensão e aposentadoria. Rio de Janeiro: Ipea, 2007.