Survey Methodology 41-1
ISSN 1492-0921
by Paula Vicente, Elizabeth Reis and Álvaro Rosa
The relevance of follow ups in data
collection for the Quality Assurance
system of the Portuguese Population
and Housing Census
Standard table symbols
The following symbols are used in Statistics Canada publications:
. not available for any reference period .. not available for a specific reference period ... not applicable
0 true zero or a value rounded to zero
0s value rounded to 0 (zero) where there is a meaningful
distinction between true zero and the value that was rounded
p preliminary r revised
x suppressed to meet the confidentiality requirements of the Statistics Act
E use with caution
F too unreliable to be published
* significantly different from reference category (p < 0.05) www.statcan.gc.ca.
You can also contact us by
email at infostats@statcan.gc.ca
telephone, from Monday to Friday, 8:30 a.m. to 4:30 p.m., at the following toll-free numbers:
• Statistical Information Service 1-800-263-1136
• National telecommunications device for the hearing impaired 1-800-363-7629
• Fax line 1-877-287-4369
Depository Services Program
• Inquiries line 1-800-635-7943
• Fax line 1-800-565-7757
Published by authority of the Minister responsible for Statistics Canada © Minister of Industry, 2015
All rights reserved. Use of this publication is governed by the Statistics Canada Open Licence Agreement.
An HTML version is also available.
Note of appreciation
Canada owes the success of its statistical system to a long-standing partnership between Statistics Canada, the citizens of Canada, its businesses, governments and other institutions. Accurate and timely statistical information could not be produced without their continued co-operation and goodwill.
Standards of service to the public
Statistics Canada is committed to serving its clients in a prompt, reliable and courteous manner. To this end, Statistics Canada has developed standards of service that its employees observe. To obtain a copy of these service standards, please contact Statistics Canada toll-free at 1-800-263-1136. The service standards are also published on www.statcan.gc.ca under “About us” > “The agency” > “Providing services to Canadians.”
Vol. 41, No. 1, pp. 183-195
Statistics Canada, Catalogue No. 12-001-X
1. Paula Vicente, Elizabeth Reis and Álvaro Rosa, Instituto Universitário de Lisboa (ISCTE-IUL), Business Research Unit (BRU-IUL), Lisbon, Portugal, ISCTE-IUL, Av. Forças Armadas, 1649-026 Lisbon, Portugal. E-mail: paula.vicente@iscte.pt.
The relevance of follow ups in data collection for the Quality
Assurance system of the Portuguese Population and Housing
Census
Paula Vicente, Elizabeth Reis and Álvaro Rosa
1Abstract
The operationalization of the Population and Housing Census in Portugal is managed by a hierarchical structure in which Statistics Portugal is at the top and local government institutions at the bottom. When the Census takes place every ten years, local governments are asked to collaborate with Statistics Portugal in the execution and monitoring of the fieldwork operations at the local level. During the Pilot Test stage of the 2011 Census, local governments were asked for additional collaboration: to answer the Perception of Risk survey, whose aim was to gather information to design a quality assurance instrument that could be used to monitor the Census operations. The response rate of the survey was desired to be 100%, however, by the deadline of data collection nearly a quarter of local governments had not responded to the survey and thus a decision was made to make a follow up mailing. In this paper, we examine whether the same conclusions could have been reached from survey without follow ups as with them and evaluate the influence of follow ups on the conception of the quality assurance instrument. Comparison of responses on a set of perception variables revealed that local governments answering previous or after the follow up did not differ. However the configuration of the quality assurance instrument changed when including follow up responses.
Key Words: Quality assurance; Local government surveys; Follow ups; Map of Alert.
1 Introduction
The latest Portuguese Population and Housing Census took place in March 2011. It was a large and expensive statistical operation involving in-person, door-to-door contacts for the distribution and collection of paper questionnaires across the entire country. The foremost task of any census operation is to do a headcount of every person and identify where they live, without omitting anyone (Waite 2007). However, the successful accomplishment of such task can be compromised by various factors, notably the performance of the human resources involved, the level of citizens’ cooperation and the specific characteristics of the regions and populations that are to be enumerated. Reliable data can only be obtained with sound and accurate processes, which is why the Census is assisted by a comprehensive Quality Assurance (QA) system that is designed and implemented throughout with the census operation itself (Wroth-Smith, Abbott, Compton and Benton 2011).
Prior to 2011, the QA system of Census operations was designed with standardized nationwide procedures i.e., standards, indicators, processes, and sub-processes were defined at national level and this also meant that all regions used the same QA activities for monitoring purposes. Although Portugal is a small country, it is geographically and demographically very diverse with heavily urbanized as well as rural areas; very densely populated areas and also villages that are almost abandoned and deserted; regions with predominately old people and other much younger regions. This diversity is likely to affect the implementation of a census operation as the problems, difficulties and risk of failure are not uniform, but
vary according to the specificities of the population and the areas where the Census is being implemented. In light of this, a new perspective was introduced in the 2011 Census - the QA system was redesigned to tailor it to the local specificities of geographical areas and populations (Statistics Portugal 2007). This change required the Portuguese territory to be mapped in terms of risk of failure and the Map of Alert (Statistics Portugal 2010) was developed for this purpose.
Portugal is organized administratively into 303 municipalities encompassing 4,260 freguesias (local government units) (freguesia is the smallest administrative/governmental area in Portugal. Each Municipality comprises a set of freguesias. Freguesia is the equivalent to civil parish). This organization serves as the base for implementing Census operations: the freguesia is the lowest level of the operation’s coordinating hierarchy; above it comes the municipal coordination, then the regional coordination and, finally, the national coordination is at the top. The Census Office of Statistics Portugal is in charge of the strategic and national coordination of the entire operation. Statistics Portugal appoints regional delegates for regional coordination; the presidents of municipalities are responsible for the municipal coordination, and finally the Presidents of Junta de freguesia (PJF) are in charge of the freguesia coordination. (Junta
de freguesia is the governing body of each freguesia. The Junta de freguesia is administered by the
President of Junta de freguesia).
The Map of Alert is a detailed map of the Portuguese territory at the freguesia level, in which each
freguesia is attributed a colour code to indicate the potential risk of failure in the Census operation: red
(high risk), orange (medium risk) and green (low risk). By risk of failure we mean possible coverage problems, i.e., failing to enumerate some population units or duplicating the enumeration of others. Mapping all the 4,260 freguesias according to their risk of failure would enable municipal coordinators to know in advance which freguesias would require specific QA activities in order to effectively assist the fieldwork operations. This would allow resources to be targeted to freguesias with a known high risk of non-accomplishment. Green or orange freguesias might therefore be treated with the standard QA procedures but specific procedures would be designed and implemented in line with local specificities of red freguesias. These might include assigning more experienced enumerators to the most difficult areas, controlling enumerators’ work more regularly or checking more than the usual 5% of enumerators’ work.
Information about characteristics of the populations, housing and areas that might cause coverage difficulties for the census (e.g., the existence of homeless people, of people belonging to minority groups or of areas with many vacant dwellings (Groves 1989, page 137, Groves and Couper 1998, page 176)) was necessary to build the Map of Alert. This kind of information could have been obtained from the 2001 Census data but, as this was potentially outdated, it was decided to collect the necessary information by means of a mail survey targeting all PJFs. It was crucial to get the cooperation of all 4,260 PJFs to ensure that each freguesia was classified with a risk level in the Map of Alert.
The questionnaire of the Perception of Risk survey was mailed at the beginning of October 2010. The deadline for data collection set internally by the research team was mid-December 2010 but, as respondents tend to postpone answering mail surveys, they were asked to send the completed questionnaires within one month. More than half of the freguesias (58%) returned the completed questionnaires within that time lag; after that period, responses continued to arrive but at a slower pace. By the deadline, 77% of the freguesias had returned the questionnaire but there was already a sharp decline in the number of questionnaires coming in at the end. Despite the good response rate (Dillman,
Statistics Canada, Catalogue No. 12-001-X
Smyth and Christian 2009), the goal of obtaining data from all the freguesias was far from reached. Ending the data collection in mid-December would have meant leaving nearly one fourth of the freguesias with no assigned risk level which would have drastically reduced the efficacy of the Map of Alert as an instrument of quality assurance. A follow up mailing to the non responding freguesias was therefore sent out on 16th December. Besides increasing sample size, it was expected that a qualitative gain would be obtained for the conception of the Map of Alert. In fact, there was some concern that non responders might be freguesias with problematic characteristics for the census, thus causing the true size of the red code to be underrepresented in the Map. The request for personal or sensitive information in questionnaires is known to increase the danger of nonresponse (e.g., Groves, Fowler Jr, Couper, Lepkowski, Singer and Tourangeau 2004, page 224) and although the information requested in the Perception of Risk survey was not personal (i.e., related to the PJF himself), it conveyed matters that the PJFs might be reluctant to share. Questions on the existence of homeless people, areas without public illumination, or roads without tarmac in the areas they govern might be considered overly sensitive thus leading to non participation in the survey. The follow up mailing also aimed to minimize the effect of non response on risk level classification of freguesias.
The Map of Alert was used in the Portuguese Population and Housing Census for the first time in its 2011 edition but Statistics Portugal intends to adopt it as a permanent QA instrument in future census operations. The study reported in this paper examines the impact of follow ups on the response rate and results of the Perception of Risk survey and evaluates to what extent the responses from follow ups changed the configuration of the Map of Alert, namely regarding the risk level classification.
The method used is presented in Section 2. Results are given in Section 3. Finally, a discussion is offered in Section 4.
2 Method
The Perception of Risk survey took place during the Pilot Test stage of the 2011 Portuguese Population and Housing Census (the Pilot Test was the last preparatory stage of the Census 2011 and took almost all of 2010). The aim was to collect information about any specific characteristics of freguesias that might hinder the exhaustive and accurate count of individuals and dwellings. The target population was defined as the freguesias of Portugal (N = 4,260). The Presidents of Juntas de freguesia were chosen to be the respondents because they have close contact with the populations and a deep knowledge of the problems of the areas they govern.
The questionnaire consisted of two blocks of questions (the questionnaire is presented in Figure A.1 of the Appendix). The first block included questions on the respondent’s age, education, time as President of
Junta de freguesia, frequency of computer and internet use, and the identification of the freguesia and
municipality. The second block included questions on freguesias features potentially affecting the implementation of the census. This block had four sections. The first section contained a set of six items asking about characteristics of the freguesia’s population. Respondents rated their answers on each of the items using a five-point scale ranging from “few” to “many”. The second section contained a set of six items asking respondents about characteristics of the buildings and areas of the freguesia. Again each of the items was to be answered using a five-point scale ranging from “few” to “many”. The next section
contained two items about enumerators’ recruitment that were to be answered using a five-point scale ranging from “hard” to “easy”. The questionnaire ends with one item on the overall perception about the implementation of the Census 2011 in the freguesia.
Statistics Portugal has an updated list of postal addresses of all Juntas de freguesia which was used as the sampling frame. The initial mailing was sent to all 4,260 PJFs, therefore making the Perception of Risk survey more of a census than a survey. The mailing included a questionnaire, a postage-paid return envelope and a cover letter. The letter and questionnaire were printed on paper with the logos of Census 2011 and Statistics Portugal responsible for implementing and coordinating the survey. Since responding to the survey was not compulsory, survey salience was emphasized in the invitation letter with the aim of improving the cooperation rate (e.g., Porter 2004, Dillman, et al. 2009): the letter explained that the survey concerned the Census 2011 operation and the PJFs’ answers would be indispensable to the quality of the operation at both the local and national levels. Moreover, the importance of the response was underlined by the fact that the request came from Statistics Portugal.
All freguesias that had not returned the questionnaire by 15th December 2010 were sent the follow up mailing containing a second copy of the questionnaire, a cover letter insisting on response and a postage-paid return envelope. Data collection came to an end in mid-February 2011.
3 Results
For the purpose of the analysis, we shall consider two “groups” of responses: the initial group and the final group. The initial group includes the freguesias that returned the questionnaires before the follow up date; the final group includes all the freguesias responding to the survey, i.e., the initial group plus the
freguesias that returned the questionnaires after the follow up. The two groups are not mutually exclusive.
The analysis starts with a description of the mailing outcomes. We examine response rates (overall and by region) and geographical distribution of the freguesias that could be assigned a risk level (both in the initial and the final versions of the Map of Alert). When making analyses by region, we use the NUTS II classification of the Portuguese territory; this entails six regions - North, Center, Lisbon, Alentejo, Algarve and Archipelagos of Madeira and Azores. In the second stage of the analysis, the responses of the PJFs are analysed by means of Principal Component Analysis with the purpose of reducing the dimensionality of the data and identify latent dimensions of risk. This analysis is performed in both groups of response. Finally an evaluation of the freguesias’ risk level classification is made in both the initial and final Map of Alert. Freguesias that did not respond at all to the Perception of Risk survey (referred as non responders) are described according to their geographical distribution.
3.1 Analysis of response rates
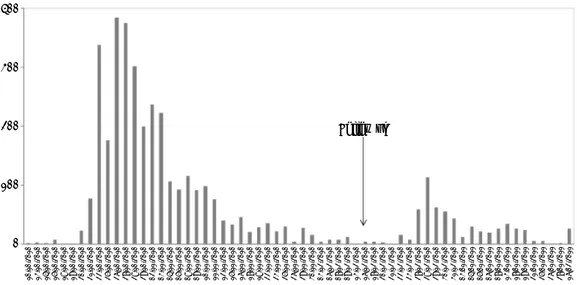
Figure 3.1 presents the distribution of the number of questionnaires received per day during the overall collection period (from 10th October 2010 when the first questionnaires were received until the final deadline on 16th February 2011). There are two peaks of response, the first approximately one month after the first mailing went out and the second some days after the follow up mailing. Almost no questionnaires were being received by the time the follow up mailing was sent out, which leads us to believe that no more would have been received without the second mailing.
Statistics Canada, Catalogue No. 12-001-X
Figure 3.1 Number of questionnaires received per day
From a total of 4,260 questionnaires sent in the first mailing, 2,457 were answered within the suggested time of response (one month), 816 were answered after that period but before the follow up mailing and 609 were answered after the follow up date. Of the 4,260 freguesias, 378 did not respond. This absence of response was considered to be a refusal since it is unlikely these questionnaires were not delivered as an updated address list was used for mailing. The overall response rate of the survey, computed as the percentage of freguesias that answered the questionnaire out of the total number of
freguesias in the population, was 91.1% (Table 3.1).
Table 3.1
Outcomes of the mailing of the questionnaires
N %
Freguesias returning the questionnaire within one month 2,457 57.7 Freguesias returning the questionnaire after one month and before the follow up mailing 816 19.2 Freguesias returning the questionnaire after the follow up mailing 609 14.3
Freguesias not returning the questionnaire 378 8.9
Questionnaires sent 4,260 100.0
Overall freguesias returning the questionnaire 3,882 91.1
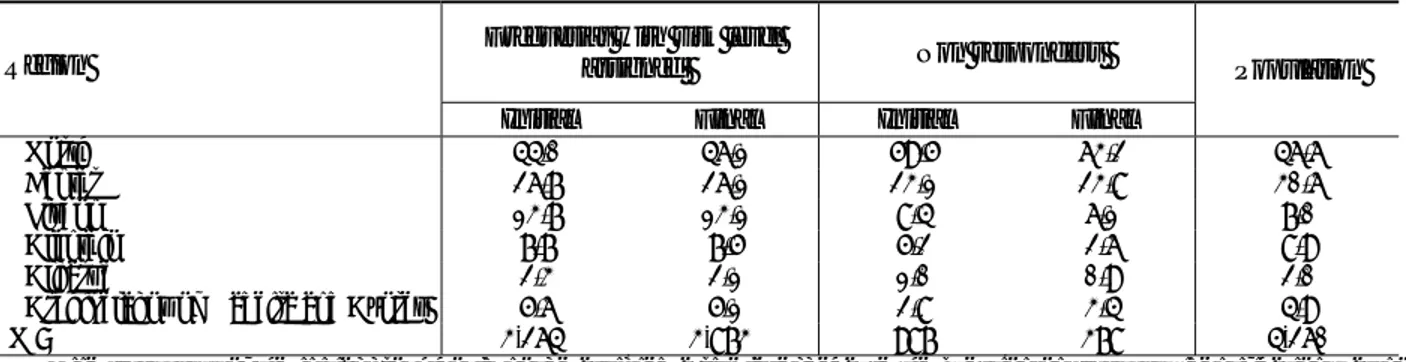
Table 3.2 presents the response rate per region in the initial and final group. The response rate of the initial mailing ranged from 71% in the North to 88.1% in the Algarve; the final response rate ranged from 87.3% in the North to 96.4% in the Algarve. The follow up mailing allowed an increase both in the overall response rate and in the response rate of each region, but it was more efficient in the North than in other regions. The North had a 16.3% increase in survey participation, in contrast to an increase of approximately 6% in the region of the Archipelagos of Madeira and Azores.
10 .10 .2 01 0 13 .10 .2 01 0 14 .10 .2 01 0 15 .10 .2 01 0 18 .10 .2 01 0 19 .10 .2 01 0 20 .10 .2 01 0 21 .10 .2 01 0 22 .10 .2 01 0 25 .10 .2 01 0 26 .10 .2 01 0 27 .10 .2 01 0 28 .10 .2 01 0 29 .10 .2 01 0 02 .11 .2 01 0 03 .11 .2 01 0 04 .11 .2 01 0 05 .11 .2 01 0 08 .11 .2 01 0 09 .11 .2 01 0 10 .11 .2 01 0 11 .11 .2 01 0 12 .11 .2 01 0 15 .11 .2 01 0 16 .11 .2 01 0 17 .11 .2 01 0 18 .11 .2 01 0 22 .11 .2 01 0 23 .11 .2 01 0 25 .11 .2 01 0 26 .11 .2 01 0 29 .11 .2 01 0 30 .11 .2 01 0 03 .12 .2 01 0 06 .12 .2 01 0 07 .12 .2 01 0 09 .12 .2 01 0 13 .12 .2 01 0 16 .12 .2 01 0 17 .12 .2 01 0 20 .12 .2 01 0 21 .12 .2 01 0 22 .12 .2 01 0 23 .12 .2 01 0 27 .12 .2 01 0 28 .12 .2 01 0 29 .12 .2 01 0 30 .12 .2 01 0 31 .12 .2 01 0 03 .01 .2 01 1 04 .01 .2 01 1 05 .01 .2 01 1 06 .01 .2 01 1 07 .01 .2 01 1 13 .01 .2 01 1 17 .01 .2 01 1 19 .01 .2 01 1 21 .01 .2 01 1 25 .01 .2 01 1 26 .01 .2 01 1 27 .01 .2 01 1 16 .02 .2 01 1 400 300 200 100 0 Follow up
Table 3.2
Response rate per region by response group (%)
Region Initial Final
North 71.0 87.3
Center 79.3 91.4
Lisbon 84.3 95.3
Alentejo 83.1 96.0
Algarve 88.1 96.4
Archipelagos of Madeira and Azores 86.7 93.3
Overall 76.8 91.1
Table 3.3 presents the geographical distribution of the freguesias with an assigned risk level in the initial and in the final Map of Alert. More than 40% of the freguesias are located in the North and approximately 26% are located in the Center. When comparing the final distribution with that of all the
freguesias in the population, the biggest differences are found in the regions of Lisbon (13.1% vs. 7.0%,
meaning that the region of Lisbon is overrepresented in the Map of Alert) and Center (26.1% vs. 30.6%, meaning that the region of Center is underrepresented in the Map of Alert). The geographical distribution of the freguesias with an assigned risk level in the final Map is very similar to that of the initial Map.
As to the non responding freguesias, more than half are located in the North and approximately one fourth are located in the Centre. The other regions have less than 10% of the freguesias with no risk level assigned. This pattern is evident in both the initial and final group.
Table 3.3
Geographical distribution of freguesias with risk level assigned and non-responders in the Map of Alert by response group and freguesias in the population (%)
Region
Freguesias with risk level
assigned Non responders Population Initial Final Initial Final
North 44.0 46.1 59.5 63.2 46.6
Center 26.7 26.1 23.1 23.8 30.6
Lisbon 13.7 13.1 8.4 6.1 7.0
Alentejo 7.7 7.5 5.2 2.6 8.9
Algarve 2.3 2.1 1.0 0.9 2.0
Archipelagos of Madeira and Azores 5.6 5.1 2.8 3.4 4.9
N = 3,264 3,873 987 378 4,260
Nine freguesias of the initial group could not be assigned a risk level because the question on freguesia identification was not answered.
3.2 Analysis of the PJF responses
In order to simplify the structure of the survey data and identify the potential dimensions of risk affecting the Census operation, two Principal Component Analysis (PCA) were conducted. One of the PCA was made using the five questions about the characteristics of the PJF (age, educational level, time as president of Junta de freguesia, frequency of computer use and frequency of internet use); the other PCA was made using the Likert-type questions about freguesias’ characteristics and enumerators recruitment (Sections 1 to 3 of the questionnaire). The eigenvalue over one criterion was adopted to extract the
Statistics Canada, Catalogue No. 12-001-X
components. Table 3.4 presents the number of principal components (PC) and the percentage of total variance they explain, based on varimax rotation. Both PCAs were performed in the initial and final group of freguesias.
The outcomes reveal that the responses obtained from initial freguesias have an identical structure in the latent dimensions of risk to the responses of the final group of freguesias. The sampling adequacy indicator for the PCA on PJF characteristics was reasonably good (KMO > 0.6) in both the initial and final
freguesias data sets. In both data sets two principal components were extracted accounting for
approximately 77% of the data variance. The PCs were named as: PCA – PJF’ skills and PCB – PJF’ experience.
Table 3.4
Characteristics of Principal Component Analyses by response group
Analysis characteristic Initial Final
PCA on PJF characteristics
Kaiser-Meyer-Olkin measure of sample adequacy 0.687 0.685
PCs extracted 2 2
Variance explained 77.3% 77.2%
PCA on freguesias’ characteristics
Kaiser-Meyer-Olkin measure of sample adequacy 0.693 0.696
PCs extracted 5 5
Variance explained 61.4% 61.3%
The sampling adequacy indicator for the PCA on Likert-type questions was also reasonably good (KMO > 0.6) in both data sets. Five PCs were extracted, both in the initial and final data sets, accounting for nearly 61% of the data variance, namely: PC1 – Hard to reach population, PC2 – Enumerators with suitable skills and available to work in the census, PC3 – Elderly population, PC4 – Deserted areas and PC5 – Areas with high vacancy rates for habitable housing.
Regarding the overall opinion about the degree of difficulty in implementing the Census 2011 operation (question on Section 4 of the questionnaire), the response of nearly 2/3 of the respondents was above the middle point of the scale in both response groups. In the initial group, 67.8% of the respondents rated their answers as level “4” or “5” on the response scale compared with 67.5% in the final group (Table 3.5).
Table 3.5
Overall opinion about the Census by response group (%)
Initial Final 1 – “hard” 1.7 1.7 2 3.8 3.8 3 26.7 27.0 4 38.4 37.9 5 – ”easy” 29.4 29.6
3.3 Freguesias’ risk level classification
The seven dimensions of risk found with both PCAs were then used as an input in Finite Mixture Modeling and Cluster Analysis to produce a segmentation of the freguesias (details and outputs of this
analysis are not presented but can be found on ISCTE-IUL (2011)). The segmentation is made for both the initial and final groups of freguesias. The outcome of the segmentation is presented in the Map of Alert in which the freguesias appear in red, orange or green (the final Map of Alert is presented in Figure A.2 of the Appendix. The dark spots represent the freguesias without an assigned risk level due to non response). Table 3.6 summarizes the freguesias’ risk level classification in the initial and final versions of the Map.
Table 3.6
Risk level classification in the Map of Alert by response group (%)
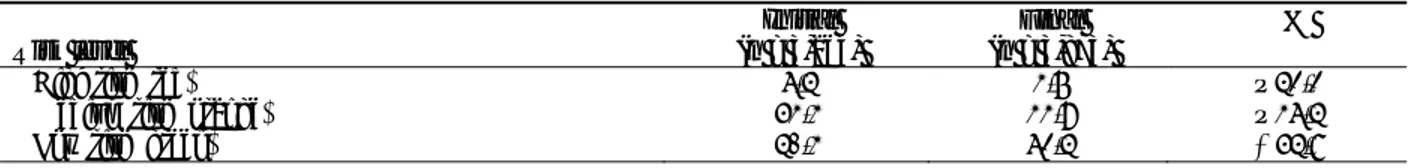
Risk level Initial (n = 3,264) Final (n = 3,873) %
High risk (red) 6.4 3.7 – 42.2
Medium risk (orange) 53.3 33.9 – 36.4
Low risk (green) 40.3 62.4 + 54.8
The dominant colour in the initial Map of Alert is orange (53.3% of the freguesias are rated as medium risk). The share of high risk freguesias is only 6.4%. Green predominates in the final Map (62.4% of the
freguesias are classified as low risk) and less than 4% of the freguesias are red. Adding the follow up
responses to the initial responses resulted in a change in the configuration of the Map of Alert, most notably the increase in the percentage of freguesias rated as low risk (+ 54.8%).
We then analysed how the follow up responses changed the risk level classification of the initial
freguesias. The responses of the 3,264 initial freguesias allowed a colour code to be assigned to each freguesia and to draw the initial version of the Map of Alert. After incorporating the responses of the
follow up freguesias the Map of Alert was redesigned – not only a higher number of freguesias could have a colour code assigned but also the colour initially attributed to the initial freguesias changed in some cases. Of the 3,264 initial freguesias approximately 50% got a different colour in the final Map of Alert. Figure 3.2 presents the overall changes in risk level classification of initial freguesias after integrating the responses of follow up freguesias.
Figure 3.2 Risk level classification in the final Map of Alert by risk level classification in the initial Map of Alert 2.2 1.5 32.7 32.9 37.1 36.6 60.8 65.5 30.7
Red_initial Orange_initial Green_initial Red_final Orange_final Green_final
100%
50%
0%
Statistics Canada, Catalogue No. 12-001-X
The freguesias that were rated green at the outset (green_initial) tend to stay green (green_final) after considering the follow up responses (65.5%). Only 32.9% of the initially green freguesias changed to orange alert (orange_final) and 1.5% changed to red alert (red_final). As to the freguesias that started out as orange (orange_initial), the follow up responses caused 60.8% to change to green (green_final); only 37.1% remained orange (orange_final) and a minority of 2.2% changed to red (red_final). The biggest change caused by follow up responses is in the red group of freguesias: only 32.7% of the initially red
freguesias (red_initial) remained high risk (red_final), and the majority changed either to orange (36.6%)
or green (30.7%).
Finally, we analysed risk level classification per region, and compared the initial and final Map (Table 3.7).
Table 3.7
Risk level classification per region by response group (%)
Region Risk level Initial Final %
North High risk 4.2 0.8 –81.0
Medium risk 52.7 46.1 –12.5
Low risk 43.1 53.1 +23.2
Center High risk 3.7 0.3 –91.9
Medium risk 54.8 18.6 –66.1
Low risk 41.5 81.2 +95.7
Lisbon High risk 19.1 20.3 +6.3
Medium risk 45.3 24.1 –46.8
Low risk 35.6 55.6 +56.2
Alentejo High risk 4.0 1.0 –75.0
Medium risk 65.9 5.0 –92.4
Low risk 30.1 94.0 +212.3
Algarve High risk 17.0 29.8 +75.3
Medium risk 43.4 38.1 –12.2
Low risk 39.6 32.1 –18.9
A. Madeira and Azores High risk 5.2 1.5 –71.2
Medium risk 56.0 60.9 +8.8
Low risk 38.8 37.6 –3.1
Lisbon and Algarve are the regions with higher percentage of freguesias coded as red (19.1% and 17.0%, respectively). This tendency holds both in the initial and final Map of Alert. The follow ups caused a reduction in the percentage of freguesias coded as red in all regions with the exception of Lisbon and Algarve for which the final Map of Alert presents higher percentages of red freguesias than the initial Map. Regarding the percentage of low risk freguesias, the follow ups caused and increased in all regions except Algarve and the Archipelagos of Madeira and Azores in which a decrease was noticed. Additionally, the percentage of orange freguesias decreased in all regions after adding the follow-up responses, except for the Archipelagos of Madeira and Azores.
4 Discussion
It is clear from the results shown above that the follow up mailing was valuable and had a positive impact on both the Perception of Risk survey response rate and the designing of the Map of Alert.
Although it was not possible to meet the 100% response rate target for the Perception of Risk survey, the high response rate – 91.1% - was only achieved thanks to the follow up mailing. The response rate differed across regions but the follow up allowed the response rate to go up in all the regions. North had the lowest response rate for both the initial group – 71% – and after the follow up – 87.3%. Several factors may have accounted for this result. Firstly, is the fact that the PJFs in the North remain in office longer than anywhere else in the country. The average time as PJF is 8.6 years in the North compared with a country average of 7.8 years. Moreover, whereas the 90th percentile of the “time as president” distribution is 20 years in the North, it does not exceed 17 years in the other regions. This means that the PJFs in the North have more governance experience and are probably able to make a better assessment of the impact of their freguesias’ specificities on the census. Perhaps, these PJFs felt their freguesias would not present problems for the Census, so did not bother to answer the questionnaire. Another fact that might have accounted for the lower response rate in the North is that the main opposition party got the most votes in the North in the last parliament election so that the PJFs’ lack of cooperation could have been a form of censure against the central government because they knew the survey had been requested by the country’s official bureau of statistics. Finally, the North is the region with the most freguesias – nearly 2,000 – which makes a 100% response rate more difficult to achieve than in smaller regions like the Algarve, which has less than 90 freguesias.
Follow up responses led to changes in the risk level classification of the freguesias. Contrary to initial expectations, the scenario of color code in the final Map of Alert was not more problematic than the scenario in the initial Map. Not only was the percentage of red alert freguesias smaller in the final Map, but the percentage of green code freguesias also went up. Therefore, in addition to increasing the number of freguesias on the Map with an assigned risk level (from 3,264 freguesias to 3,873 freguesias) the follow up mailing also allowed the classification of some freguesias’ to be “corrected”, namely those initially classified as high risk, most of which were re-coded to orange or green after considering the data set from the follow ups.
These outcomes underline the importance of local governments being more involved and participating actively in future editions of the survey. The contact strategy adopted for the Perception of Risk survey was to send and receive the questionnaire by mail, but different approaches may be considered in the future, namely to include other modes such as the internet. Additionally, contact strategies could be customized to regions specificities. As the North had the lowest response rate, a strategy that included more follow up contacts (using the mail, the telephone or the e-mail) could be adopted there, and a less aggressive contact and re-contact strategy used in other regions. Finally, it must be noted that the administrative map of Portugal was changed in 2013 and the total number of freguesias has now been reduced to approximately 3,000. This new format of organization will surely favor the next Perception of Risk survey since a smaller number of PJFs will simplify the implementation of a contact strategy and the exhaustive inquiry of the freguesias.
Acknowledgements
This article is part of the project Programa de Controlo e Avaliação da Qualidade dos Censos 2011, a joint project of Statistics Portugal and Instituto Universitário de Lisboa (ISCTE-IUL).
Statistics Canada, Catalogue No. 12-001-X
Appendix
Perception of risk survey
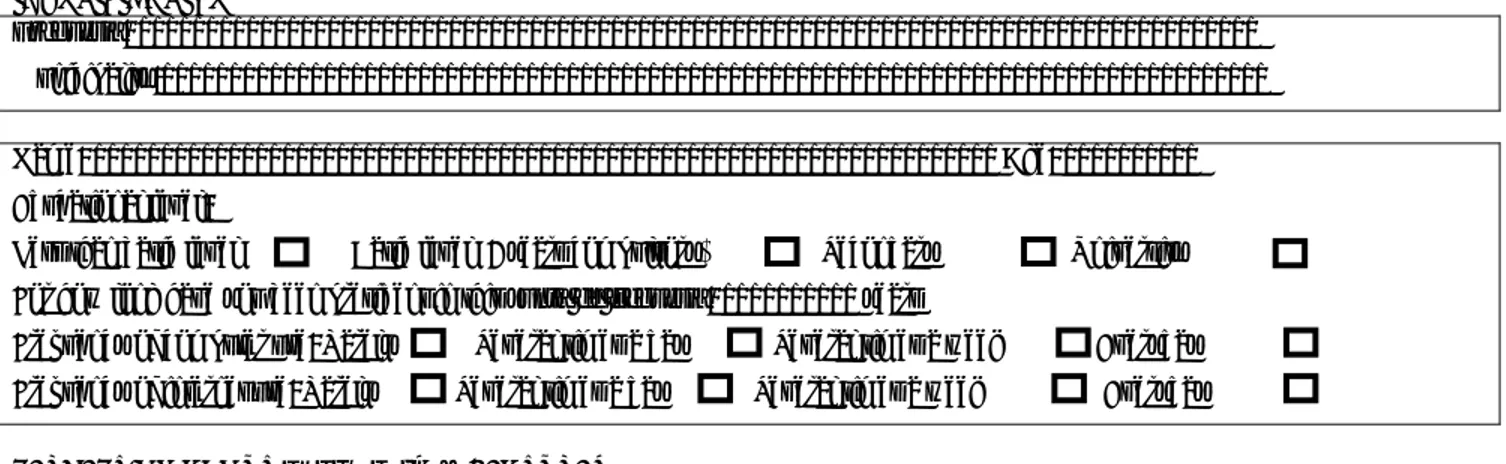
Questionnaire to Presidents of Juntas de freguesia as part of the Pilot Test of the 2011 Census IDENTIFICATION
Freguesia: ___________________________________________________________________________________
Municipality:__________________________________________________________________________________
Name: ___________________________________________________________________ Age: __________ Educational level:
Less than basic level Basic level (9 years compulsory) Secondary University For how long have you been president in this Junta de freguesia: __________ years
Frequency of computer use: Rarely Several times a day Several times a week Everyday Frequency of internet use: Rarely Several times a day Several times a week Everyday
PERCEPTION ABOUT FREGUESIAS’S FEATURES
Rate your responses using a 1 to 5 scale for the following items regarding the Freguesia. Mark the number corresponding to your choice with X.
1 POPULATION
1. Existence of elderly population (age ≥65 years) Few 1 2 3 4 5 Many 2. Existence of illiterate population (cannot read or
write) Few 1 2 3 4 5 Many
3. Existence of population living in social housing
neighbourhoods Few 1 2 3 4 5 Many
4. Existence of emigrant population Few 1 2 3 4 5 Many 5. Existence of immigrant population Few 1 2 3 4 5 Many 6. Existence of homeless population Few 1 2 3 4 5 Many
2 HOUSING AND AREAS
1. Existence of areas with predominantly closed
condominiums Few 1 2 3 4 5 Many
2. Existence of areas with predominantly second or
summer homes Few 1 2 3 4 5 Many
3. Existence of areas with predominantly recently built
residential housing Few 1 2 3 4 5 Many 4. Existence of areas with difficult access (e.g., no
tarmac roads, no lighting, …) Few 1 2 3 4 5 Many 5. Existence of areas with dispersed housing Few 1 2 3 4 5 Many 6. Existence of predominantly dormitory areas Few 1 2 3 4 5 Many
3 HUMAN RESOURCES
1. How difficult will it be to recruit suitably skilled
enumerators Hard 1 2 3 4 5 Easy
2. How difficult will it be to recruit enumerators with
availability Hard 1 2 3 4 5 Easy
4 OVERALL OPINION ABOUT THE CENSUS
How difficult will it be to implement the Census 2011
operation in the freguesia Hard 1 2 3 4 5 Easy
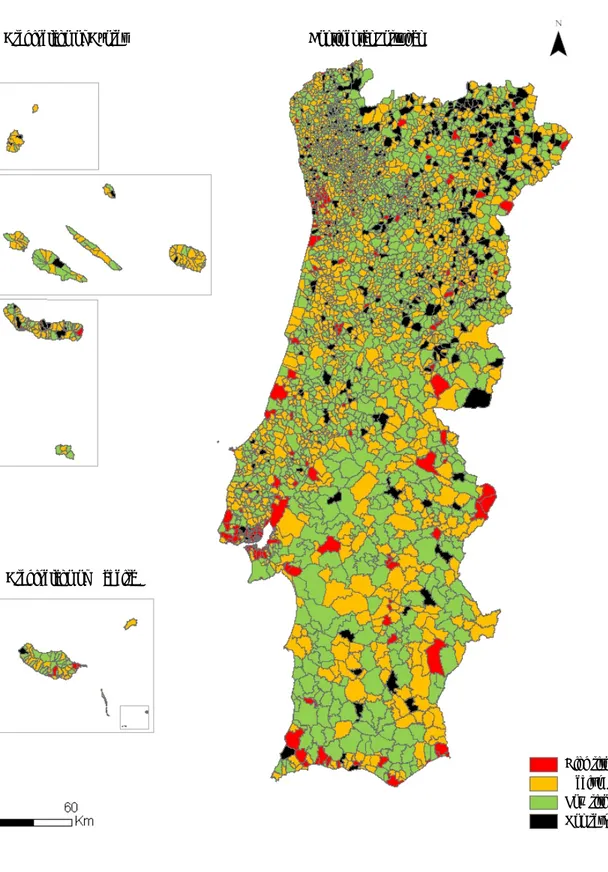
Figure A.2 Final Map of Alert Archipelago of Madeira Low risk Medium risk High risk Non responders
Archipelago of Azores Continental Portugal
Archipelago of Madeira High risk Medium risk Low risk Non responders
Statistics Canada, Catalogue No. 12-001-X
References
Dillman, D., Smyth, J. and Christian, L. (2009). Internet, Mail, and Mixed-Mode Surveys: The Tailored
Design Method, 3rd Edition. New Jersey: Wiley.
Groves, R. (1989). Survey Errors and Survey Costs. New York: Wiley-Interscience.
Groves, R., and Couper, M. (1998). Non-response in Household Interview Surveys. New York: Wiley-Interscience.
Groves, R., Fowler Jr, F., Couper, M., Lepkowski, J., Singer, E. and Tourangeau, R. (2004). Survey
Methodology. New York: Wiley-Interscience.
ISCTE-IUL (2011). Censos 2011-sistema de indicadores de alerta. (Unpublished document).
Porter, S. (2004). Raising response rates: What works? New Directions for Institutional Research, 121, 5-21.
Statistics Portugal (2007). Programa de Acção para os Censos 2011. Census Office, Statistics Portugal. Statistics Portugal (2010). Plano de Controlo e Avaliação da Qualidade Censos 2011 – Controlo do
Processo Produtivo. Census Office, Statistics Portugal.
Waite, P. (2007). State, Local and Tribal Governments Benefit by Early Participation in the 2010 Census. US Census Bureau Press Release.
Wroth-Smith, J., Abbott, O., Compton, G. and Benton, P. (2011). Quality assuring the 2011 Census population estimates. Population Trends, 143, 13-21.