Modelling microbial inactivation kinetics under time-varying temperature conditions
Gil, M.M.(1), Brandão, T.R.S.(2) and Silva, C.L.M.(3)
Escola Superior de Biotecnologia, UCP, R. Dr. António Bernardino de Almeida, 4200 – 072 Porto, Portugal; (1) [email protected]; (2) [email protected]; (3) [email protected].
Abstract
The Gompertz model was applied for describing inactivation, assuming a typical pasteurisation temperature profile at food surface. In order to test the regression analysis procedure parameters were estimated on the basis of pseudo-experimental data. Results were compared to the ones obtained assuming processes at constant temperature. Care should be taken, if parameters estimated under isothermal conditions are going to be used for predicting inactivation under dynamic conditions.
Key words: Predictive microbiology, modelling, Gompertz, inactivation kinetics, time-varying temperature.
Introduction
Food poisoning by pathogens directly affects human health and safety. The surface of foods is the critical boundary for contamination at harvesting (e.g. fresh fruits and vegetables) or during processing (e.g. meat products). Pasteurisation treatments (with temperatures ranging from 50 to 80ºC) are the most common and effective procedures for controlling the survival of microorganisms on food surfaces, and should be designed to provide an adequate safety margin against food-borne pathogens. The development of accurate and precise models, able to predict the behaviour of pathogens or spoiling microorganisms populations under specific environmental conditions, are of main importance for the food industry in the development of reliable surface pasteurisation systems. Existing mathematical models for describing inactivation behaviour are normally applied under isothermal conditions. A few works approach the inactivation considering time-varying temperature conditions. However, it is well known that temperature may vary extensively throughout the complete process. The kinetic parameters, estimated under such conditions, can differ from the ones predicted at constant temperatures. Using the later ones, in situations in which the temperature varies with the time, may affect the predictive ability of the model. This can be particularly important when the safety of a food product is the final goal. Van Impe et al. [1] derived a first-order differential equation to describe the bacterial population as a function of both time and temperature. Geeraerd et al. [2] also reported the need to apply differential equations, with respect to time, to describe the inactivation microorganisms kinetics under time-varying environmental conditions.
This study aims at producing a model that predicts the survival of microorganisms on the surface of a food product, using a typical temperature profile during air surface decontamination treatments. Pseudo-experimental data were generated, in order to test the regression analysis procedure under such conditions.
Model Description
The Gompertz model [3], modified in order to describe inactivation, was applied to the microbial behaviour under time-varying temperature conditions, typical of pasteurisation processes. This non-isothermal version was developed by differentiating the non-isothermal model with respect to time. The following formula was obtained to describe the variation of the total number of microorganisms with time:
L t 1 N N log ) 1 exp( k exp exp 1 t L N N log ) 1 exp( k exp ) 1 exp( k dt ) N (log d f 0 f 0 (1)Herein, N represents the microbial cell density (cfu/g), k denotes the maximum inactivation rate constant (s-1), L the time parameter – shoulder (s) and t the process time. N0 is the initial microbial cell
density (cfu/g) and Nf the residual population density (cfu/g).
The model parameters (k and L) are temperature dependent. An Arrhenius type-equation and a square-root model were used to describe the dependence of the L and k values on temperature [4], respectively: ref T 1 T 1 b exp a L (2) k c
Td
(3)where a and b are constants of the Arrhenius equation, Tref is a fixed reference temperature, and c and
d are constants of the square-root model.
Combining the previous equations and integrating within the initial time and process time, one obtains:
' dt 1 ' t T 1 ) ' t ( T 1 b exp a N N log ) 1 exp( d ) ' t ( T c exp exp 1 ' t T 1 ) ' t ( T 1 b exp a N N log ) 1 exp( d ) ' t ( T c exp ) 1 exp( d ' t T c N log N log t 0 ref f 0 ref f 0 0
(4)Methodology
Microbial pseudo-experimental data generation
Data were computer-generated using the mathematical model (Eq.4). Twenty-eight errors (ei),
randomly chosen from a normally distributed population with mean equal to zero and constant variance (standard deviation of 10%), were then added to the simulated values,
i sim (logN) , as follows:
2
i sim exp logN e 0,0.10 logN i i (5)i=1,2,…, n (number of points)
These data are considered as experimental and will be further referred to as pseudo-experimental. The values of the parameters used in the simulation (log Nf=1,5 cfu/g; a=57,34 s; b=5,559x10
4
K-1; d=326,2 K) were obtained by Gil et al. [4]. This study was based on experimental isothermal inactivation data (in the range 52-68 ºC) of Listeria monocytogenes Scott A [5]. The reference temperature in eq.2 was assumed to be 333K and the initial microbial content considered constant and equal to 1,0x10⁷ (cfu/g).
Non-isothermal temperature history
The temperature histories, used in the dynamic simulation, were measured at the surface of solid foods in a decontamination rig (designed by FRPERC, University of Bristol, in the framework of the European project BUGDEATH QLRT-2001-01415). The heater was controlled so that the surface of the product follows a ramp from 5 to 60ºC in 30s, and then holds the surface at 60ºC until 600s.
Regression analysis procedure
Estimates of the kinetic parameters were obtained by non-linear regression analysis, fitting equation 4 to the non-isothermal pseudo-experimental data. The simplex algorithm [6] was used to minimise the sum of the squares of the residuals, with programs specially written in FORTRAN 77 language (Fortran 5.1, Microsoft Corporation®, 1990).
Results
Estimates of the parameters obtained under time-varying temperature conditions can be observed in Table 1.
Table 1: Estimates of the Gompertz model parameters under non-isothermal conditions Parameter Estimates log Nf (cfu/g) a (s) b (K-1) c (s-1K-2) d (K) 6,7x10⁻² 17,48 2,288x105 1,001x10-3 328,4
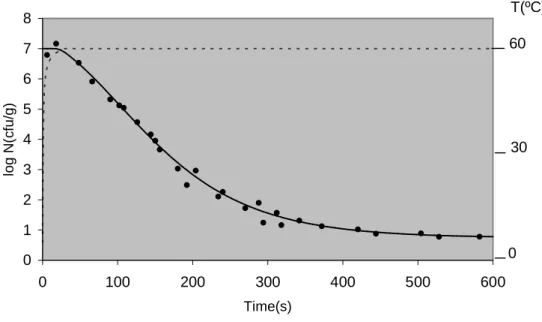
In figure 1, the fit of the Gompertz model to pseudo-experimental inactivation data is represented. The standard deviation of the residuals is 19% and the coefficient of determination is 0.967, reflecting a good model fit.
The variation of the temperature during the process is also included in figure 1. Results showed that no significant inactivation occurs at temperatures lower than 60ºC (corresponding approximately to the initial 30s). Holding time seems to be needed to achieve a safety microbial inactivation for the elected microorganism. 0 1 2 3 4 5 6 7 8 0 100 200 300 400 500 600 Time(s) lo g N (c fu /g )
Figure 1: Variation of the logarithm of the number of microorganisms and temperature of the process with time.
Pseudo-experimental data point
Fit of the Gompertz model (Eq.4) to the pseudo-experimental data ---- Temperature history
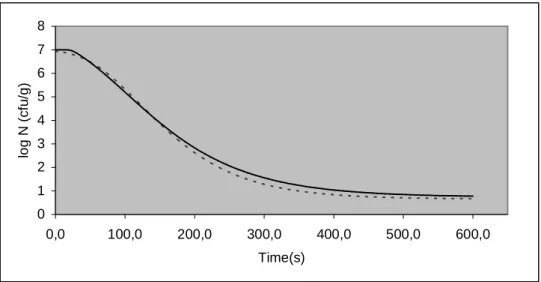
In figure 2 the behaviour of L. monocytogenes, under the temperature history assumed, was compared to the one obtained when constant temperature was assumed for the whole process. The black line is the one simulated under non-isothermal conditions, using model parameters presented in table 1.The dashed line corresponds to the inactivation curve simulated at 60ºC, using the model parameters referred in methodology of data generation [4].
At a first glance it seems that both cases are quite similar. Nevertheless, microorganisms population predicted considering the come-up time (between 5 and 60ºC) are above the isothermal results. In such circumstances, the microbial amount could be under estimated, which may result in an insufficient process time (required to achieve a target inactivation).
This appears not to be relevant for this particular temperature history. However, it could be of extreme 0
30 60
0 1 2 3 4 5 6 7 8 0,0 100,0 200,0 300,0 400,0 500,0 600,0 Time(s) lo g N ( c fu /g )
Figure 2: Predicted inactivation of L. monocytogenes considering an isothermal process at 60ºC (dashed line) and non-isothermal process (black line).
Conclusions
A model was proposed to describe bacterial population as a function of both time and temperature, during surface pasteurisation. The main feature of this model is its ability to deal with time-varying temperature conditions. From a regression analysis point of view, the procedure was successfully tested. Additional experimental data is required to validate the model and will be part of future work.
References
[1] Van Impe, J.F., Nicolai, B.M., Martens, T., Baerdemaeker, J., Vandewalle, J. Dynamic mathematical model to predict microbial growth and inactivation during food processing. Applied and Environmental Microbiology, 58, 9, 2901-2909, 1992.
[2] Geeraerd, A.H., Herremans, C.H., Van Impe, J.F. Structural model requirements to describe microbial inactivation during a mild heat treatment. International Journal of Food Microbiology, 59, 185-209, 2000.
[3] Zwietering, M.H., Jongenburger, I., Rombouts, F.M., Van’t Riet, K. Modeling of the bacterial growth curve. Applied and Environmental Microbiology, 56, 6, 1875-1881, 1990.
[4] Gil, M.M., Brandão, T.R.S. and Silva, C.L.M. Modelling inactivation kinetics of Listeria monocytogenes in a dairy product. Poster presented in: IUFoST – 12th World Food Science and Technology Congress, Chicago, USA, 16-20of July 2003.
[5] Casadei, M.A., Esteves de Matos, R., Harrison, S.T., Gaze, J.E. Heat resistance of Listeria monocytogenes in dairy products as affected by the growth medium. Journal of Applied Microbiology, 84, 234-239, 1998.
[6] Nelder, J.A., Mead, R. A simplex method for function minimization. The Computer Journal, 7, 4, 308-313, 1965.