Proceedings of the
I
nternational
Fire
S
afety
S
ymposium 2015
Coimbra, 20-22 April, 2015
Portugal
Hot Disk
®Organizers:
cib - International Council for Research and Innovation in Building Construction
UC - University of Coimbra
albrasci - Luso-Brazilian Association for Fire Safety
Editors:
João Paulo C. Rodrigues George V. Hadjisophocleous Luís M. Laím
IFireSS – International Fire Safety Symposium
Coimbra, Portugal, 20
th-22
ndApril 2015
79
FIRE REACTION OF CONCRETE WITH AND WITHOUT PP FIBRES:
EXPERIMENTAL ANALYSIS AND NUMERICAL SIMULATION
Paulo Piloto
Professor Poly. Inst. Bragança
Portugal
Luís M.R. Mesquita
Professor Poly. Inst. Bragança
Portugal
Carlos Balsa
Professor Poly. Inst. Bragança
Portugal
ABSTRACT
This work investigates the thermal behaviour of concrete samples under controlled test conditions for heat flux (35 kw/m2 and 75 kw/m2) and the validation of a numerical simulation
model, by comparison of the temperature measurements in different positions. It also aims to assess the reaction to fire of different concrete samples with their natural components and with the addition of polypropylene fibres using two densities (600 and 1200 g/kg), measuring the mass loss (m/m0), mass loss rate (MLR), heat release rate (HRR) and total heat release (THR) using a cone calorimeter operating with EN ISO 13927 specifications [1]. The results demonstrate that the thermal behaviour is independent of the amount of the fibre density, for both incident heat fluxes. The validation of the numerical model was determined using two different solution methods (finite element and finite difference).
Keywords: Fire reaction; Concrete; PP fibres; Thermal performance; heat release rate.
Corresponding author – Department of Applied Mechanics, Polytechnic Institute of Bragança. Campus Santa Apolónia, ap. 1134, 5301-857
Paulo Piloto, Luís M.R. Mesquita and Carlos Balsa
80
1. INTRODUCTION
Structural elements of reinforced concrete, in general, present good performance in case of fire. However, more recent structures have adapted new types of concrete (high strength, self-compacting, etc.) presenting different thermomechanical behaviour, acquiring special importance the study of spalling. One of the most common procedure to minimize this event is the addition of polypropylene fibres (PP) to natural components (AN), reducing the internal void pressure of the material through the channels created by fusion of the fibres.
The experimental study of concrete under fire conditions and the development of numerical models has allowed the assessment of more or less complex phenomena to determine temperature evolution and other state variables, enabling different levels of approaches, using coupled or uncoupled field interaction (thermal, mechanical, hydrodynamic, chemical). This investigation studies the thermal performance of a numerical model, using nonlinear and transient thermal analysis.
The experimental methodology is based on the test of fire reaction using a cone calorimeter and a thermopile on small scale samples using the recommended test method EN ISO 13927 [1] . Apart from the standardized test, thermocouples were used in different positions of the samples to evaluate the thermal performance. This procedure was used for the validation of the numerical model, assessing the effect of polypropylene fibre density and the effect of incident heat flux.
2. MATERIALS AND METHODS
Natural samples of concrete (AN) were prepared with siliceous-based aggregates. The ratio of water cement was 45%, and for 1 m3 of concrete, a mass of sand 1322.7 [kg] was used. The
mass of aggregate was 451.1 [kg], with a water volume of 198 [l] and a cement content of 466.7 [kg]. The aggregates were characterized according NP EN 933-1 [2], wherein the proportion of aggregates with a diameter between 4 and 6 mm was 90%, while the percentage of sand with a diameter between 0.063 and 0.5 mm was 80%. Polypropylene fibres (PP) fibril BIU 12mm were used with two densities: 600 and 1200 g/m3 of concrete. The fibres have an average length of
Paulo Piloto, Luís M.R. Mesquita and Carlos Balsa
81
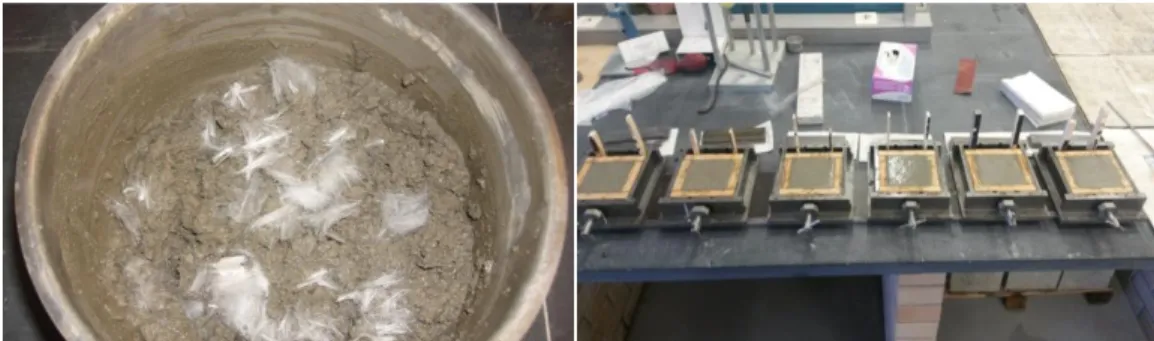
Figure 1: Preparation of concrete samples with PP fibres.
The dimension of each sample was 100x100x40 mm and all samples were conditioned for 28 days in a wet chamber, with 95% humidity at 20 °C. All samples were weighed and drilled for insertion of four K-type thermocouples (T1, T2, T3 and T4). The hot junction of thermocouples were located at the central position, according to Figure 2.
The exposed surface of the samples was maintained at a distance of 25 [mm] from cone calorimeter base. The calibration was performed to the each specified radiant heat flux, using the heat flux meter, resulting in a temperature of the electrical resistance cone of 713 and 923 [°C], for heat the flux of 35 and 75 [kW/m2], respectively. The thermopile was calibrated by
burning methane (purity> 99.5%) with different flow mass.
Paulo Piloto, Luís M.R. Mesquita and Carlos Balsa
82
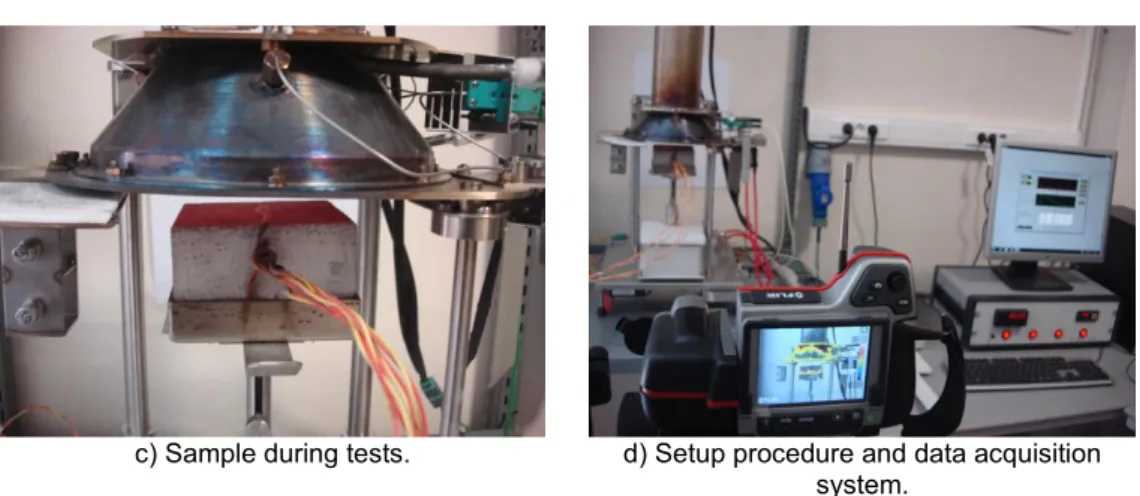
c) Sample during tests. d) Setup procedure and data acquisition system.
Figure 2: Test model and instrumentation.
Table 1 identifies and characterizes all tested samples. Small changes to standard test procedure was made, in order to validate the numerical model.
Table 1: Tested samples.
Samples Materials Heat flux [kW/m2]
01 AN 35 02 AN 35 03 AN 75 BF1_600 AN + PP [600 g/m3] 35 BF2_600 AN + PP [600 g/m3] 75 BF1_1200 AN + PP [1200 g/m3] 35 BF2_1200 AN + PP [1200 g/m3] 75
Experimental tests were performed with multiple data acquisition systems. The cone calorimeter has the ability to measure weight loss, heat release and their time derivatives. The HBM MGCplus system was used to acquire temperature in central points (T1, T2, T3 and T4) and the infrared thermography was used to characterize the temperature field and particularly the evolution of temperature in lateral control points (SP1, SP2, SP3 and SP4). This thermography system (FLIR T365) has a multi scale measuring range (-20 to +120 ° C), (0 to +350 ° C) and (+200 to +1200 °C).
The thermal performance of the samples depends on the thermal balance in the boundaries. Eq. 1 should be solved in the two dimensional domain of the sample
, taking into account the exchange of heat with the surroundings
i
. On the top exposed surface of the samplePaulo Piloto, Luís M.R. Mesquita and Carlos Balsa
83
the top surface of the sample is composed by the heat flux coming from the cone heater, radiation reflected from the surface, convective and radiative heat losses. On the lateral surfaces of the sample
2
the convective and radiative heat losses must be considered byEq. 3 and at the bottom surface of the domain
3
the adiabatic condition may be assumed,Eq. 4. In these equations T represents the main state variable (temperature). The nonlinear thermal properties of concrete are represented by the specific mass of normal concrete (T), by
the specific heat Cp(T) for a moisture content of 3% of concrete weight and by the upper limit of
thermal conductivity (T), all in accordance to EN1992-1-2 [4]. The emissivity of concrete
was considered equal to 0.7. The Stefan-Boltzmann coefficient is denoted by and h
represents the convection coefficient that was approximated by an experimental correlation for a hot horizontal plate in air, with the hot surface uppermost [5]. Ta represents the ambient
temperature.
((T) T) (T) Cp(T) T t (1)
(T)T
nq"0h
TTa
T4Ta4
1
q"0
1
(2)
(T)T
nh
TTa
T4Ta4
2
(3)
(T)T
n0
3
(4)The numerical simulation model was performed with ANSYS and with OCTAVE.
3. EXPERIMENTAL TESTS
Paulo Piloto, Luís M.R. Mesquita and Carlos Balsa
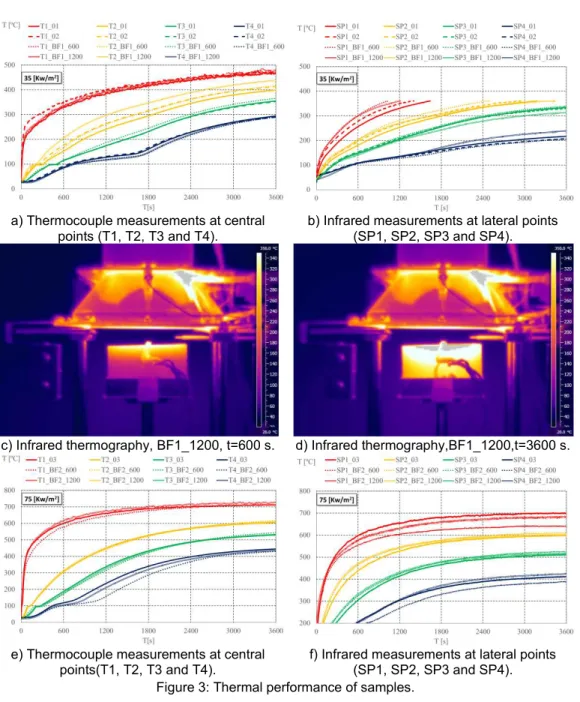
84 a) Thermocouple measurements at central
points (T1, T2, T3 and T4).
b) Infrared measurements at lateral points (SP1, SP2, SP3 and SP4).
c) Infrared thermography, BF1_1200, t=600 s. d) Infrared thermography,BF1_1200,t=3600 s.
e) Thermocouple measurements at central points(T1, T2, T3 and T4).
f) Infrared measurements at lateral points (SP1, SP2, SP3 and SP4). Figure 3: Thermal performance of samples.
Paulo Piloto, Luís M.R. Mesquita and Carlos Balsa
85
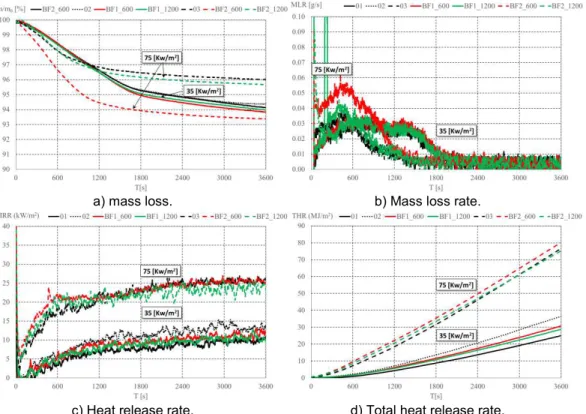
The reaction of the material to the heat flux of 35 and 75 [kW/m2] was determined according to
the mass loss of the sample, mass loss rate, heat release rate and total heat released during each test. The mass loss of samples submitted to 35 [kW/m2] present a bilinear characteristic
behaviour, defined in two periods (the first period with 0.03 [g/s] and the second period with 0.005 [g/s]). Samples submitted to 75 [kW/m2] presented higher mass loss rate at the beginning
of the test, affecting the shape of the mass loss curve, as represented in Figure 4. The heat release rate appears to be independent of the amount of PP fibres existing in the samples, depending only on the incident heat flux, see Figure 4.
a) mass loss. b) Mass loss rate.
c) Heat release rate. d) Total heat release rate. Figure 4: Mass loss and heat release.
4. NUMERICAL SIMULATION
Paulo Piloto, Luís M.R. Mesquita and Carlos Balsa
86
4.1 Finite Element Method (2D)
The first model was defined in ANSYS. This model uses plane elements with 4 nodes (PLANE55) and one (1) degree of freedom per node, linear interpolating functions and four (4) integration points (2x2) to determine the conductivity matrix. Taking into account the limitation of this element for applying simultaneous boundary conditions (heat flux and convection at the exposed surface), an auxiliary model was created. This auxiliary model presents low heat storage capacity and high thermal conductivity ((T)1kg/m3, Cp(T)1J/kgK
mk W
T) 1000 /
(
). The interface between the principal mesh (sample) and the auxiliary mesh was established by contact finite elements (COMBINE 39), using high thermal conductance
k m
W/ 2
100000 . The net heat fluxes q"024.5 and q"0 52.5 [kW/m2] were applied at the
top surface of the auxiliary mesh, while the convection and radiation boundary conditions were applied at the top surface and lateral surface of the main mesh sample. The adiabatic condition was applied at the bottom surface of the model and the initial temperature condition was applied to every node (27 ºC), see Figure 5. The numerical results are similar for both heat fluxes, despite the level of temperature.
a) Temperature field for 3600 (s), 35 KW/m2. b) Temperature field for 3600 (s), 75 KW/m2.
Figure 5 – Temperature field on both samples submitted to 35 and 75 KW/m2
Paulo Piloto, Luís M.R. Mesquita and Carlos Balsa
87
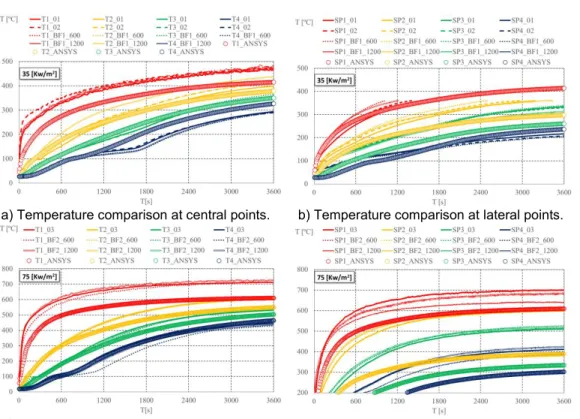
a) Temperature comparison at central points. b) Temperature comparison at lateral points.
c) Temperature comparison at central points. d) Temperature comparison at lateral points. Figure 6 – Comparison between experimental and finite element results (2D).
4.2 Finite Difference Method (1D and 2D)
Paulo Piloto, Luís M.R. Mesquita and Carlos Balsa
88
a) Temperature comparison at central points. b) Temperature comparison at central points Figure 7: Temperature comparison using finite difference method.
5. CONCLUSIONS
A total of seven (7) concrete samples were tested in a cone calorimeter to analyse the thermal effect of polypropylene fibres and the effect of two incident heat fluxes. The results demonstrate that the thermal behaviour is independent of the amount of the fibre density, for both incident heat fluxes. The validation of the numerical model was determined using two different solution methods (finite element and finite difference).
6. REFERENCES
[1] CEN, EN ISO 13927. Plastics – Simple heat release test using a conical radiant heater and a thermopile detector. Brussels: CEN - Comité Européen de Normalisation.” 2003. [2] IPQ (Instituto Português da Qualidade), NP EN 933–1. Tests for Geometrical Properties of
Aggregates — Part 1; Determination of Particle Size Distribution, Sieving Method; 2000 (in Portuguese).
[3] BIU Internacional, Ficha técnica do produto FIBRIL 12F, Alverca do Ribatejo, Portugal. [4] CEN - EN 1992-1-2. Eurocode 2: Design of concrete structures - Part 1-2: General rules -
Structural fire design. Brussels, December 2004.
[5] Staggs, J. E. J.; Whiteley, R. H. Modelling the combustion of solid-phase fuels in cone calorimeter experiments. Fire and Materials, vol. 23, issue 2, 1999, p. 63-69.
[6] Carlos Balsa et al., “Fire reaction of concrete samples with and without polypropylene fibres – Experimental analysis and numerical validation (in Portuguese)”, full paper, 4th