Volume 2013, Article ID 387849,16pages http://dx.doi.org/10.1155/2013/387849
Research Article
Emergent Biomarkers of Residual Cardiovascular
Risk in Patients with Low HDL-c and/or High Triglycerides and
Average LDL-c Concentrations: Focus on HDL Subpopulations,
Oxidized LDL, Adiponectin, and Uric Acid
Filipa Mascarenhas-Melo,
1Filipe Palavra,
2Daniela Marado,
3José Sereno,
1Edite Teixeira-Lemos,
1,4Isabel Freitas,
5,6Maria Isabel-Mendonça,
5Rui Pinto,
7Frederico Teixeira,
1and Flávio Reis
11Laboratory of Pharmacology & Experimental Therapeutics, IBILI, Faculty of Medicine, Sub-Unit 1 (P´olo III),
University of Coimbra, 3000-548 Coimbra, Portugal
2Neurology Department, General Hospital, University and Hospital Centre of Coimbra, Quinta dos Vales,
S˜ao Martinho do Bispo, 3041-801 Coimbra, Portugal
3Internal Medicine Department, General Hospital, University and Hospital Centre of Coimbra, Quinta dos Vales,
S˜ao Martinho do Bispo, 3041-801 Coimbra, Portugal
4ESAV, Polytechnic Institute of Viseu, 3504-510 Viseu, Portugal
5Research Unit, Central Hospital of Funchal, 9004-514 Funchal, Madeira, Portugal
6Laboratory of Human Genetics, Campus Universit´ario da Penteada, 9020-105 Funchal, Madeira, Portugal
7Pharmacology and Pharmacotoxicology Unit, Faculty of Pharmacy, University of Lisbon, 1649-003 Lisbon, Portugal
Correspondence should be addressed to Fl´avio Reis; freis@fmed.uc.pt Received 6 August 2013; Accepted 8 September 2013
Academic Editors: D. Kallend and E. Niesor
Copyright © 2013 Filipa Mascarenhas-Melo et al. This is an open access article distributed under the Creative Commons Attribution License, which permits unrestricted use, distribution, and reproduction in any medium, provided the original work is properly cited.
This study intended to determine the impact of HDL-c and/or TGs levels on patients with average LDL-c concentration, focusing on lipidic, oxidative, inflammatory, and angiogenic profiles. Patients with cardiovascular risk factors (𝑛 = 169) were divided into 4 subgroups, combining normal and low HDL-c with normal and high TGs patients. The following data was analyzed: BP, BMI, waist circumference and serum glucose, Total-c, TGs, LDL-c, oxidized-LDL, total HDL-c and HDL subpopulations, paraoxonase-1 (PONparaoxonase-1) activity, hsCRP, uric acid, TNF-𝛼, adiponectin, VEGF, and iCAMparaoxonase-1. The two populations with increased TGs levels, regardless of the normal or low HDL-c, presented obesity and higher waist circumference, Total-c, LDL-c, Ox-LDL, and uric acid. Adiponectin concentration was significantly lower and VEGF was higher in the population with cumulative low values of HDL-c and high values of TGs, while HDL quality was reduced in the populations with impaired values of HDL-c and/or TGs, viewed by reduced large and increased small HDL subfractions. In conclusion, in a population with cardiovascular risk factors, low HDL-c and/or high TGs HDL-conHDL-centrations seem to be assoHDL-ciated with a poor HDL-cardiometaboliHDL-c profile, despite average LDL-HDL-c levels. This condition, often called residual risk, is better evidenced by using both traditional and nontraditional CV biomarkers, including large and small HDL subfractions, Ox-LDL, adiponectin, VEGF, and uric acid.
1. Introduction
Dyslipidemia is recognized as one of the major risk factors for the development of cardiovascular disease (CVD), which remains the leading cause of death across Europe [1].
The 3-hydroxy-3-methylglutaryl-coenzyme (HMG-CoA) reductase inhibitors, also known as statins, are the first-line lipid-lowering agents for CVD patients and have transformed the treatment of dyslipidaemia. Effective antidyslipidemic treatment significantly reduces cardiovascular risk: a 10%
reduction in total cholesterol is associated with a 25% reduction in the incidence of coronary artery disease (CAD) at five years, and reducing low density lipoprotein choles-terol (LDL-c) by 40 mg/dL (1 mmol/L) with statin therapy leads to a 20% reduction in risk for coronary events [2, 3]; for every mmol/L reduction in LDL-c, the risk of coronary heart disease (CHD) mortality decreases by 19% and overall mortality decreases by 12% [2, 4]. However, a significant number of patients on statin therapy have per-sistent dyslipidaemia, as demonstrated by the dyslip-idemia international study (DYSIS) which reported data from several European countries, including from Portugal [5–8].
Recently, several authors have been focusing the attention on the concept of residual cardiovascular risk (RCVR) [9,10]. According to Hermans and Fruchart, RCVR could be defined by the “residual risk of incident vascular events or progression of established vascular damage persisting in patients treated with current evidence-based recommended care, including risk from established risk factors, such as dyslipidemia, high blood pressure, hyperglycemia, inflammation and unhealthy lifestyles, and risk related to emerging or newer risk factors” [10]. It is apparent that a greater number of residual cardio-vascular events occur than are prevented with statin therapy; indeed, the RCVR remains elevated even in clinical trials in which LDL-c levels have been aggressively reduced [11–13]. As a result, there has been an increased focus on elevated triglycerides (TGs) and decreased high density lipoprotein cholesterol (HDL-c) levels and their significant contributions to RCVR even when LDL-c levels are well controlled [14,15]. Low levels of HDL-c have been largely recognized as a risk factor for CHD and high levels as a protective factor, accord-ing to epidemiology studies performed in subjects and/or patients not optimally treated with statins [16–18]. Although HDL-c has been traditionally associated to atheroprotection, the concept of “HDL-c quality” as an important parameter in reducing cardiovascular mortality is constantly gaining ground and HDL particle functionality has been recognized as a putative pharmacological target for HDL-based therapies [19–22]. HDL quality refers to the composition and functions of HDL particle subpopulations present in a single individual and may define whether HDL is atheroprotective or even proatherogenic [19,20]. It has been suggested that monitoring the type of HDL particles (carry distinct and specific proteins or lipids and differentiated by their density and size: large, intermediate, and small), rather than their total quantity, is a more reasonable way of determining the CV risk, suggesting that different subpopulations may have a different role in reverse cholesterol transport (RCT) and CVD risk protection [23,24]. However, defining HDL quality remains vague and further studies are needed to clarify the true differences between the particles of HDL and to justify their different functionalities. Nevertheless, variations in HDL subfraction levels and functions have been observed in distinct CVD populations, suggesting that large HDL particles are inversely associated with atherosclerosis development while small HDL subpopulations are positively connected with CVD [20–
27].
On the other hand, some data suggest that hypertriglyc-eridemia, as the result of TG-rich lipoproteins overproduc-tion and/or decreased catabolism, is a major factor associated with lack of goals attainment [28]. Elevated TGs levels are considered an independent risk factor for CVD even when controlling for the other factors [29–31], and treatment of elevated TGs in clinical trials has been shown to reduce CVD events, cardiac deaths, and total mortality [31–33]. Patients with elevated TGs are at particularly high risk of CVD, particularly when coexisting with low HDL-c levels [34,35]. Due to the importance that the levels of HDL-c and TGs have been gaining, the ratio TGs/HDL-c may become a new relevant marker for the determination of cardiovascular risk. In adults, the simple TGs/HDL-c index was shown to identify patients with dyslipidemia and insulin resistance [36,37]; in overweight adults, Barter et al. [38] recently showed that only those subjects with an increase in TGs and a decrease in HDL-c presented hypertension, elevated levels of CRP, and insulin resistance. Furthermore, these studies reinforce the idea that classic risk factors explain only about 50–60% of CVD [39]; thus, there has been an increasing interest in identifying novel biomarkers that might improve the global risk prediction of CVD [40,41].
This study aimed to evaluate the influence of low HDL-c and/or elevate TGs levels on the HDL-cardiometaboliHDL-c profile of patients with cardiovascular risk factors but average LDL-c LDL-contents, using both traditional and new nontraditional (emergent) markers, including HDL subpopulations, oxi-dized LDL (Ox-LDL), and inflammatory and angiogenesis mediators.
2. Materials and Methods
2.1. Subjects and Ethical Consideration. One hundred and
sixty nine patients with cardiovascular risk factors were enrolled in the study, divided in two major groups based on the HDL-c levels: a group of patients with normal HDL-c levels (including 119 subjects, 71 males, and 48 females) and another one with low HDL-c concentrations (of 50 patients, 17 males and 33 females), using the cutoffs of 1.03 mmol/L for men and 1.29 mmol/L for women. In addition, each group was subdivided into two subgroups on the basis of their TGs levels: a subgroup of patients with normal TGs levels and another one with high TGs contents, using the cutoff of< and ≥ of 1.69 mmol/L. Thus, four subgroups were analyzed: (A) normal HDL-c and normal TGs (𝑛 = 83), (B) normal HDL-c and high TGs (𝑛 = 36), (C) low HDL-c and normal TGs (𝑛 = 17), and (D) low HDL-c and high TGs (𝑛 = 33). The cutoffs for HDL-c and TGs levels were chosen according to the NCEP-ATP III guidelines. All groups were defined as having cardiovascular risk factors in terms of previous diagnosis and/or pharmacological treatment for hypertension and/or for type 2 diabetes mellitus (T2DM) and/or for dyslipidemia. T2DM was diagnosed in the Diabetes and Metabolic Diseases Unit from the Coimbra Hospital Centre (EPE), according to the European Guidelines. Patients presenting previous diag-nosis and/or treatment for hypertension and dyslipidemia were recruited during the performance of routine labora-tory analysis where they expressed taking antihypertensive
therapy and/or lipid-lowering drugs after proper clinical and laboratorial diagnosis, which were performed according to the International Society of Hypertension/World Health Organization and the Seventh Joint National Committee on Hypertension and National Cholesterol Education Program-Adult Treatment Panel III (NCEP-ATP III) for hypertension and dyslipidemia, respectively. The patients from the groups of normal HDL-c and low HDL-c levels were under the following medication, respectively: (a) insulin and/or oral antidiabetic drugs (OAD): 57.98% and 68.00%; (b) lipid-lowering drugs: 65.55% (78 out of 119) in the normal HDL-c group, distributed by statins (58 patients), fibrates (15 patients), and a combination of both (5 patients) and 60.00% (30 out of 50) in the low HDL-c group, distributed by statins (21 patients), fibrates (6 patients), a combination of both (1 patient), ezetemibe (1 patient), and omega-3 (1 patient); (c) antihypertensive drugs: 68.07% and 76.00%. Pregnant women were excluded. The study was performed in agreement with the code of ethics of the World Medical Association (Declaration of Helsinki) for human studies and received authorization from the local ethics committee, as well as from all the participants by signing a written informed consent.
2.2. Data and Blood Collection. The following data was
obtained from each subject by trained personnel: weight and height (without shoes and wearing light outdoor clothing) were measured in order to calculate body mass index (BMI), waist circumference (WC), and systolic and diastolic blood pressure (SBP and DBP), the latter of which were assessed in the sitting position after a 5 min rest. Blood samples were collected by venipuncture from the subjects after an overnight fasting period, via both EDTA-containing tubes and tubes without anticoagulant, in order to obtain plasma, buffy-coat, and serum and processed within 2 hours of collection. Aliquots were immediately stored at−80∘C until assayed.
2.3. Assays
2.3.1. Lipid and Glycemic Profiles. Serum total cholesterol
(Total-c), HDL-c, LDL-c, and TGs were analysed on a Hitachi 717 analyser (Roche Diagnostics) using standard laboratorial methods. Total-c reagents and TGs kit were obtained from bioM´erieux sa (Lyon, France). HDL-c Plus and LDL-c Plus tests were obtained from F. Hoffmann-La Roche Ltd (Roche Diagnostics Div., Basel, Switzerland). Plasma concentrations of Ox-LDL were evaluated by using a standard commer-cial enzyme-linked immunoassay (Oxidized LDL ELISA, Mercodia, Uppsala, Sweden). Serum glucose levels were measured using a Glucose Oxidase commercial kit (Sigma, St. Louis, MO, USA). HbA1c levels were analyzed on a Hitachi 717 analyser (Roche Diagnostics) using standard laboratory methods.
2.3.2. HDL Subpopulations Assay. Subpopulations were
sepa-rated and quantified using a Lipoprint kit from Quantimetrix Corp. (Redondo Beach, CA, USA). The assay involves a polyacrylamide gel electrophoresis assay and a complete
Lipoprint System for data acquisition and quantification of large, intermediate, and small subpopulations of HDL.
2.3.3. PON1 Paraoxonase Activity. It was assessed
spectro-photometrically and expressed in nmol of p-nitrophenol/ mL/min. In brief, paraoxonase activity was measured by adding serum to 1 mL Tris/HCl buffer (100 mmol/L, pH 8.0) containing 2 mmol/L CaCl2and 5.5 mmol/L paraoxon (O,O-diethyl-O-p-nitrophenylphosphate; Sigma Chemical Co). The rate of generation of p-nitrophenol was determined at 412 nm, 37∘C, via the use of a continuously recording spectro-photometer (Beckman DU-68).
2.4. Serum Inflammatory, Angiogenic, and Endothelial Mark-ers. Serum adiponectin, tumor necrosis factor alpha
(TNF-𝛼), and vascular endothelial growth factor (VEGF) contents were assessed using Quantikine enzyme-linked immunoas-says kits from R&D Systems (Minneapolis, USA); serum intercellular adhesion molecule 1 (iCAM1) levels were eval-uated by using an Elisa kit from Abcam (Cambridge, MA, USA); high-sensitivity C-reactive protein (hsCRP) was eval-uated by immunoturbidimetry, using commercially available kits (CRP [latex] High-Sensitivity, Roche Diagnostics); uric acid was analyzed on a Hitachi 717 analyser (Roche Diagnos-tics) using standard laboratory methods.
2.5. Statistical Analysis. Statistical analysis was performed by
using the IBM Statistical Package for Social Sciences (SPSS) for Windows, version 20.0, (SPSS, Inc., Chicago, IL, USA). The distribution of continuous variables was analyzed using Kolmogorov-Smirnov tests, to assess significant departures from normality. Comparisons between groups were per-formed using the Independent Samples t-test and the Mann-Whitney test. The association between categorical variables was analyzed using Pearson’s test. Statistical significance was accepted at𝑃 less than 0.05.
3. Results
3.1. Anthropometric Data and General Characterization of Populations. One hundred and sixty nine patients were
en-rolled in the study: 119 with normal HDL-c values and 50 with low HDL-c contents. From the normal HDL-c group, the subgroup with normal TGs levels (population A) included 83 subjects and the subgroup with high TGs values (pop-ulation B) included 36 individuals. Concerning the group with low HDL-c contents, 17 subjects were included in the subgroup with normal TGs contents (population C) and 33 individuals in the subgroup with high TGs levels (population D). Throughout the text, three main comparisons will be analyzed as a way to better dissect the differences and the effects of HDL-c and TGs levels variations on the distinct cir-cumstances (as indicated in the tables): comparison 1: effects of TGs levels (normal versus high) on normal and low HDL-c HDL-conditions/populations, by HDL-comparing population A with B and C with D; comparison 2: effects of HDL-c levels (normal versus low) on normal and high TGs conditions/populations, by comparing population A with C and B with D; comparison
3: effects of variations of both HDL-c and TGs levels, by comparing population A with D and B with C.
The demographic and anthropometric data of the 4 populations are summarized in Table1. The normal and low HDL-c groups are matched concerning age, without changes between the 4 populations, while there were higher values of BMI and waist circumference in the subgroups with high TGs contents, independently of the HDL-c levels (populations B and D). The same populations also demonstrated a trend to higher glycemia contents, despite being not statistically significant. Concerning blood pressure, unchanged values were found between the subgroups in all the comparisons (Table1).
3.2. Classical Lipid Profile. The majority of the patients were
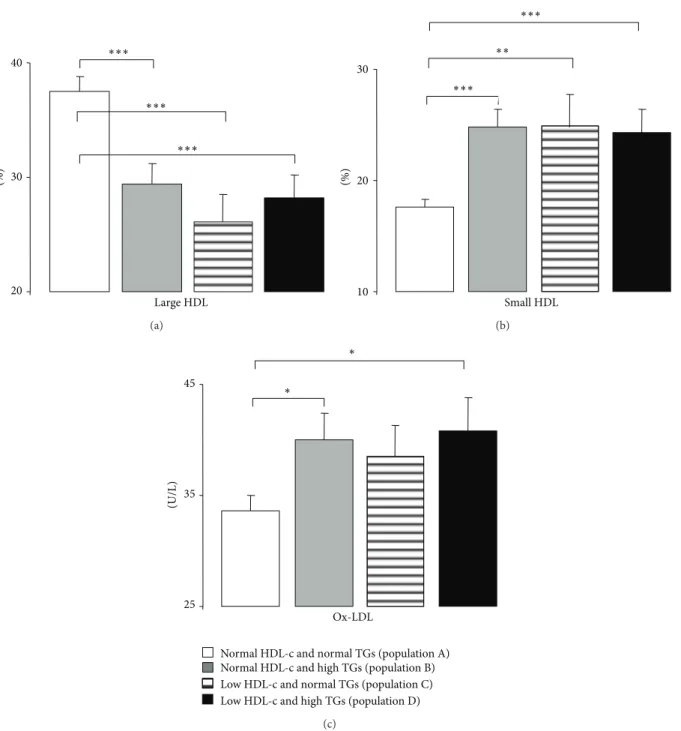
under antidyslipidemic therapy, which can justify some of the data obtained for the classic lipid profile. Concerning the first comparison (effects of TGs levels), the population B (with high TGs contents and normal HDL-c levels) presented, in comparison with the population A (with normal TGs and normal HDL-c levels), significantly higher values of all the lipidic parameters, including Total-c, TGs (as expected, by definition of groups), LDL-c, Ox-LDL, non-HDL-c, Total-c/HDL-c, LDL-Total-c/HDL-c, and TGs/HDL-c (Table2and Fig-ure 1(c)). Under conditions of low HDL-c, the subgroup with high TGs (population D) also presented significantly higher values of Total-c, TGs, non-HDL-c, Total-c/HDL-c, and TGs/HDL-c.
Concerning the second comparison (effects of HDL-c levels), independently of the TGs contents (normal or high) the populations with low-HDL-c presented higher TGs, Total-c/HDL-c, LDL-c/HDL-c, and TGs/HDL-c, without changes on LDL-c, Ox-LDL, and non-HDL-c (Table2 and Figure1(c)).
Finally, the effects of simultaneous variations of TGs and HDL-c (comparison 3) were more pronounced when both parameters are out of average values: comparing the popula-tion A (of normal HDL-c and TGs) with the populapopula-tion D (of low HDL-c and high TGs); in fact, the population D presented significantly higher values of Total-c, TGs, LDL-c, Ox-LDL, non-HDL-c, Total-c/HDL-c, LDL-c/HDL-c, and TGs/HDL-c (Table2and Figure1(c)). When comparing the population B (of normal HDL-c and high TGs) with the population C (of low HDL-c and normal TGs), the lipidic profile was clearly worse when TGs are higher than when HDL-c is low; in fact, population B presented significantly higher values of Total-c, TGs, non-HDL-c, LDL-c/HDL-c, and TGs/HDL-c (Table2).
3.3. HDL Subpopulations and Paraoxonase Activity.
Regard-ing the content of HDL subpopulations, Table2and Figures
1(a)and 1(b) express the effects of HDL-c and TGs levels. The lower values of HDL-c or the higher values of TGs both promoted the poor quality of HDL, viewed by sig-nificantly reduced percentage of large HDL subpopulations and increased percentage of small HDL ones. Paraoxonase activity was unchanged between the 4 populations under study in all the comparisons (Table2).
3.4. Markers of Inflammation, Angiogenesis, and Endothe-lial Lesion. hsCRP, TNF-𝛼, and iCAM-1 contents were
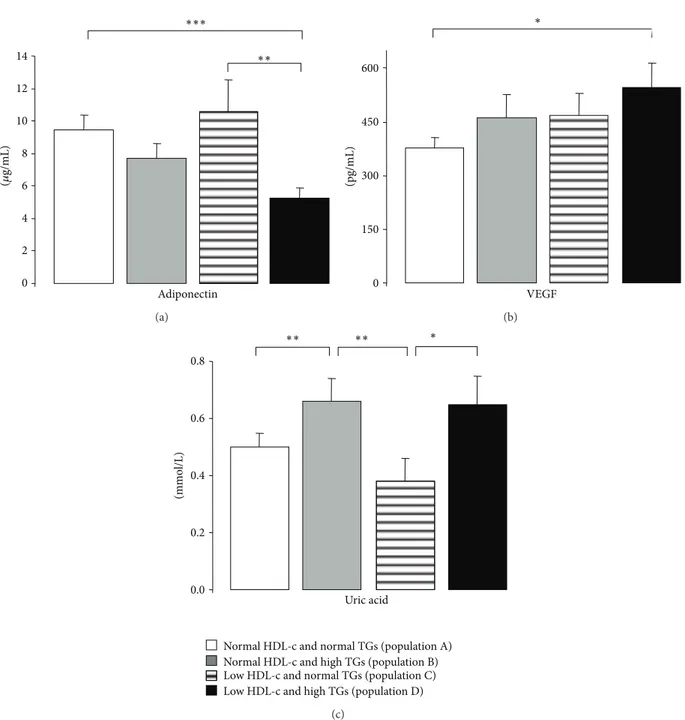
unchanged between populations, despite a trend to reduce iCAM-1 in the population D (of low HDL-c and high TGs levels), which is significantly lower when compared with the population A (of normal HDL-c and normal TGs levels) (Table 3). Adiponectin concentration is significantly lower only in the subgroup with low HDL-c and high TGs (popu-lation D), and the value is statistically significant when com-pared with the population A (of normal HDL-c and normal TGs levels) and with population C (of low HDL-c and normal TGs levels) (Table 3 and Figure 2(a)). Similar profile was encountered for VEGF, with a significantly higher content in the subgroup with simultaneous change of HDL-c and TGs (population D), being statistically significant when compared with the subgroup with normal levels of both HDL-c and TGs (population A) (Table3and Figure2(b)). Finally, uric acid values were higher in the subgroups with high TGs (population B versus A and D versus C), independently of normal or low HDL-c levels (Table3and Figure2(c)).
3.5. Analysis of Correlations between Markers of CV Risk in All Study Subgroups. For some previously described markers,
which presented changes between subgroups, there were significant correlations, particularly in the population A. The most interesting parameters in the correlation analysis were the large and small HDL subpopulations, Ox-LDL, adiponectin, uric acid, and waist circumference.
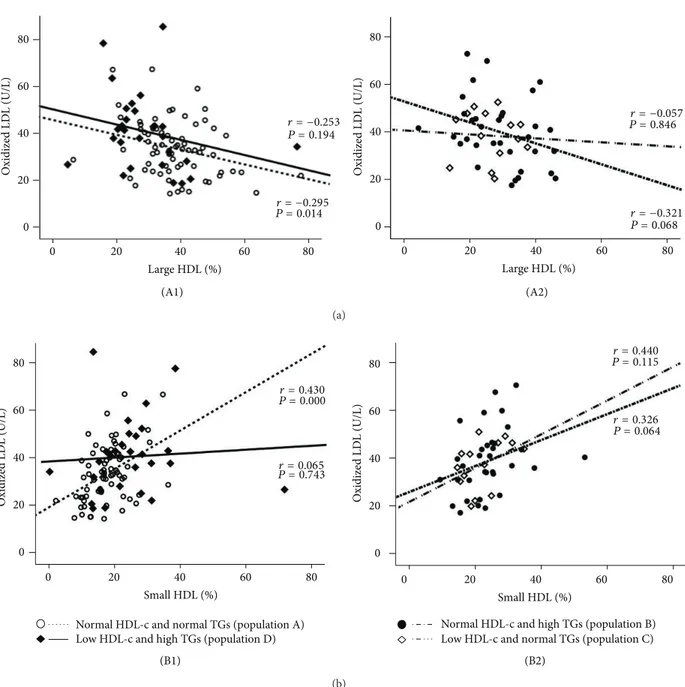
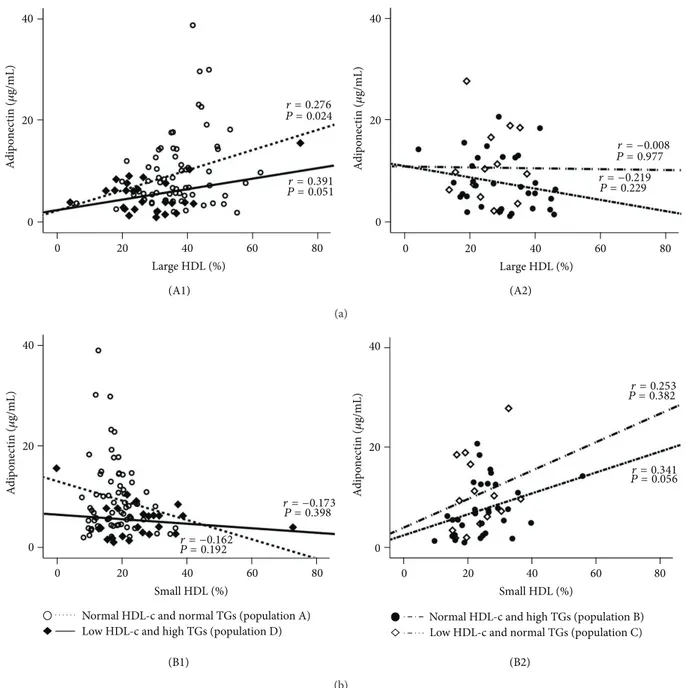
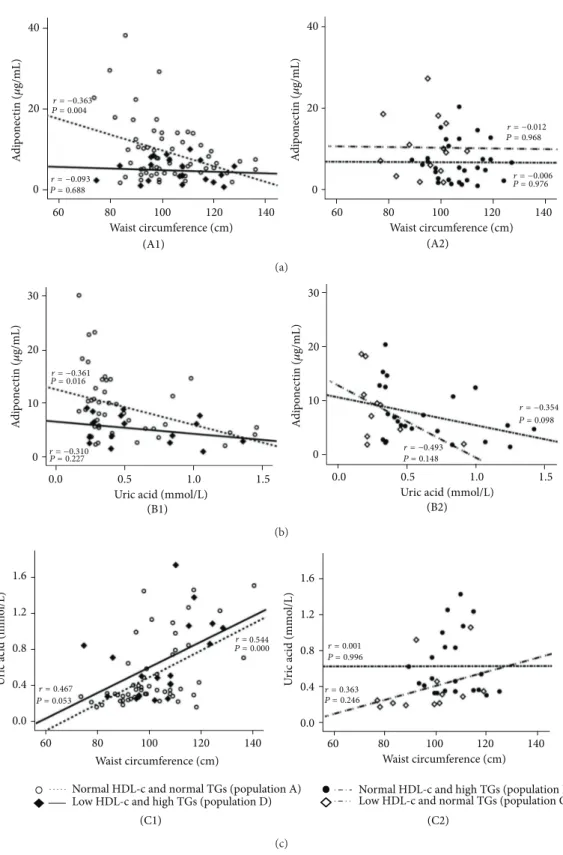
The values of Ox-LDL in the normal HDL-c and normal TGs subgroup (population A) were negatively and signifi-cantly correlated with large HDL (𝑟 = −0.295, 𝑃 = 0.014) and positively and significantly correlated with small HDL (𝑟 = 0.430, 𝑃 = 0.000); these correlations were not found in the 3 other populations (Figure3). Concerning adiponectin, in the population A there was a significant positive correlation with large HDL (𝑟 = 0.276, 𝑃 = 0.024) and a trend to a negative correlation with small HDL (𝑟 = −0.162, 𝑃 = 0.192); these correlations were not found in the other 3 populations (Figure4). Furthermore, also in the population A, adiponectin was negatively and significantly correlated with waist circumference (𝑟 = −0.363, 𝑃 = 0.004) and uric acid (𝑟 = −0.361, 𝑃 = 0.016), which also correlates positively and significantly waist circumference (𝑟 = 0.544, 𝑃 = 0.000); once again, these correlations were absent (not statistically significant) in the other 3 populations (Figure5).
4. Discussion
It is now widely recognized that the current lipid-lowering therapies, in particular those directed to reduce LDL-c levels, such as statins, are insufficient to prevent part of the cardio-vascular events; indeed, residual cardiocardio-vascular risk (RCVR) remains elevated even in clinical trials in which LDL-c levels have been aggressively reduced [11–13,42–44]. As a result, there has been an increased focus on elevated TGs levels and low HDL-c levels and their significant contributions to RCVR even when LDL-c levels are well controlled [14,15]. For example, Genest et al. reported that although 34% of patients
T a ble 1: A n thr o p o m et ri c d at a and genera lc ha rac ter iza tio n o f the p o p u la ti o n s u nder st udy . Pa ra m et er s (1 ) E ff ec ts of TG s le ve ls (n o rm al ve rs u s h ig h ) on n o rm al an d low H D L-c con d it ions /p opu la ti ons (2) E ff ec ts o f H D L -c le ve ls (no rmal ver sus hig h) o n no rm al an d hig h T Gs co ndi tio n s (3) E ff ec ts o f va ria tio n s o f bo th H D L -c an d T G s lev el s No rm al H D L -c (𝑛 = 119 )L o w H D L -c (𝑛=5 0) No rm al T G s (𝑛=8 3) P opu la ti on A Hi gh T G s (𝑛=3 6) P opu la ti on B 𝑃 Av er su sB No rm al T G s (𝑛=1 7) P opu la ti on C Hi gh T G s (𝑛=3 3) P opu la ti on D 𝑃 Cv er su sD (N o rmal T Gs) 𝑃 (A ve rs us C) (H ig h T Gs) 𝑃 (B ve rs us D) 𝑃 Av er su sD 𝑃 Bv er su sC Ag e (y ear s) 60.12 ± 1.06 58.69 ± 1.78 0.4 91 61.88 ± 2.76 60.42 ± 1.36 0.6 4 0 0.5 08 0.4 49 0.87 3 0 .3 24 BMI (Kg/m 2 ) 28.52 ± 0.52 30.73 ± 0.77 0.0 20 28.27 ± 0.85 30.69 ± 0.81 0.0 4 6 0.8 39 0.97 2 0 .0 27 0.0 4 8 WC (c m ) 102.16 ± 1.60 106.61 ± 1.75 0.0 49 97.71 ± 2.78 105.42 ± 2.74 0.0 45 0.22 8 0.7 0 7 0.3 0 6 0.0 0 7 SB P (mmH g) 140.64 ± 2.68 139.18 ± 3.10 0.7 4 8 136.12 ± 5.83 134.33 ± 3.58 0.7 85 0.4 85 0.2 59 0.1 91 0.9 39 D B P (mmH g) 77.85 ± 1.42 78.40 ± 2.19 0.8 30 74.82 ± 3.62 75.67 ± 2.27 0.8 38 0.3 92 0.3 89 0.41 4 0.5 35 Gl ycemia (mmo l/L) 7.88 ± 0.41 8.92 ± 0.64 0.0 9 6 7.62 ± 0.80 9.94 ± 0.76 0.0 6 4 0.7 59 0.4 0 4 0.015 0.08 4 HbA1c (%) 7.90 ± 0.24 8.61 ± 0.47 0.1 43 8.42 ± 0.75 9.75 ± 0.44 0.126 0.4 31 0.08 2 0.0 0 0 0.8 33 R es u lt s are pre se n te d as m ed ia ± SEM. In dep enden t sa m p les 𝑡-t est and M ann-W h it ne y test fo r no rm al ized an d n o n no rm al ized sa m p les, re sp ec ti ve ly . B MI: b o d y mass index; HbA1c: gl yc at ed hemog lob in; SBP: syst o lic b lo o d p ressur e; D BP: d iast o lic b lo o d p ressur e; W C: wa ist cir cumf er ence .
T a b le 2: M ar ke rs of lipi d p rofi le o f th e p opu la ti ons u n d er st u d y. Pa ra m et er s (1 ) E ff ec ts of TG s le ve ls (n o rm al ve rs u s h ig h ) on n o rm al an d low H D L-c con d it ions /p opu la ti ons (2) E ff ec ts o f H D L -c le ve ls (no rmal ver sus hig h) o n no rm al an d hig h T Gs co ndi tio n s (3) E ff ec ts o f va ria tio n s o f bo th H D L -c an d T G s lev el s No rm al H D L -c (𝑛 = 119 )L o w H D L -c (𝑛=5 0) No rm al T G s (𝑛=8 3) P opu la ti on A Hi gh T G s (𝑛=3 6) P opu la ti on B 𝑃 Av er su sB No rm al T G s (𝑛=1 7) P opu la ti on C Hi gh T G s (𝑛=3 3) P opu la ti on D 𝑃 Cv er su sD (N o rmal T Gs) 𝑃 (A ve rs us C) (H ig h T Gs) 𝑃 (B ve rs us D) 𝑃 Av er su sD 𝑃 Bv er su sC T o ta l-c (mmo l/L) 4.60 ± 0.10 5.54 ± 0.20 0 .000 4.48 ± 0.19 5.45 ± 0.20 0.0 0 4 0.5 9 9 0.7 6 8 0.0 0 0 0.0 02 T G s (mmo l/L) 1.06 ± 0.03 2.53 ± 0.13 0 .000 1.23 ± 0.07 3.23 ± 0.19 0 .000 0 .0 49 0 .006 0 .000 0 .000 HD L -c (mmo l/L) 1.50 ± 0.03 1.42 ± 0.04 0.229 1.04 ± 0.04 1.00 ± 0.03 0 .3 85 0 .000 0 .000 0 .000 0 .000 La rg e H D L (% ) 37.54 ± 1.25 29.41 ± 1.83 0 .000 26.10 ± 2.38 28.16 ± 2.06 0.5 41 0.0 0 0 0.6 4 6 0 .0 0 0 0.295 In te rm HD L (%) 44.83 ± 0.72 45.74 ± 0.97 0.47 4 48.95 ± 1.36 47.42 ± 1.34 0.6 67 0.01 7 0.3 11 0.07 1 0 .0 6 4 Sma ll H DL (% ) 17.62 ± 0.72 24.84 ± 1.57 0 .000 24.92 ± 2.99 24.32 ± 2.06 0.9 37 0.0 05 0.9 91 0.0 0 0 0.9 27 LD L -c (mmo l/L) 2.61 ± 0.09 3.02 ± 0.19 0.0 49 2.89 ± 0.18 3.09 ± 0.20 0.5 17 0.1 76 0.8 31 0.0 29 0.9 37 O x-LD L (U/L) 33.65 ± 1.40 40.00 ± 2.43 0.018 38.55 ± 2.77 40.83 ± 3.01 0.8 25 0.1 4 8 0.8 30 0.016 0.7 28 Ox -L DL /L DL-c 12.85 ± 0.39 13.73 ± 0.68 0.229 13.34 ± 1.02 14.33 ± 0.84 0.47 6 0.6 16 0.57 2 0.15 3 0.6 55 N o n-HD L -c (mmo l/L) 3.10 ± 0.09 4.12 ± 0.21 0 .000 3.44 ± 0.18 4.45 ± 0.19 0.0 02 0.111 0.2 4 2 0.0 0 0 0.0 47 To ta l-c/ H D L -c 3.17 ± 0.08 4.03 ± 0.19 0 .000 4.40 ± 0.25 5.56 ± 0.23 0.0 02 0.0 0 0 0.0 0 0 0.0 0 0 0.1 94 L D L-c/ H D L-c 1.82 ± 0.08 2.22 ± 0.16 0.0 37 2.84 ± 0.23 3.15 ± 0.23 0.5 39 0.0 0 0 0.0 01 0.0 0 0 0.0 32 TG s/ H D L-c (mmo l/L) 0.75 ± 0.03 1.85 ± 0.12 0 .000 1.20 ± 0.09 3.38 ± 0.25 0 .000 0 .000 0 .000 0 .000 0 .000 PO N1 ac ti vi ty 487.23 ± 16.04 509.12 ± 37.36 0.5 93 523.43 ± 64.79 503.52 ± 39.36 0.7 78 0.7 76 0.9 18 0.9 02 0 .8 10 R es u lt s are pre se n te d as m ed ia ± SEM. In dep enden ts am p les 𝑡-t est and M ann-W h it ne y test fo r no rm al ized an d n o n no rm al ized sa m p les, re sp ec ti ve ly .H D L -c: h ig h-den si ty li p o p ro tein cho lest er o l; LD L -c: lo w-de ns it y li p o p ro tein cho lest er o l; O x-LD L :o xidized lo w -den si ty li p o p ro tein; T Gs: tr ig ly cer ides; T o ta l-c: to ta lcho lest er o l.
Large HDL (%) 20 30 40 ∗∗∗ ∗∗∗ ∗∗∗ (a) (%) 10 20 30 Small HDL ∗∗∗ ∗∗∗ ∗∗ (b) (U/L) 25 35 45 Ox-LDL
Normal HDL-c and normal TGs (population A) Normal HDL-c and high TGs (population B) Low HDL-c and normal TGs (population C) Low HDL-c and high TGs (population D)
∗
∗
(c)
Figure 1: Serum Large HDL (a), small HDL (b), and Ox-LDL (c), in the study populations. Results are presented as mean± SEM.∗𝑃 <
0.05,∗∗𝑃 < 0.01, and∗∗∗𝑃 < 0.001.
with premature heart disease had LDL-c levels> 160 mg/dL, more than half of the patients with premature heart disease (57%) had low HDL-c levels [34, 45]. Additionally, it has been reported that, in both male and female patients with premature CAD, the greatest risk factor is actually low HDL-c levels, though these individuals often possess high TGs levels as well. Conversely, the study found that TGs levels were significantly higher and HDL-c levels were significantly lower in men and women with premature CAD, compared with patients from the Framingham Offspring Study who were free of CHD at baseline [14,34].
Low levels of HDL-c and elevated levels of TGs have been largely recognized as risk factors for coronary heart and/or artery disease [16–18,29–31], particularly in patients with both conditions [34, 35]. Thus, in statin-medicated patients, with average LDL-c levels, HDL-c and TGs have been gaining particular relevance, as good measures of RCVR and target for prevention of cardiovascular events. Several lines of evidence reinforce the idea that traditional risk factors, including lipidic (such as LDL-c), might not tell the whole story about CVD progression and prevention of CV events, and thus, other lipid fractions/components, such as
T a b le 3: M ar ke rs of in fl am m at o ry an d ang io ge n ic profi le of th e p opu la ti ons u n d er st u d y. Pa ra m et er s (1 ) E ff ec ts of TG s le ve ls (n o rm al ve rs u s h ig h ) on n o rm al an d low H D L-c con d it ions /p opu la ti ons (2) E ff ec ts o f H D L -c le ve ls (no rmal ver sus hig h) o n no rm al an d hig h T Gs co ndi tio n s (3) E ff ec ts o f va ria tio n s o f bo th H D L -c an d T G s lev el s No rm al H D L -c (𝑛 = 119 )L o w H D L -c (𝑛=5 0) No rm al T G s (𝑛=8 3) P opu la ti on A Hi gh T G s (𝑛=3 6) P opu la ti on B 𝑃 Av er su sB No rm al T G s (𝑛=1 7) P opu la ti on C Hi gh T G s (𝑛=3 3) P opu la ti on D 𝑃 Cv er su sD (N o rmal T Gs) 𝑃 (A ve rs us C) (H ig h T Gs) 𝑃 (B ve rs us D) 𝑃 Av er su sD 𝑃 Bv er su sC CRP (𝜇 g/mL) 0.42 ± 0.09 0.35 ± 0.08 0.798 0.59 ± 0.16 0.60 ± 0.12 0.98 1 0.20 6 0.2 37 0.13 1 0.3 27 TNF -𝛼 (pg/mL) 3.21 ± 0.36 2.96 ± 0.39 0.7 27 2.83 ± 0.43 3.50 ± 0.55 0.7 58 0.9 14 0.5 52 0.57 3 0 .8 58 iCAM-1 (ng/mL) 580.98 ± 32.51 553.40 ± 61.34 0.6 6 4 536.10 ± 55.09 426.54 ± 26.89 0.0 6 4 0.5 25 0.215 0.0 01 0.97 5 Ad ip o n ec ti n (𝜇 g/mL) 9.48 ± 0.87 7.67 ± 0.93 0.108 10.55 ± 1.96 5.22 ± 0.66 0.010 0.6 97 0.110 0.0 0 0 0.201 U ric acid (mmo l/L) 0.50 ± 0.05 0.66 ± 0.08 0.0 05 0.38 ± 0.08 0.65 ± 0.10 0.0 23 0.10 4 0.6 16 0.1 4 4 0.0 05 VEGF (pg/mL) 376.48 ± 30.81 461.24 ± 63.74 0.16 1 468.45 ± 61.39 546.34 ± 67.86 0.7 59 0.113 0.3 02 0.01 7 0 .5 6 4 R es u lt s are pre se n te d as m ed ia ± SEM. In dep enden ts am p les 𝑡-t est and M ann-W h it ne y test fo r no rm al ized an d n o n no rm al ized sa m p les, re sp ec ti ve ly .CRP: C -r ea ct iv e p ro tein; iCAM-1: in ter cell ula r ad hesio n mo lecule 1; TNF -𝛼 :t umo u r n ecr o sis fac to r al p ha; V EGF :vas cula r endo th elial gr o wt h fac to r.
0 2 4 6 8 10 12 14 Adiponectin ∗∗∗ ∗∗ (𝜇 g/mL) (a) 0 150 300 450 600 VEGF (pg/mL) ∗ (b) Uric acid (mmo l/L) 0.0 0.2 0.4 0.6 0.8 ∗∗ ∗∗ ∗
Normal HDL-c and normal TGs (population A) Normal HDL-c and high TGs (population B) Low HDL-c and normal TGs (population C) Low HDL-c and high TGs (population D)
(c)
Figure 2: Serum adiponectin (a), VEGF (b), and uric acid (c) levels, in the study populations. Results are presented as mean±SEM.∗𝑃 < 0.05,
∗∗𝑃 < 0.01, and∗∗∗𝑃 < 0.001.
HDL, TGs, and oxidized LDL (Ox-LDL), might have a major role as biomarkers and/or targets to the reduction of overall cardiovascular health [14,15,46,47]. Actually, there has been an increasing interest in identifying novel biomarkers, includ-ing lipidic, inflammatory, and angiogenic, that might improve the global risk prediction of CVD [40,41]. The present study aimed to evaluate the influence of low HDL-c and/or elevate TGs levels and the relative relevance of each one alone and combined on the cardiometabolic profile of patients with cardiovascular risk factors but average LDL-c contents, using both traditional and new nontraditional (emergent) markers, including HDL subpopulations, Ox-LDL, and inflammatory and angiogenesis mediators.
The main finding of this study is that patients with con-trolled LDL-c levels, as a result of antidyslipidemic therapy, in particular with statins, present a poor cardiometabolic profile as a result of isolate or combined low-HDL-c dyslipi-demia and hypertriglyceridyslipi-demia. This cardiometabolic pro-file, which might be viewed as a residual (but not negligible) cardiovascular risk, is better diagnosed when analyzed in terms of nontraditional markers, including large and small HDL subpopulations, Ox-LDL, adiponectin, VEGF, and uric acid.
Regarding the obesity profile, the results clearly show that patients with elevated TGs levels, regardless of the HDL-c values (normal or low concentrations), present the highest
O xidized LD L (U/L) O xidized LD L (U/L) Large HDL (%) Large HDL (%) 0 20 40 60 80 0 20 40 60 80 0 20 40 60 80 0 20 40 60 80 r = −0.295 P = 0.014 r = −0.253 P = 0.194 r = −0.321 P = 0.068 r = −0.057 P = 0.846 (A1) (A2) (a) O xidize d LD L (U/L) O xidize d LD L (U/L) Small HDL (%) Small HDL (%) 20 40 60 80 0 20 40 60 80 0 0 20 40 60 80 0 20 40 60 80 r = 0.430 P = 0.000 r = 0.065 P = 0.743 r = 0.326 P = 0.064 r = 0.440 P = 0.115
Normal HDL-c and normal TGs (population A) Low HDL-c and high TGs (population D)
Normal HDL-c and high TGs (population B) Low HDL-c and normal TGs (population C)
(B1) (B2)
(b)
Figure 3: Correlations between Ox-LDL and large HDL (a) and small HDL (b) in the study populations. (A1) Population A:𝑟 = −0.295,
𝑃 = 0.014; population D: 𝑟 = −0.253, 𝑃 = 0.194; (A2) population B: 𝑟 = −0.321, 𝑃 = 0.068; population C: 𝑟 = −0.057, 𝑃 = 0.846; (B1)
population A:𝑟 = 0.430, 𝑃 = 0.000; population D: 𝑟 = 0.065, 𝑃 = 0.743; (B2) population B: 𝑟 = 0.326, 𝑃 = 0.064; population C: 𝑟 = 0.440,
𝑃 = 0.115.
BMI (above 30 kg/m2) and waist circumference values. Sev-eral studies have linked obesity to high TGs and low HDL-c levels [48, 49]. In our study, elevated concentration of TGs is more important in determining obesity in patients with cardiovascular risk factors. This is better viewed when comparing patients with average TGs contents and normal HDL-c (population A) versus low HDL-c (population C) levels, showing unchanged values between the groups, despite both populations already presenting overweight (with BMI above 28 kg/m2for both). Similar profile was encountered for Total-c with significantly higher levels in the populations with elevated TGs contents, regardless of HDL-c concentration.
Concerning LDL-c and Ox-LDL, we found that the highest values are encountered in the populations with high TGs concentrations, despite a trend of increased contents in the population with low HDL-c values and normal TGs contents. Thus, once again, elevated concentration of TGs is more important than HDL-c in determining the values of LDL-c and of Ox-LDL, in patients with cardiovascular risk factors and under antidyslipidemic medication.
The association between cardiovascular disease and oxi-dation of LDL has been largely demonstrated and previous studies have reported an interesting relationship between Ox-LDL and markers of lipid profile, in populations with
Large HDL (%) Large HDL (%) 0 20 40 60 80 0 20 40 60 80 0 20 40 0 20 40 A d ip on ec ti n (𝜇 g/mL) A d ip on ec ti n (𝜇 g/mL) (A1) (A2) r = 0.276 P = 0.024 r = 0.391 P = 0.051 r = −0.008 P = 0.977 r = −0.219 P = 0.229 (a) Small HDL (%) Small HDL (%) 0 20 40 60 80 0 20 40 60 80 0 20 40 0 20 40 A d ip on ec ti n (𝜇 g/mL) A d ip on ec ti n (𝜇 g/mL) (B1) (B2)
Normal HDL-c and normal TGs (population A) Normal HDL-c and high TGs (population B)
Low HDL-c and high TGs (population D) Low HDL-c and normal TGs (population C)
r = −0.173 P = 0.398 r = −0.162 P = 0.192 r = 0.253 P = 0.382 r = 0.341 P = 0.056 (b)
Figure 4: Correlations between adiponectin and large HDL (a) and small HDL (b) in the study populations. (A1) Population A:𝑟 = 0.276,
𝑃 = 0.024; population D: 𝑟 = 0.391, 𝑃 = 0.051; (A2) population B: 𝑟 = 0.219, 𝑃 = 0.229; population C: 𝑟 = −0.008, 𝑃 = 0.977; (B1) population
A:𝑟 = −0.162, 𝑃 = 0.192; population D: 𝑟 = −0.173, 𝑃 = 0.398; (B2) population B: 𝑟 = 0.341, 𝑃 = 0.056; population C: 𝑟 = 0.253, 𝑃 = 0.382.
cardiovascular risk as well as in healthy individuals [27,
50]. One of the most relevant associations is related with inverse relationship and opposite roles of oxidized LDL and HDL-c on atherogenesis and CAD [47,51–53]. Concerning the CAD, Ox-LDL is a promoter of key steps in the onset and evolution of atherosclerosis, including stimulation of monocyte infiltration and smooth muscle cell migration and proliferation; conversely, high levels of HDL-c prevent the development of atherosclerosis and CAD, in particular due to the transport of reserve cholesterol and the inhibition of Ox-LDL-induced monocyte infiltration; indeed, Ox-LDL and HDL-c are antagonists in the development of CVD [51].
Our previous studies, both in healthy individuals and in populations with cardiovascular risk, such type 2 diabetes patients, strongly suggested an association between Ox-LDL and HDL subpopulations, which was less evident with total HDL-c content [25, 26]. In fact, Ox-LDL concentrations showed an inverse and significant correlation with the large HDL subfractions, those viewed as more atheroprotective, and a direct and significant correlation with the small HDL subpopulations, which are indicated as the atherogenic ones, or at least less atheroprotective [25,26]. Our present study reinforces these associations, since Ox-LDL levels presented the same significant correlation with the HDL
A d ip on ec ti n (𝜇 g/mL) 40 20 0 A d ip on ec ti n (𝜇 g/mL) 40 20 0 (A1) Waist circumference (cm) 60 80 100 120 140 Waist circumference (cm) (A2) 60 80 100 120 140 r = −0.363 P = 0.004 r = −0.006 P = 0.976 r = −0.012 P = 0.968 r = −0.093 P = 0.688 (a) 0 10 20 30 A d ip on ec ti n (𝜇 g/mL) 0 10 20 30 A d ip on ec ti n (𝜇 g/mL) r = −0.361 P = 0.016 r = −0.310 P = 0.227 r = −0.354 P = 0.098 r = −0.493 P = 0.148 Uric acid (mmol/L)
0.0 0.5 1.0 1.5
(B1)
Uric acid (mmol/L)
0.0 0.5 1.0 1.5
(B2)
(b)
Waist circumference (cm) Waist circumference (cm)
60 80 100 120 140 60 80 100 120 140 0.0 0.4 0.8 1.6 1.2 0.0 0.4 0.8 1.6 1.2 r = 0.001 P = 0.996 r = 0.363 P = 0.246 r = 0.544 P = 0.000 r = 0.467 P = 0.053 U
ric acid (mmo
l/L)
U
ric acid (mmo
l/L)
Normal HDL-c and normal TGs (population A) Low HDL-c and high TGs (population D)
Normal HDL-c and high TGs (population B) Low HDL-c and normal TGs (population C)
(C1) (C2)
(c)
Figure 5: Correlations between adiponectin and waist circumference (a), adiponectin and uric acid (b), and uric acid and waist circumference
(c) in the study populations. (A1) Population A:𝑟 = −0.363, 𝑃 = 0.004; population D: 𝑟 = −0.093, 𝑃 = 0.688; (A2) population B: 𝑟 = −0.006,
𝑃 = 0.976; population C: 𝑟 = −0.012, p = 0.968; (B1) population A: 𝑟 = −0.361, 𝑃 = 0.016; population D: 𝑟 = −0.310, 𝑃 = 0.227; (B2)
population B:𝑟 = −0.354, 𝑃 = 0.098; population C: 𝑟 = −0.493, 𝑃 = 0.148; (C1) population A: 𝑟 = 0.544, p = 0.000; population D: 𝑟 = 0.467,
subfractions: inverse with the large subpopulations and direct with the small HDL ones, in particular in the subgroup of patients with normal HDL-c and normal TGs values. Despite the recognition of an association between low levels of HDL-c with increased risk for CAD [52,53], it has been suggested during the last years that a better indicator of HDL functionality may be their quality, which depends on its subpopulation’s type (large versus small) and constituents, including PON1 activity [54–56]. In our study, HDL quality is reduced in the two populations with high TGs contents as well as in the population with normal TGs but low HDL-c concentration. Thus, both the low HDL-c dyslipidemia and the hypertriglyceridemia are, per se, even not cumulatively, promoters of poor HDL quality, viewed by the simultane-ous reduced content of the large HDL subpopulations and increased of small ones. This profile was similar to that found for Ox-LDL concentration, which showed interesting correlations with the subpopulations, as previously reported. The implication of TGs levels in HDL quality has been gaining importance, as reported by other authors [57, 58]. These studies suggested that particle size of HDL subclasses tend to be small with increasing TGs concentration, indicating that HDL maturation might be hampered and efficiency of reverse cholesterol transport (RCT) might be weakened. These data suggest that TGs levels were not only signifi-cantly associated with, but liner with, the contents of HDL subfractions. Concerning the influence of HDL-c levels on HDL subpopulations, some studies have demonstrated that subjects with low HDL-c display marked changes in their HDL composition and subclass distribution; some of them indicate that the percentage of larger subfractions as well as HDL mean particle size is reduced in subjects with low HDL-c levels [59,60], which is in agreement with our results. PON1 activity, which have been indicated as an indicator of HDL functionality, was unchanged between groups, which is in agreement with previous data from us in other populations of cardiovascular risk [25–27], suggesting that HDL subpop-ulations, rather than PON1 activity, are best markers of HDL quality. Whether HDL function and/or composition, rather than total HDL-c content, are better biomarkers of residual CV risk is an exciting (yet open) issue that deserves additional efforts from the scientific clinical community.
Inflammation and oxidative stress are key pathways for endothelial dysfunction and development of atherosclerosis, being oxidized LDL one of the major players in this process, together with several mediators of inflammation [46, 47, 61]. HDL exerts direct endothelial-protective effects, such as stimulation of endothelial production of the antiatherogenic molecule nitric oxide, as well as anti-oxidant, anti-inflammatory and antithrombotic effects [62–64]. An inflammatory imbalance, as manifested by increased proinflammatory cytokines, such as the tumor necrosis factor alpha (TNF-𝛼), increased C-reactive protein (CRP), and/or reduced levels of anti-inflammatory and antiatherogenic mediators, such as adiponectin, has been considered a key factor for the increased cardiovascular risk in some pathologies [65, 66]. Similar importance is now attributed to the phenomenon of angiogenesis, which has the vascular endothelial growth
factor (VEGF) as the key biomarker, a peptide growth factor secreted by vascular endothelial cells that stimulates vasculogenesis and angiogenesis, which has been involved in the pathogenesis of cardiovascular diseases, such as atherosclerosis [67], as well as to the intracellular adhesion molecules, such as ICAM-1, which has been associated with the severity of atherosclerosis and cardiovascular events [68]. Another new marker that deserves our attention is the uric acid; although uric acid can act as an antioxidant, excess serum accumulation is often associated with several conditions and has been suggested as an independent risk factor for carotid atherosclerosis in patients with CVD, such as in type 2 diabetes [69]. In our study, although unchanged values of high sensitivity CRP, TNF-𝛼 and iCAM-1 were found between the four populations under evaluation, a reduced concentration of adiponectin and an increased content of VEGF in the patients’s population with low HDL-c and high TGs levels were encountered, suggesting that both conditions contribute to these alterations. Previous studies have indicated an association of lower adiponectin levels in populations with increased values of TGs and reduced values of HDL-c, as well as in healthy individuals [70,71]. In our study, adiponectin levels showed important correlation with HDL subpopulations, inversely with small HDL subfractions and direct with large ones, but not with total HDL-c content; in addition, adiponectin levels also presented inverse correlation with waist circumference. Once again, those correlations were more evident and strong in the population with normal HDL-c and normal TGs contents, as occurred also for the correlations between Ox-LDL and HDL subpopulations. VEGF serum concentrations were previously correlated with parameters of lipid profile, including TGs, in hypercholesterolemic patients [72]. Finally, uric acid contents were significantly increased in both patients’ populations with high TGs levels, regardless of HDL-c values, suggesting a direct impact of TGs, as previously reported [73]. Uric acid levels presented significant inverse correlation with adiponectin and direct with waist circumference, in particular in the population with normal HDL-c and normal TGs contents, in agreement with the previously reported correlations, between both Ox-LDL and adiponectin and the large and small HDL subpopulations, suggesting a strong relationship between these lipidic, oxidative and inflammatory factor, which might be described yet as non-traditional markers. The fact that these associations are less evident in the subgroups of patients with low HDL-c levels and/or high TGs contents seem to indicate that under HDL-c dyslipidemia and/or hypertriglyceridemia there is a deregulation of the factors (lipidic, oxidative, and inflammatory), with a putative important impact on the evolution of cardiometabolic vascular disease.
Considering the cardiometabolic impact of low-HDL-c and/or high TGs levels on this type of patients with previous cardiovascular risk factors, even when LDL-c concentrations are adequately managed by antidyslipidemic therapy, ther-apeutic measures able to improve HDL-c levels and their quality/functionality and to reduce TGs concentration might be of key importance to reduce the residual risk previously identified on this type of populations, namely, by reducing
the oxidative, inflammatory and angiogenic mechanisms underlying the evolution of disease. Since the current ther-apeutic arsenal is of limited impact on HDL-c levels, in particular the most popular medication, such as statins, and since a percentage of patients (of concern) present low HDL-c dyslipidemia and/or hypertriglyceridemia, nonpharmacolog-ical measures (including regular physnonpharmacolog-ical exercise and low-fat and low-sugar diets) might deserve more attention, as well as new and more effective agents that might prove efficacy to reduce TGs concentration and improve HDL quality and their beneficial effects, including reduction of Ox-LDL as well as of deleterious inflammatory mediators. Despite some disappointing results of some of the recent clinical trials aimed to access the putative benefits of pharmacotherapy tar-geting HDL cholesterol, particularly in terms of side-effects and short and long-term outcome data of cardiovascular events [74], there are positive results related to the impact of dalcetrapib, a cholesteryl ester transfer protein (CETP) inhibitor, on HDL quality [75]. This apparent discrepancy raises the question as to whether certain biomarkers are relevant either in specific patient populations or on the background of therapies, such as statins. More clinical data of large clinical trials designed to evaluate the impact on cardiovascular events of drugs directed to modulate HDL concentration and/or quality are needed to better elucidate this issue.
5. Conclusions
In a patient population with cardiovascular risk factors, low HDL-c and/or high TGs levels are associated with a poor cardiometabolic profile. This condition that often occurs in patients under lipid-lowering therapy with average LDL-c concentrations has been called residual cardiovascular risk, and the patients are those that frequently experience nonfatal and fatal cardio- and cerebrovascular events. Our study suggests that this residual cardiovascular risk is better viewed by nontraditional (emergent) lipid biomarkers, including HDL subpopulations, oxidized LDL, as well as markers of inflammation and angiogenesis, such as adiponectin, uric acid, and VEGF. Proper pharmacological and nonpharma-cological therapeutic interventions directed to raise HDL-c levels and functionality and to reduce TGs levels are advisory preventive measures in this type of CV risk populations.
Conflict of Interests
The authors report no conflict of interests.
Acknowledgments
This study was supported by the Portuguese Founda-tion for Science and Technology, through a Ph.D. Grant (SFRH/BD/65483/2009) and Strategic Project (PEst-C/SAU/ UI3282/2011) and COMPETE.
References
[1] M. Nichols, N. Townsend, P. Scarborough et al., European Car-diovascular Disease Statistics, British Heart Foundation Health Promotion Research Group and Health Economics Research Centre, 2012.
[2] C. Baigent, A. Keech, P. M. Kearney et al., “Efficacy and safety of cholesterol-lowering treatment: prospective meta-analysis of data from 90,056 participants in 14 randomised trials of statins,” The Lancet, vol. 366, no. 9493, pp. 1267–1278, 2005.
[3] C. P. Cannon, B. A. Steinberg, S. A. Murphy, J. L. Mega, and E. Braunwald, “Meta-analysis of cardiovascular outcomes trials comparing intensive versus moderate statin therapy,” Journal of the American College of Cardiology, vol. 48, no. 3, pp. 438–445, 2006.
[4] Cholesterol Treatment Trialists’ (CTT) Collaborators, P. M. Kearney, L. Blackwell et al., “Efficacy of cholesterol-lowering therapy in 18 686 people with diabetes in 14 randomised trials of statins: a meta-analysis,” The Lancet, vol. 371, no. 9607, pp. 117–125, 2008.
[5] P. M. da Silva and S. M. Cardoso, “Persistent lipid abnormalities in patients treated with statins: Portuguese results of the DYSlipidemia International Study (DYSIS),” Revista Portuguesa de Cardiologia, vol. 30, no. 1, pp. 47–63, 2011.
[6] S. Horgan, J. Crowley, J. Feely, B. McAdam, E. Shanahan, and C. Vaughan, “Prevalence of dyslipidaemia in statin-treated patients in Ireland: Irish results of the DYSlipidaemia Interna-tional Study (DYSIS),” Irish Journal of Medical Science, vol. 180, no. 2, pp. 343–349, 2011.
[7] H. Drexel, F. Chazelle, C. Fauer, D. Lautsch, and A. K. Gitt, “Per-sistent dyslipidemia in Austrian patients treated with statins for primary and secondary prevention of atherosclerotic events— results of the DYSlipidemia International Study (DYSIS),” Wiener Klinische Wochenschrift, vol. 123, no. 19-20, pp. 611–617, 2011.
[8] A. K. Gitt, C. J¨unger, W. Smolka, and K. Bestehorn, “Prevalence and overlap of different lipid abnormalities in statin-treated patients at high cardiovascular risk in clinical practice in Germany,” Clinical Research in Cardiology, vol. 99, no. 11, pp. 723–733, 2010.
[9] D. Vanuzzo, “The epidemiological concept of residual risk,” Internal and Emergency Medicine, vol. 6, pp. 45–51, 2011. [10] M. P. Hermans and J. Fruchart, “Reducing residual vascular risk
in patients with atherogenic dyslipidemia: where do we go from here?” Clinical Lipidology, vol. 5, no. 6, pp. 811–826, 2010. [11] C. P. Cannon, E. Braunwald, C. H. McCabe et al., “Intensive
versus moderate lipid lowering with statins after acute coronary syndromes,” The New England Journal of Medicine, vol. 350, no. 15, pp. 1495–1504, 2004.
[12] J. C. LaRosa, S. M. Grundy, D. D. Waters et al., “Intensive lipid lowering with atorvastatin in patients with stable coronary disease,” The New England Journal of Medicine, vol. 352, no. 14, pp. 1425–1435, 2005.
[13] T. R. Pedersen, O. Faergeman, J. J. P. Kastelein et al., “High-dose atorvastatin vs usual-dose simvastatin for secondary prevention after myocardial infarction: the IDEAL study: a randomized controlled trial,” The Journal of the American Medical Associa-tion, vol. 294, no. 19, pp. 2437–2445, 2005.
[14] M. J. Cziraky, K. E. Watson, and R. L. Talbert, “Targeting low HDL-cholesterol to decrease residual cardiovascular risk in the managed care setting,” Journal of Managed Care Pharmacy, vol. 14, no. 8, pp. S3–S28, 2008.
[15] P. Alagona Jr., “Beyond LDL cholesterol: the role of elevated triglycerides and low HDL cholesterol in residual CVD risk remaining after statin therapy,” The American Journal of Man-aged Care, vol. 15, no. 3, pp. S65–S73, 2009.
[16] B. F. Asztalos and E. J. Schaefer, “HDL in atherosclerosis: actor or bystander?” Atherosclerosis Supplements, vol. 4, no. 1, pp. 21– 29, 2003.
[17] M. R. Hayden and S. C. Tyagi, “Isolated low high density lipoprotein-cholesterol (HDL-C): implications of global risk reduction. Case report and systematic scientific review,” Cardio-vascular Diabetology, vol. 4, no. 1, article 1, 2005.
[18] T. Gordon, W. P. Castelli, M. C. Hjortland, W. B. Kannel, and T. R. Dawber, “High density lipoprotein as a protective factor against coronary heart disease. The Framingham study,” The American Journal of Medicine, vol. 62, no. 5, pp. 707–714, 1977. [19] K. E. Kypreos, S. Gkizas, L. S. Rallidis, and I. Karagiannides,
“HDL particle functionality as a primary pharmacological target for HDL-based therapies,” Biochemical Pharmacology, vol. 85, no. 11, pp. 1575–1578, 2013.
[20] E. M. Tsompanidi, M. S. Brinkmeier, E. H. Fotiadou, S. M. Giak-oumi, and K. E. Kypreos, “HDL biogenesis and functions: role of HDL quality and quantity in atherosclerosis,” Atherosclerosis, vol. 208, no. 1, pp. 3–9, 2010.
[21] L. Camont, M. J. Chapman, and A. Kontush, “Biological activities of HDL subpopulations and their relevance to cardio-vascular disease,” Trends in Molecular Medicine, vol. 17, no. 10, pp. 594–603, 2011.
[22] J. R. Schaefer, “HDL level or HDL function as the primary target in preventive cardiology,” Herz, vol. 37, no. 1, pp. 51–55, 2012. [23] B. F. Asztalos, P. S. Roheim, R. L. Milani et al., “Distribution of
apoA-I-containing HDL subpopulations in patients with coro-nary heart disease,” Arteriosclerosis, Thrombosis, and Vascular Biology, vol. 20, no. 12, pp. 2670–2676, 2000.
[24] A. Pirillo, G. D. Norata, and A. L. Catapano, “High-density lipoprotein subfractions—what the clinicians need to know,” Cardiology, vol. 124, no. 2, pp. 116–125, 2013.
[25] F. Mascarenhas-Melo, J. Sereno, E. Teixeira-Lemos et al., “Mark-ers of increased cardiovascular risk in postmenopausal women: focus on oxidized-LDL and HDL subpopulations,” Disease Markers, vol. 35, no. 2, pp. 85–96, 2013.
[26] F. Mascarenhas-Melo, D. Marado, F. Palavra et al., “Diabetes abrogates sex differences and aggravates cardiometabolic risk in postmenopausal women,” Cardiovascular Diabetology, vol. 12, article 61, 2013.
[27] F. Palavra, D. Marado, F. Mascarenhas-Melo et al., “New mark-ers of early cardiovascular risk in multiple sclerosis patients: oxidized-LDL correlates with clinical staging,” Disease Markers, vol. 34, no. 5, pp. 341–348, 2013.
[28] L. Querton, M. Buysschaert, and M. P. Hermans, “Hypertriglyc-eridemia and residual dyslipidemia in statin-treated patients with diabetes at the highest risk for cardiovascular disease and achieving very-low low-density lipoprotein-cholesterol levels,” Journal of Clinical Lipidology, vol. 6, no. 5, pp. 434–442, 2012. [29] N. Sarwar, J. Danesh, G. Eiriksdottir et al., “Triglycerides
and the risk of coronary heart disease: 10 158 Incident cases among 262 525 participants in 29 Western prospective studies,” Circulation, vol. 115, no. 4, pp. 450–458, 2007.
[30] P. N. Hopkins, L. L. Wu, S. C. Hunt, and E. A. Brinton, “Plasma triglycerides and type III hyperlipidemia are independently associated with premature familial coronary artery disease,” Journal of the American College of Cardiology, vol. 45, no. 7, pp. 1003–1012, 2005.
[31] P. McBride, “Triglycerides and risk for coronary artery disease,” Current Atherosclerosis Reports, vol. 10, no. 5, pp. 386–390, 2008. [32] M. Miller, C. P. Cannon, S. A. Murphy et al., “Impact of triglyceride levels beyond low-density lipoprotein cholesterol after acute coronary syndrome in the PROVE IT-TIMI 22 trial,” Journal of the American College of Cardiology, vol. 51, no. 7, pp. 724–730, 2008.
[33] A. Keech, R. J. Simes, P. Barter et al., “Effects of long-term fenofibrate therapy on cardiovascular events in 9795 people with type 2 diabetes mellitus (the FIELD study): randomised controlled trial,” The Lancet, vol. 366, no. 9500, pp. 1849–1861, 2005.
[34] J. J. Genest Jr., S. S. Martin-Munley, J. R. McNamara et al., “Familial lipoprotein disorders in patients with premature coronary artery disease,” Circulation, vol. 85, no. 6, pp. 2025– 2033, 1992.
[35] H. N. Ginsberg, “New perspectives on atherogenesis: role of abnormal triglyceride-rich lipoprotein metabolism,” Circula-tion, vol. 106, no. 16, pp. 2137–2142, 2002.
[36] Z. Quijada, M. Paoli, Y. Zerpa et al., “The triglyceride/HDL-cholesterol ratio as a marker of cardiovascular risk in obese children; association with traditional and emergent risk factors,” Pediatric Diabetes, vol. 9, no. 5, pp. 464–471, 2008.
[37] T. McLaughlin, G. Reaven, F. Abbasi et al., “Is there a simple way to identify insulin-resistant individuals at increased risk of cardiovascular disease?” The American Journal of Cardiology, vol. 96, no. 3, pp. 399–404, 2005.
[38] P. Barter, Y. R. McPherson, K. Song et al., “Serum insulin and inflammatory markers in overweight individuals with and without dyslipidemia,” Journal of Clinical Endocrinology and Metabolism, vol. 92, no. 6, pp. 2041–2045, 2007.
[39] P. W. F. Wilson, R. B. D’Agostino, D. Levy, A. M. Belanger, H. Silbershatz, and W. B. Kannel, “Prediction of coronary heart disease using risk factor categories,” Circulation, vol. 97, no. 18, pp. 1837–1847, 1998.
[40] D. G. Hackam and S. S. Anand, “Emerging risk factors for atherosclerotic vascular disease: a critical review of the evi-dence,” The Journal of the American Medical Association, vol. 290, no. 7, pp. 932–940, 2003.
[41] G. Assmann, P. Cullen, J. Fruchart et al., “Implications of emerging risk factors for therapeutic intervention,” Nutrition, Metabolism and Cardiovascular Diseases, vol. 15, no. 5, pp. 373– 381, 2005.
[42] D. de Bacquer, J. Dallongeville, K. Kotseva et al., “Residual risk of cardiovascular mortality in patients with coronary heart disease: the EUROASPIRE risk categories,” International Journal of Cardiology, 2012.
[43] S. Mehra, H. Movahed, and A. Movahed, “Emerging therapies for residual risk,” Reviews in Cardiovascular Medicine, vol. 13, no. 1, pp. 24–31, 2012.
[44] N. J. Stone, “Reducing residual risk in secondary prevention of cardiovascular disease,” Circulation, vol. 125, no. 16, pp. 1958– 1960, 2012.
[45] J. J. Genest, J. R. McNamara, D. N. Salem, and E. J. Schaefer, “Prevalence of risk factors in men with premature coronary artery disease,” The American Journal of Cardiology, vol. 67, no. 15, pp. 1185–1189, 1991.
[46] Y. Ishigaki, Y. Oka, and H. Katagiri, “Circulating oxidized LDL: a biomarker and a pathogenic factor,” Current Opinion in Lipidology, vol. 20, no. 5, pp. 363–369, 2009.
[47] P. Holvoet, “Oxidized LDL and coronary heart disease,” Acta Cardiologica, vol. 59, no. 5, pp. 479–484, 2004.
[48] D. C. Chan, H. P. R. Barrett, and G. F. Watts, “Dyslipidemia in visceral obesity: mechanisms, implications, and therapy,” The American Journal of Cardiovascular Drugs, vol. 4, no. 4, pp. 227– 246, 2004.
[49] J. P. Despres, S. Moorjani, A. Tremblay et al., “Relation of high plasma triglyceride levels associated with obesity and regional adipose tissue distribution to plasma lipoprotein-lipid com-position in premenopausal women,” Clinical and Investigative Medicine, vol. 12, no. 6, pp. 374–380, 1989.
[50] M. I. Burgos-Alves, F. Avil´es-Plaza, R. Mart´ınez-Tom´as et al., “Oxidized LDL and its correlation with lipid profile and oxidative stress biomarkers in young healthy Spanish subjects,” Journal of Physiology and Biochemistry, vol. 66, no. 3, pp. 221– 227, 2010.
[51] A. N. N. Mertens and P. Holvoet, “Oxidized LDL and HDL: antagonists in atherothrombosis,” FASEB Journal, vol. 15, no. 12, pp. 2073–2084, 2001.
[52] G. Assmann, H. Schulte, A. von Eckardstein, and Y. Huang, “High-density lipoprotein cholesterol as a predictor of coro-nary heart disease risk. The PROCAM experience and patho-physiological implications for reverse cholesterol transport,” Atherosclerosis, vol. 124, pp. S11–S20, 1996.
[53] U. Goldbourt, S. Yaari, and J. H. Medalie, “Isolated low HDL cholesterol as a risk factor for coronary heart disease mortality: a 21-year follow-up of 8000 men,” Arteriosclerosis, Thrombosis, and Vascular Biology, vol. 17, no. 1, pp. 107–113, 1997.
[54] E. Eren, N. Yilmaz, and O. Aydin, “High density lipoprotein and it’s dysfunction,” Open Biochemistry Journal, vol. 6, pp. 78–93, 2012.
[55] H. Soran, S. Hama, R. Yadav, and P. N. Durrington, “HDL functionality,” Current Opinion in Lipidology, vol. 23, no. 4, pp. 353–366, 2012.
[56] M. Mackness, P. Durrington, and B. Mackness, “Paraoxonase 1 activity, concentration and genotype in cardiovascular disease,” Current Opinion in Lipidology, vol. 15, no. 4, pp. 399–404, 2004. [57] B. Y. Yan, M. D. Fu, Y. Y. Yang, Y. H. Xu, Y. Liu, and L. C. Yang, “The interrelationships between serum triglyceride, total cholesterol and HDL subpopulations,” Sichuan Da Xue Xue Bao Yi Xue Ban, vol. 35, no. 3, pp. 327–329, 2004.
[58] L. Tian, Y. Xu, M. Fu, T. Peng, Y. Liu, and S. Long, “The impact of plasma triglyceride and apolipoproteins concen-trations on high-density lipoprotein subclasses distribution,” Lipids in Health and Disease, vol. 10, article 17, 2011.
[59] H. Watanabe, S. S¨oderlund, A. Soro-Paavonen et al., “Decreased high-density lipoprotein (HDL) particle size, pre𝛽-, and large HDL subspecies concentration in Finnish low-HDL fami-lies: relationship with intima-media thickness,” Arteriosclerosis, Thrombosis, and Vascular Biology, vol. 26, no. 4, pp. 897–902, 2006.
[60] A. Pascot, I. Lemieux, D. Prud’homme et al., “Reduced HDL particle size as an additional feature of the atherogenic dyslipi-demia of abdominal obesity,” Journal of Lipid Research, vol. 42, no. 12, pp. 2007–2014, 2001.
[61] T. Nakayama and Z. Wang, “Inflammation, a link between obesity and cardiovascular disease,” Mediators of Inflammation, vol. 2010, Article ID 535918, 17 pages, 2010.
[62] G. Assmann and J. Nofer, “Atheroprotective effects of high-density lipoproteins,” Annual Review of Medicine, vol. 54, pp. 321–341, 2003.
[63] P. J. Barter, S. Nicholls, K. Rye, G. M. Anantharamaiah, M. Navab, and A. M. Fogelman, “Antiinflammatory properties of HDL,” Circulation Research, vol. 95, no. 8, pp. 764–772, 2004.
[64] J. Nofer, M. F. Brodde, and B. E. Kehrel, “High-density lipopro-teins, platelets and the pathogenesis of atherosclerosis: frontiers in research review: physiological and pathological functions of high-density lipoprotein,” Clinical and Experimental Pharma-cology and Physiology, vol. 37, no. 7, pp. 726–735, 2010. [65] H. Mangge, G. Almer, M. Truschnig-Wilders, A. Schmidt, R.
Gasser, and D. Fuchs, “Inflammation, adiponectin, obesity and cardiovascular risk,” Current Medicinal Chemistry, vol. 17, no. 36, pp. 4511–4520, 2010.
[66] S. S. Huang, P. H. Huang, Y. H. Chen, K. H. Chiang, J. W. Chen, and S. J. Lin, “Association of adiponectin with future cardiovascular events in patients after acute myocardial infarction,” Journal of Atherosclerosis and Thrombosis, vol. 17, no. 3, pp. 295–303, 2010.
[67] C. Kalka, T. Takahashi, H. Masuda, T. Asahara, and J. M. Isner, “Vascular endothelial growth factor (VEGF): therapeutic angio-genesis and vasculoangio-genesis in the treatment of cardiovascular disease,” Medizinische Klinik, vol. 94, no. 4, pp. 193–201, 1999. [68] K. Kitagawa, M. Matsumoto, T. Sasaki et al., “Involvement
of ICAM-1 in the progression of atherosclerosis in APOE-knockout mice,” Atherosclerosis, vol. 160, no. 2, pp. 305–310, 2002.
[69] Q. Li, Z. Yang, B. Lu et al., “Serum uric acid level and its asso-ciation with metabolic syndrome and carotid atherosclerosis in patients with type 2 diabetes,” Cardiovascular Diabetology, vol. 10, article 72, 2011.
[70] T. Kazumi, A. Kawaguchi, T. Hirano, and G. Yoshino, “Serum adiponectin is associated with high-density lipoprotein choles-terol, triglycerides, and low-density lipoprotein particle size in young healthy men,” Metabolism, vol. 53, no. 5, pp. 589–593, 2004.
[71] V. Izadi, E. Farabad, and L. Azadbakht, “Epidemiologic evidence on serum adiponectin level and lipid profile,” International Journal of Preventive Medicine, vol. 4, no. 2, pp. 133–140, 2013. [72] J. Trap´e, C. Morales, R. Molina et al., “Vascular endothelial
growth factor serum concentrations in hypercholesterolemic patients,” Scandinavian Journal of Clinical and Laboratory Inves-tigation, vol. 66, no. 3, pp. 261–267, 2006.
[73] L. J. Zhao, D. Zhao, J. Liu et al., “Association between serum uric acid and triglyceride in a Chinese community,” Zhonghua Nei Ke Za Zhi, vol. 44, no. 9, pp. 664–667, 2005.
[74] R. S. Wright, “Recent clinical trials evaluating benefit of drug therapy for modification of HDL cholesterol,” Current Opinion in Cardiology, vol. 28, no. 4, pp. 389–398, 2013.
[75] C. M. Ballantyne, M. Miller, E. J. Niesor, T. Burgess, D. Kallend, and E. A. Stein, “Effect of dalcetrapib plus pravastatin on lipoprotein metabolism and high-density lipoprotein composi-tion and funccomposi-tion in dyslipidemic patients: results of a phase IIb dose-ranging study,” The American Heart Journal, vol. 163, no. 3, pp. 515.e3–521.e3, 2012.
Submit your manuscripts at
http://www.hindawi.com
Hindawi Publishing Corporation
http://www.hindawi.com Volume 2013 Oxidative Medicine and Cellular Longevity
Hindawi Publishing Corporation
http://www.hindawi.com Volume 2013
Hindawi Publishing Corporation
http://www.hindawi.com Volume 2013
The Scientific
World Journal
International Journal of
Endocrinology
Hindawi Publishing Corporation
http://www.hindawi.com Volume 2013
ISRN
Anesthesiology
Hindawi Publishing Corporation
http://www.hindawi.com Volume 2013
Oncology
Journal ofHindawi Publishing Corporation
http://www.hindawi.com Volume 2013
PPAR
R e s e a r c h
Hindawi Publishing Corporation
http://www.hindawi.com Volume 2013
Ophthalmology
Journal ofHindawi Publishing Corporation
http://www.hindawi.com Volume 2013
ISRN
Allergy
Hindawi Publishing Corporation
http://www.hindawi.com Volume 2013
BioMed Research International
Hindawi Publishing Corporation
http://www.hindawi.com Volume 2013
Hindawi Publishing Corporation
http://www.hindawi.com Volume 2013
ISRN
Addiction
Hindawi Publishing Corporation
http://www.hindawi.com Volume 2013
Hindawi Publishing Corporation
http://www.hindawi.com Volume 2013 Computational and Mathematical Methods in Medicine ISRN AIDS
Hindawi Publishing Corporation
http://www.hindawi.com Volume 2013
Clinical & Developmental Immunology
Hindawi Publishing Corporation
http://www.hindawi.com Volume 2013
Diabetes ResearchJournal of
Hindawi Publishing Corporation
http://www.hindawi.com Volume 2013
Evidence-Based Complementary and Alternative Medicine
Volume 2013 Hindawi Publishing Corporation
http://www.hindawi.com
Hindawi Publishing Corporation
http://www.hindawi.com Volume 2013 Gastroenterology Research and Practice
Hindawi Publishing Corporation
http://www.hindawi.com Volume 2013 ISRN
Biomarkers
Hindawi Publishing Corporation
http://www.hindawi.com Volume 2013