A Work Project presented as part of the requirement for the Award of a Masters Degree in Finance from the NOVA – School of Business and Economics
Measuring the impact of Short and Lending Practices using the DGTW Benchmarks
Diana Filipa da Silva Oliveira, #574
A Project carried out under the supervision of: Melissa Prado
7th of January 2015
Acknowledgements
I am deeply grateful to Professor Melissa Prado (Nova SBE) for invaluable guidance. All remaining errors are solely my responsibility.
Measuring the impact of Short and Lending Practices using the DGTW Benchmarks
Abstract
Mutual fund managers increasingly lend their holdings and/or use short sales to generate higher returns for their funds. This project presents a first look into the impact these practices on performance using the performance measures: i) Characteristic Selectivity (CS), the ability of the fund's managers to choose stocks that outperform their benchmarks; ii) Characteristic Timing (CT), the ability of the manager to time the market; iii) and Average Style (AS), the returns from funds systematically holding stocks with certain characteristics. These returns are computed through the DGTW benchmarks. The effect of other variables that have also been shown to impact fund’s returns – total net assets under management, investment styles, turnover and expense ratios – will also be analyzed. I find that managers who use short-sales do not exhibit better stock picking abilities than those who do not, while mutual funds that lend do present higher CS returns. In addition, while lending is not significant for the total performance of a fund, the employment of short-sales and of both short-sales and lending has a negative impact on the fund’s performance.
KEYWORDS: DGTW Benchmarks, Mutual Funds Performance, Short-Sales, Lending
Introduction
By the end of 2013, mutual funds had USD 15 trillion of assets under management (henceforth, AUM) in the United States. This amounts to the double of AUM in 2003. As the mutual fund market grew, managers looked into other strategies – besides being long on assets – in order to generate higher returns (e.g. lending their holdings to short
sellers and receiving interest and appreciation on the collateral of loaned securities, or employing short selling strategies in their management).
This works aims to measure the impact of those lending and short selling practices on the performance of mutual funds. I use benchmarks based on the characteristics of the stocks held by the funds under evaluation, which will allows me to decompose the performance into three components1: Characteristic Selectivity (CS) – the ability of the fund's managers to choose stocks that outperform their benchmarks; Characteristic Timing (CT) – the ability of the manager to time the market; and Average Style (AS) – returns from funds systematically holding stocks with certain characteristics. This analysis will be performed over the three return components and the total performance of the fund – taken as the sum of the CS, CT and AS measures. Additionally variables such as the investment objectives, expense ratios, turnover ratios and size will also be analyzed, with the objective of studying the impact of those variables on the DGTW returns. However, and due to the lower amount of funds with investment objectives reported, the analysis will be performed using two samples. The first, with 2.323 funds under analysis, where 132 use short-sales, 1122 lend their holdings and 74 use both strategies, does not include the investment objectives. The second, which includes those objectives, contains 1.257 funds, where 62 use short-sales, 678 lend their stock holdings and 41 funds employ both short-sales and lending strategies.
My work contributes to the mutual fund literature by “stepping outside of the norm” (i.e. not using the DGTW benchmarks as another performance evaluation method, to be used along with factor models), but actually measuring how variables such as the
1 Defined by Daniel et al. (1997) in the work Measuring Mutual Fund Performance with Characteristic- Based Benchmarks. A more detailed description can be found in Section III.
strategies implemented by managers, expenses, etc. – influence each of the performance metrics. The DGTW returns have some advantages relative to factor based models. They allow for a more accurate understanding of the fund’s performance, as it decomposes such performance in three components. This decomposition consequently enables the analysis of how a variable can have opposite effects on the return components. For example, for variables that are expected to have contrary impacts on the performance metrics (e.g. short-sales or turnover ratio), this model answer allows us to infer which effect has the highest magnitude. In addition, the DGTW benchmarks have been shown to derive more accurate estimates (i.e. with lower standard errors), and thus have more statistical power than factor based performance models2. As these performance measures have grown in popularity – specially the CS component, which is increasingly being used as a measure of stock-picking abilities of managers – it is important to assess what makes them tick, i.e. how the variables (which have been shown to impact the returns derived from factor models) impact the DGTW benchmark based returns. In addition, this work adds to the literature regarding the short-selling and lending practices of the funds, which is relatively scarce, by answering questions such as: i) are fund managers who use short-sales better stock-pickers than those that do not?; ii) is the underperformance of funds that lend due to worse stock-picking skills of their managers?
I find that shorting, lending or engaging in both strategies has a negative impact on the AS component (the returns from funds systematically holding stocks with certain characteristics). A fund lending its securities, and engaging in both short sales and lending has a positive effect on the stock picking abilities of the fund’s manager. Thus,
2
lending is not a sign of worst stock-picking skills. Managers that use short-sales do not, however, demonstrate a significant CS measure (the ability of the fund's managers to choose stocks that outperform their benchmarks). Furthermore, the use of both strategies has an adverse impact on the total performance. Finally size, turnover and an aggressive investment style have a positive effect on the performance of the fund, while the expense ratio is also significant and has positive impact when considering the broader sample. Indeed, expenses, turnover and investment styles have a higher impact on the fund’s returns, in comparison to the use of short-sales or lending strategies.
This thesis is organized as follows: the first section provides a brief literature review of the most important works in this topic. Section II details the sources of data. Then, section III describes the DGTW benchmarks and corresponding performance components, whereas Section IV resumes the methodology applied and the corresponding results. Section V concludes.
I. Literature Review:
Most of the literature regarding mutual fund is focused on whether mutual fund managers exhibit stock-picking abilities, i.e. if actively managed mutual funds outperform passively managed ones. Starting with Sharpe (1966) and Jensen (1968) to more recent studies such as Wermers (2000) and Fama et al. (2010), it can be conclude that, on average, actively managed funds underperform passive benchmarks, when accounting for expenses. As actively managed funds tend to have higher expenses (average of 100 basis points vs 20 basis points for index funds3) justified mostly by the expertise of the managers and their ability to beat the market, the literature shows that,
3
when existing, manager skill is not enough to cover the costs. Notwithstanding, some fund managers are able to outperform the passive benchmarks (even after accounting for expenses), as found by the evidence of persistence in mutual fund performance [Grinblatt et al. (1992), Hendricks et al.(1993)]. This persistence has been justified by survival bias (Brown et al., 1992) and common factors in stock returns and investment expenses (Cahart, 1997). Works by Fama et al. (2010) and Wermers (2010) – which also look into this outperformance in order to infer if it is due to skill or luck – find that it is, on average, attributable to luck. Wermers (2010) also concludes that, as there is a decreasing trend of outperforming funds, the number of skilled managers is decreasing while the number of unskilled managers is increasing. Literature that measures performance by analyzing the stock holdings [Grinblatt et al. (1989); Wermers (1997), Daniel et al. (1997)] finds that, on average, active fund managers exhibit stock picking abilities, e.i. they are able to choose stocks that outperform their benchmarks. However as their outperformance is quite small and approximately equal to management fees, these results are in line with works that employ performance evaluation methods that examine the net returns of the funds. Chen et al. (2000), that analyses the trades of the funds, argues that managers do not pick funds that outperform other stocks, but buy stock that have higher returns than the stocks that they sell.
The mutual fund literature regarding the impact of the lending and short selling practices of funds is relative small, as the adoption of these strategies is quite recent. Nonetheless, Evans. et al. (2013) has looked into the performance of funds that lend their securities to short sellers, and found that, on average, those fund underperform 0,5% to 1% in comparison with similar funds that do not lend. They argue that lending is less profitable than acting on the short selling signal and disposing of the shares.
Funds managers are not however, fully responsible for this underperformance, as the work also found that the underperformance of funds that lend is concentrated on funds whose families restrict their ability to act upon the short-selling restrictions. In what regards funds that use short sales the results of Chen et al. (2013) affirms that they outperform those funds that do not implement short selling strategies. Chen also profiles the funds that use short sales: younger funds, with higher portfolio turnover, expense ratios and management fees.
As most funds are unable to outperform passive benchmarks due to expenses it is expected that fees have a negative impact on fund performance, which has been confirmed by Cahart (1997). Moreover, his work finds that the portfolio turnover is also inversely correlated with performance, with trading reducing returns by approximately 0,95% of the trade’s market value. However Wermers (2000) assesses that high-turnover funds exhibit higher returns than low-high-turnover ones (due to higher stock-picking skills by managers of the first) and their net unadjusted returns beat the passive benchmark4. The effect of size in a fund’s performance is not as linear – if on one hand there are advantages to being big (e.g. economies of scale which can lower transaction ratios and expenses ratios), on the other a large asset base reduces fund performance because of trading costs associated with liquidity or price impact. Lack of liquidity may lead a large fund to invest in its “not-so-good” ideas and take larger than optimal positions. Works of Chen et al. (2004) and Perold et al. (1991) find that a fund’s size is inversely correlated with fund performance. The results are in line with Grinblatt et al. (1989), which also assesses the effect of different investment objectives on the performance of the fund. They conclude that aggressive growth and growth funds show
4
superior performance (particularly in smaller funds), but as those funds also have the higher expenses, the net returns do not present abnormal performance.
II. Data
The mutual fund holdings are taken from the Mutual Fund Common Stock Holdings Database of Thomson Reuters (TFN/CDA S12), which covers almost all of the US based mutual funds plus three thousand international funds, since 1979. As this database covers funds with several asset orientations (e.g. stocks, bonds, both, etc.) and different geographies (e.g. US, Canada, Europe), I narrowed the database to stocks with investment objectives code oriented towards equity5 and which the managements company are based in the US (in order to focus on funds with most of their holdings in firms which quote in US Stock Exchanges)6. The investment objectives of the funds are also taken from this database. The collection procedure of the database does not require that the funds survive, and thus the data is free of survivorship bias. The stock prices, used to compute the stocks monthly returns, are obtained from the CRSP US Stocks Database, which contains information regarding the share price and dividends of stocks that negotiate in the NYSE, NYSE MKT, NASDAQ and NYSE Arca Stock Exchanges. The benchmark portfolios and their returns are taken from Russ Wermers webpage7. The CRSP Survivor-Bias-Free US Mutual Fund Guide (MFDB) provides the data
5
Funds with codes of: 2- Aggressive Growth; 3 – Growth; 4- Growth and Income. Funds with investment objectives of aggressive growth and growth invest in stocks of growth companies, with objective of obtaining capital gains, instead of dividend income. Growth and Income funds invest in high-yield conservative stock with the goal of achieving capital gains and a regular stream of income (through dividends).
6 For funds for that there was no investment code on Thomson Reuters Database, I took their CRSP objective code in order to validate if whether they were geared towards domestic (US) equity (codes starting with ED) or other type of securities. If a fund did not have an investment/objective code in a given year, the previous year code was considered.
7
The DGTW benchmarks are available via
regarding the expenses, turnover ratio, total net assets, classification of funds as active or passive and their investment styles. The lending and shorting practices of the funds are taken from the annual N-SAR-B fund filings from the SEC’s Edgar database. The data from Thomson Reuters and CRSP was merged using the Mutual Fund Links (MFlinks), which provides links between the 98% of the domestic equity funds in CRSP and Thomson Reuters, through a common Wharton Institution Center Number (WFICN). As the annual N-SAR-B fund fillings became obligatory for all funds in the end of 1995, my analysis will be performed from 1996 to 2009.
III. The DGTW benchmarks
The characteristics based approach was developed and presented by Daniel, Grinblatt, Titman and Wermers in the 1997 work “Measuring Mutual Fund Performance with Characteristic Based Benchmarks”. It evaluates the performance of the funds through benchmarks based on the characteristics of stocks held by the funds. The benchmark portfolios are constituted as follows: stocks listed on the NYSE, AMEX/NYSE MKT and NASDAQ markets (which meet the requirements defined by the authors), are sorted into quintiles based on their market equity value, book-to-market ratio and momentum8 on the 1st of July of each year (starting in 1972). The first sorting is done based on the size (or market equity value) of the stock, with the size breakpoints defined taking only into account the stocks on the NYSE. Then the firms in each size quintile are sorted in five additional quintiles based on their book-to-market ratio (in the final day of December preceding the formation date), which are “industry adjusted” by subtracting the long term industry average book-to-market ratio, totaling 25 (5x5) benchmark
8 Fama et al. (1992) and Jegadeesh et al. (1993) studies have shown that these are the best ex ante predictors of cross sectional partners in common stock returns.
portfolios. The final step is taking each of the 25 portfolios and sorting then into five additional quintiles based on the part 12 month return calculated until May of the formation year – i.e. one month before the formation date, in order to reduce problems with the bid-ask bounce and monthly return reversals. This three time sorting of stocks into five quintiles results in 125 (5x5x5) benchmark characteristic portfolios. The returns are computed by value weighting the stocks in the portfolio.
After obtaining the benchmark returns, the three measures of manager/fund performance can be constructed:
1. Characteristic Selectivity, that assesses if the fund’s manager is able to
invest in stocks that outperform their benchmarks. It is calculated by firstly matching each stock holding to its passive portfolio, in each quarter, on the basis of market capitalization, book-to-market and prior year return. Then, the excess return of the stock holding, at month t, is computed – as the difference between its return and the return of the matched passive portfolio. Finally, to the excess returns is multiplied the portfolio weights of the different funds which hold the stock, to obtain the CS, or the benchmark adjusted return, for each of the funds for each month. Thus, the CS measure for month t is equal to:
CSt= ∑Nj=1wj,t-1 x (Rj,t- Rtb, t-1) (1)
where:
wj,t-1 represents the weight of stock j on fund x at month t-1; Rj,t represents the return of stock j at month t;
Rt b,t-1
represents the return at month t of the benchmark passive portfolio that is matched to stock j at month t-1;
To reach the CS measure of a fund, one must sum the CS measure of all the stocks in its portfolio at time t and compute the time series average of this measure, for all the months that the fund is active. If the CS of the fund is zero then its performance could have been copied, on average, by buying stocks with similar characteristics than the stocks in the fund. If it is positive and statistically significant then it shows that the fund manager exhibits stock picking abilities. If negative, the manager shows bad managerial skill, since it chooses stocks that underperform their benchmark.
2. Characteristic Timing, which captures the ability of the manager to time the market – e.g. is able to gain additional income by changing strategies (size, book to market and momentum) when they are more profitable – is computed by taking the weighted excess return of the passive portfolio (matched to the stock holding at the respective periods) at month t. In mathematical terms the CS measure for month t is:
CTt= ∑Nj=1(wj,t-1Rtb, t-1- wj,t-13R t
b, t-13) (2)
where:
wj,t-1 represents the weight of stock j on fund x at month t-1;
Rtb,t-1 represents the return at month t of the benchmark passive portfolio that is matched to stock j at month t-1;
wj,t-13 represents the weight of stock j on fund x at month t-13;
Rt b,t-13
represents the return at month t of the benchmark passive portfolio that is matched to stock j at month t-13;
If, e.g., a manager increases its position in high book-to-market stocks in the beginning of a month in which the effect was unusually strong, then the CT measure of the manager’s fund (computed as the time-series average for all the months the funds exists) will be positive, i.e., the manager is able to time the market.
3. Average Style, which measures the returns that a fund earns, due to its tendency to hold stocks with certain characteristics, is computed by as follows:
ASt= ∑Nj=1wj,t-13 Rtb, t-13 (3)
where:
wj,t-13 represents the weight of stock j on fund x at month t-13;
Rt b,t-13
represents the return at month t of the benchmark passive portfolio that is matched to stock j at month t-13;
The weights and benchmark portfolios are lagged for one year in order to eliminate the returns due to the manager timing the characteristics. This means that a manager which invests in a certain characteristic (such as high book-to-market), with the goal of timing the returns, will not present a fund with a high AS measure because the investment in those characteristics will most likely happen within the year in which they generate abnormal returns. However a fund that holds a certain characteristic systematically with the goal of increasing returns – without trying to time them! – will have a positive AS return. As with the CS and CT measures, the overall AS measure of the fund is given by the time-series average of the component during the period the fund exists.
To calculate the hypothetical total return of a fund at month t, one must sum the CS, CT and AS measures of the fund. In mathematical terms the total returns (gross) at month t equals to:
TRt=CSt + CTt+ASt (4)
Analyzing directly the holdings of a mutual fund has some advantages: i) it allows the development of benchmarks that better captures the investment styles of the managers; ii) the hypothetical returns do not include fees, expenses and trading costs, but as they are compared to benchmark that also ignores transaction costs, it allows for the analysis of the stock picking and timing abilities of the managers (although it overestimates the returns); iii) characteristics based models provide better ex-ante forecasts of the cross-sectional patterns of future returns9; iv) using characteristic measures it is possible to infer directly if shifts in the portfolio weights forecast future returns, while in factor models it is necessary to determine if changes in factor loadings correspond with the realization of the associated factors; v) the DGTW-based performance controls, in a more accurate way, for mechanical strategies (that can be implemented cheaply by index funds) relative to factor models10; vi) characteristic matching provides a estimates of a fund’s abnormal performance with lower standard error, and thus it should have more statistical power to detect abnormal performance than factor models11. For example, when comparing the DGTW benchmarks with (e.g.) the Carhart four factor regression model, it can be concluded that its dynamic style is preferable over the fixed style coefficient regression: i) the CS measure has a smaller standard error than the alpha (the excess net return of the fund relative to the benchmark); ii) while the AS
9
See Daniel et al. (1997) and Ling et al. (2011). 10
Daniel et al. (1997) shows that factor based risk controls can be beaten by mechanical strategies.
11
component derives more precise measures of returns that result from style loadings, in comparison with the sum of the fixed coefficient times average style return premia of the four factor regression model. However, not all that glitters is gold and there are shortcomings to using this model: i) it requires data on portfolio holdings which can be problematic to obtain in a timely manner (vs. factor models which only require returns, which are more rapid to obtain); ii) small variations in the ad hoc choices performed in the formation of benchmark portfolios can have a significant impact on performance evaluation12; iii) the lack of continuous13 data for the holdings of the funds, can generate hypothetical returns that are different than the real portfolio returns, which leads to agency problems (e.g. window dressing) than can creates biases for performance evaluation14.
IV. Methodology and Results
The analysis will be conducted using two samples: the first has 132 funds that use short sales, 1.122 lend their holdings to short-sellers, 74 funds use both strategies and 1.950 funds do not employ either short-sales or lend their holdings (the total number of funds under analysis is 2.32315). The second (and smaller) database has 62 funds that short, 678 that lend, 41 funds that lend and use short-sales and 1083 who do not led or use short-sales (the actual number of funds under analysis is 1.25716). I use a second database due to the lack of investment objectives (on the Thomson Reuters database) for
12 See Chan et al. (2009). 13
As funds are only obliged to report their holdings twice per year, when quarterly reports do not exists, the weights are generated using the most recent reported holdings, which for some funds may be up to six month old.
14
See Meier et al. (2006).
15 As some funds began shorting and lending during the period of the study, the total number of mutual funds under analysis is not given by the sum of the funds that employ each strategy. A more detailed analysis of the number of funds per year is given on the attachment.
16
all the funds that are considered in the first, which significantly decreases the sample size17. Therefore, I will perform two analyses:
1. the impact of short-sales, lending, lending and short-sales, neither of the strategies, the expense ratio, total net assets under management (as a proxy for size) and turnover ratio on the DGTW performance measures, considering the first database.
2. the effect of the previously mentioned variables, plus the investment objectives of the funds, on the DGTW returns, using the second database. As the sample size decreases, the results of the first sample do not hold on the second.
The control variables – expense ratio; turnover ratio; total net assets; investment style objectives – were chosen taken into account the most common variables used in the mutual fund literature, which could have a significant explanatory power using the DGTW benchmarks (the effect of these variables on the returns has been analyzed using factor models).
Taking into account the previously mentioned literature, it is to be expected that the use of short-sales has a positive impact on the CS and CT measures, as short-sellers are better informed (in comparison with managers that do not use short-sales)18 and therefore should be able to pick stocks that outperform, and time their investments. However the higher turnover found in these funds has an adverse effect on the AS metric (since it will not systematically hold stocks with certain characteristics), and thus the use of short-sales should consequently also have a negative impact on the component. The already shown underperformance of funds that lend foresees a negative
17
As the CRSP objective codes are not directly comparable with the Thomson Reuters one’s (since CRSP considers a broader amount of categories) I was unable to use the CRSP codes to overcome this lack of data.
18
effect of that strategy on the total performance. Yet, since the underperformance is concentrated on funds with family-wide restrictions that do not allow the manager to act upon the short-selling signal, I cannot conclude that lending is a sign of bad managerial skill. Thus I am not able to infer, at this moment, what will be the effect of lending on the three return components. This lack of “clarity” in the impact of lending in the performance components also conditions the forecasting of employing both strategies on the CS, CT and AS components. It is also not possible to extrapolate the findings of the current works on the effects of expense ratios, as they use net returns and the DGTW model generates gross returns. The fund’s size should have a negative impact on the CS measures as it may lead the managers to invest in “not-so-good” ideas. However the lower turnover ratio of a larger fund should be beneficial to the AS19 metric. Higher turnover funds should exhibit a positive effect on the CS and CT component of the fund and, on the other hand, an adverse impact on the AS returns. The effect of the different investment objectives in the individual performance components is not clear. However one can predict that funds with an investment style of aggressive growth and growth will have a positive effect on the total return. Finally, for those variables that it is foreseen opposite effects on the three performance components, it is not possible to infer what will be the outcome on the total return – as this will be dependent of the magnitude of the impact of the variables in the CS, CT and AS metrics.
I start by calculating the monthly CS, CT and AS measures for each fund in the sample, following the steps described on section III, and normalizing the weights20 of the stocks
19
Bigger funds have lower turnovers (likely) to avoid the larger transactions costs due to the larger scale of their investments, in comparison with smaller funds, according to Wermers (2000).
20
As previously mentioned some mutual funds only report in semesters (and not quarterly). Thus some of the weights computed in the analysis use holdings information that is up to six months old.
portfolios so that they add up to one21. The TR component is the computed by the sum of the three measures. The impact of the shorting (only), lending (only), both shorting and lending is then measured through dummy variables, with funds that do not use either strategy taken as the base group. Since the performances measures are monthly, the expense and turnover ratios (of each fund for each year) are divided by 12, with those monthly values being considered for the estimation procedure. The total net assets is taken as log22, and all funds with total net assets below one million are excluded. The effect of the investment styles – aggressive-growth, growth and growth and income – is also measured through dummy variables with the investment objective code of growth and income serving as the base group. Finally I take all of these variables and estimate their impact on the CS, CT, AS and TR23 metrics.
The regression models for the first sample are:
CS=α+β1 short+ β2lend+β3short&lend+β4log(tna)+β5expense ratio+β6turnover ratio (5)
CT=α+β1 short+ β2lend+β3short&lend+β4log(tna)+β5expense ratio+β6turnover ratio (6)
AS=α+β1 short+ β2lend+β3short&lend+β4log(tna)+β5expense ratio+β6turnover ratio (7)
TR=α+β1 short+ β2lend+β3short&lend+β4log(tna)+β5expense ratio+β6turnover ratio (8)
The regression models for the second sample are: CS=α+β1 short+β2lend+β3short&lend+β4log(tna)+β5expense ratio+β6turnover ratio+β7agressive growth+β8growth (9)
CT=α+β1 short+β2lend+β3short&lend+β4log(tna)+β5expense ratio+β6turnover ratio+β7agressive growth+β8growth (10)
AS=α+β1 short+β2lend+β3short&lend+β4log(tna)+β5expense ratio+β6turnover ratio+β7agressive growth+β8growth (11)
21
Following Wermers (2004)
22
Following Chen (2004) and Cahart (1997), and due to scaling.
23
Through a Pooled OLS regression using standard errors corrected for autocorrelation and heteroskedasticity.
TR=α+β1 short+β2lend+β3short&lend+β4log(tna)+β5expense ratio+β6turnover ratio+β7agressive growth+β8growth (12)
Table I- Summary of the variables in sample 1 (does not include dummy variables)
Variables Obs M ean Std. Dev.
CS (% ) 187124 -7.032337 73.47132 CT (% ) 187124 .431922 43.29965 AS (% ) 187124 9.456094 121.0012 TR (% ) 187124 2.855678 142.9154 TNA (in mn)* 187124 1033.455 4416.895 logtna 187124 4.691274 2.178734 Expense Ratio (% ) 187124 .1093102 .0434331 Turnover Ratio (% ) 187124 .083579 .1494134
* Included in the analyis through the variable log(tna)
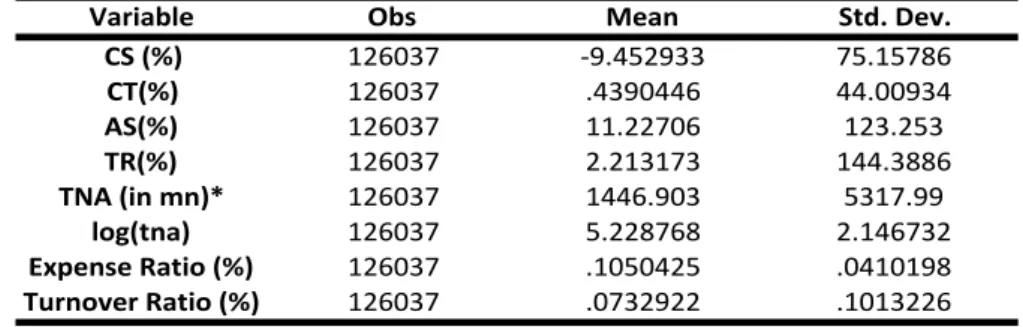
Table II- Summary of the variables in sample 2 (does not include dummy variables)
Variable Obs Mean Std. Dev.
CS (%) 126037 -9.452933 75.15786 CT(%) 126037 .4390446 44.00934 AS(%) 126037 11.22706 123.253 TR(%) 126037 2.213173 144.3886 TNA (in mn)* 126037 1446.903 5317.99 log(tna) 126037 5.228768 2.146732 Expense Ratio (%) 126037 .1050425 .0410198 Turnover Ratio (%) 126037 .0732922 .1013226
* Included in the analyis through the variable log(tna)
On average, the managers of the mutual funds under analysis are not able to choose stocks that present higher returns than the benchmark portfolio, as it can be concluded by the average monthly CS measure (see table I). In fact, the negative monthly characteristic component allows me to conclude that, on average, the managers chose stocks that underperform their benchmarks. However, they are able to invest in stocks with certain characteristics when those characteristics are the most profitable – the average monthly CT component is positive. The mean style (AS) component, which detects returns from funds systematically holding stocks with certain characteristics, is positive and accounts for most of the positive (on average) total performance of the funds, which is around 2%-3%. These conclusions are valid for both samples (see table II). The average monthly expense ratio of a fund is approximately 0,11% (in the two
samples), while the monthly turnover ratio is higher in the first case (0,08% vs. 0,07%). The second sample has a slightly larger average of total net assets, totaling 1.447 million. Finally the majority of funds (in the second analysis) have an investment objective of growth (866), while 246 funds have an investment objective of growth and income and 14624 have an investment objective of aggressive growth.
Table III- Results of 1st analysis (considering the broader sample)
CS CT AS TR -4,850 1,052* -4,578*** -8,376*** (-1,44) (1,71) (-3,52) (-2,69) 2,346** -0,345 -2,54*** -0,539 (2,4) (-1,55) (-4,23) (-0,55) 5,137** 0,279 -12,447*** -7,03** (2,12) (0,43) (-5,44) (-2,31) -0,704*** -0,096** 1,450*** 0,650*** (-3,41) (-2,00) (10,96) (3,24) 4,872 -5,993** 36,928*** 35,806*** (0,37) (-2,34) (4,99) (2,83) 22,962*** 1,783*** -3,379*** 21,365*** (4,57) (2,98) (-2,89) (4,20) *** Significant at a 1% level ** Significant at a 5% level *Significant at a 10% level T-Statistics in parenthesis Turnover Ratio (β6) Expense Ratio (β5) logtna (β4) Short & Lend (β3)
Lend (β2) Short (β1)
Table IV- Results from 2nd analysis (considering the smaller sample)
CS CT AS TR -7,796 0,682 -1,768 -8,883 (-1,21) (1,20) (-1,06) (-1,53) 3,751*** -0,524** -3,41*** -0,183 (2,73) (-2,12) (-4,61) (-0,14) 4,732 -0,164 -11,586*** -7,018 (1,18) (-0,17) (-5,07) (-1,60) -0,214 -0,179*** 0,915*** 0,522** (-0,76) (-2,92) (5,37) (1,99) 13,185 -9,343*** 17,817* 21,659 (0,63) (-2,85) (1,70) (1,13) 50,821* 3,199* -6,689** 47,331* (1,83) (1,69) (-2,34) (1,74) 7,224*** 0,182 1,013 8,419*** (2,70) (0,41) (0,94) (3,16) 1,475 -0,412 0,267 1,330 (0,91) (-1,63) (0,35) (0,96) *** Significant at a 1% level ** Significant at a 5% level *Significant at a 10% level T-Statistics in parenthesis Lend (β2) Short (β1) Growth (β8) Agressive Growth (β7) Expense Ratio (β5) Turnover Ratio (β6)
Short & Lend (β3)
logtna (β4)
24
As with the lending/short-sale strategies, the sample includes funds that alter their investment objective.
In both samples the use of short sales is not significant in the CS measure. Therefore, the fact that fund managers which use short-sales are exceedingly well informed (vs. those that do not) has no effect on the managers ability to choose stocks that outperform their benchmarks, when compared with managers that do not employ this strategy (it was expected to have a positive effect). On the other hand, the use of short-sales has a positive impact on the capacity of fund managers to time their investments in stocks with certain characteristics. The strategy has, however, a negative and significant impact (-5%, considering the first case) on the returns given by a manager holding systematically a position in a stock with certain characteristics, vis-a-vis with funds that do not short and lend. This adverse effect is due to the higher portfolio turnover of mutual funds that engage in short-sales, and justifies the negative impact on the total hypothetical return of the funds (when considering the largest sample). The use of short-sales is not significant for any of the variables in the second sample.
Lending securities to short-sellers is significant for all the performance components, in the second sample – on the first it is not significant for the CT returns. Since it has a positive effect (of around 2% in the first sample and 4% in the second) in the capacity of managers to present stock picking abilities, it is possible to conclude that lending securities is not a sign of worst managerial skill in choosing stocks (in comparison with the base group). This strategy has, however, and adverse impact on the characteristic timing (e.g. these managers are not able to time their investment in their characteristics) and on the average style returns. Lending is not significant for the total performance of the fund.
Engaging in both strategies has a positive effect on the characteristic selectivity component of a fund, (taken as contrast funds that do not employ neither of those
strategies), by increasing its returns in around 5% in the larger sample (it is not significant on the smaller). This positive impact is most likely due to the effect of lending securities on the CS metric. On the other hand, these strategies reduce the gains earned by a fund because of its tendency to hold stocks with certain characteristics, and it also negatively impacts the total return of the fund (in the first case). The strategies are not significant for the CT returns in both cases, and for the total return in the second sample.
The size of the fund, measured using the log of the total net assets, is significant and negative for the CS and CT components in the first analysis and significant and negative for the CT measure in the second sample. This effect can be attributed to the allocation of funds to the “not-so-great-ideas”, as a fund’s size grows. Being bigger has, nonetheless, a positive effect on the average style returns in both cases – most likely due to the lower turnover of bigger funds, in order to avoid trading costs. Additionally, size has a small (less than 100 basis points) but positive impact on the total return on the fund, due to the higher magnitude of the positive effect of size on the AS metric.
The expense ratio is not significant in the CS returns for both samples. However in the first sample it exhibits a significant and large effect (above 30% per 1% increase in the ratio) on the average style returns and total gross returns of the fund. I can infer that funds with higher expenses most likely have higher gross performance, because more funds are being directed towards research and market analysis. This allows managers to choose stocks/characteristics to invest systematically that outperform the benchmark. In the smaller sample it is significant and positive for the average style returns, but it is not significant for the total return. Moreover it has a negative impact on the characteristic timing returns of the funds of both samples.
The turnover ratio is a significant explanatory variable in both assessments, but it has different effects in the components. More trading increases the characteristic selectivity and timing components of the fund’s return, with the first result in line with expectations and the findings of Wermers (2000). It also has a significant positive impact (especially in the second case) on the total return of the fund. However, it has a contrary effect – decreasing returns in 3% (1st sample) and 7% (2nd) per increase of 1% in the ratio – when considering the average style returns. Not surprisingly, as a high-turnover fund will not systematically hold stocks with certain characteristics.
Lastly, and focusing only on the analysis of smaller sample which includes investment objectives, it can be inferred that an investment style of aggressive growth has a positive effect on the characteristic selectivity and total return of the fund (in comparison with funds with an investment style of growth and income), increasing those returns by 7% and 8% respectively. The latter is in line with Grinblatt et al. (1989). However funds with an investment style of growth are not significant for any of the DGTW performance measures.
V. Conclusion
Most of the literature regarding mutual fund performance is solely focused on funds with long positions. In addition, although the adaptation of the DGTW performance components has grown since their inception in 1997, analyses to how these components are influenced by “common performance impacting” variables is non existing. This work aims to fill both voids by analyzing how different strategies that just going long on a holding – e.g. using short-sales and lending securities – impacts those returns measures. Additionally, the effect of other common performance impacting variables,
such as expense and turnover ratios, size and investment objectives was also analyzed.
I found that (only) shorting/lending or engaging in both strategies has a negative impact on the returns due to a fund holding systematically stocks with certain characteristics – the AS returns. A fund lending its securities and engaging in both short sales and lending has a positive effect on the stock picking abilities of the fund’s managers, and managers that lend their holdings do not exhibit worse stock picking abilities. Furthermore, shorting and both shorting and lending have an adverse impact on the total performance. Lastly, size, expenses, turnover and an aggressive investment style have a positive effect on the performance of the fund. The two last are, in fact, the most “impactful” on the total return of the funds (considering the second sample).
Bibliography
Brown, S. J., Goetzmann, W., Ibbotson, R. G., Ross, S. A.(1992). “Survivorship bias in performance studies”. The Review of Financial Studies Vol. 5(4): 553–580.
Carhart, M. M.(1997). “On persistence in mutual fund performance”. The Journal of
Finance Vol. 52(1):57–82.
Chan, L. K. C., Stephen, G. D., Lakonishok, J.(2009). “Benchmarking money manager performance: issues and evidence”. Review of Financial Studies 22: 4553–4599.
Chen, H.L., Jegadeesh, N., Wermers., R. (2000). “The Value of Active Mutual Fund Management: An Examination of the Stockholdings and Trades of Mutual Fund Managers.” Journal of Financial and Quantitative Analysis, Vol. 35: 343–368.
Chen, H., Desai, H., & Krishnamurthy, S. (2013). “A First Look at Mutual Funds that Use Short Sales.” Journal of Financial and Quantitative Analysis.
Chen, J., Hong, H., Huang, M., Kubik, J.D. (2004). “Does Fund Size Erode Mutual Fund Performance? The Role of Liquidity and Organization”. The American Economic
Review Vol.94 (5): 1277 – 1302.
Daniel, K., Grinblatt, M., Titman, S., Wermers, R (1997). “Measuring Mutual Fund Performance with Characteristic-Based Benchmarks.”Journal of Finance,LII (3). Evans, R., Ferreira, M. A., & Prado, M. P. (2013). “Equity Lending, Investment Restrictions and Fund Performance. ”
Fama, E.F. , & French, K.R. (1992). “The Cross-Section of Expected Stock Returns.”
The Journal of Finance, Vol. XLVII(2): 427 – 465.
Fama, E. F., & French, K. R. (2010). “Luck versus Skill in the Cross-Section of Mutual Fund Returns.” The Journal of Finance , LXV (5).
Grinblatt, M., Titman, S.(1989). “Mutual fund performance: An analysis of quarterly portfolio holdings.” The Journal of Business, 62(3): 393 – 416.
Grinblatt, M., Titman, S. (1992). “The persistence of mutual fund performance”. The
Journal of Finance, Vol. 47(5):1977 – 1984.
Hendricks, D., Patel, J., & Zeckhauser, R.(1993). “Hot hands in mutual funds: Short-run persistence of relative performance 1974 – 1988”. The Journal of Finance Vol.
48(1): 93–130.
Jegaseesh, N., Titman, S. (1993). “Returns to Buying Winners and Selling Losers: Implications for Stock Market Efficiency.” The Journal of Finance. Vol. XLVIII (1): 65 – 91.
Jensen, M. C. (1967). “The performance of mutual funds in the period 1945-1964.”
Journal of Finance, Vol. 23 (2): 389 – 416.
Kothari, S. P., & Warner, J. B. (2001). “Evaluating Mutual Fund Performance.” The
Journal of Finance , LVI (5).
Lin, X., Zhang, L. (2011). “Covariances versus characteristics in general equilibrium”.
Meier, I., Schaumburg, E. (2006). “Do funds window dress? Evidence for U.S. Domestic equity mutual funds”. Working paper, Northwestern University.
Perold, A., Salomon, R. S. (1991). “The Right Amount of Assets under Management.”
Financial Analysts Journal, Vol. 47(3): 31 – 39.
Sharpe, William F., (1966). Mutual fund performance. The Journal of Business, Vol.
39(1): 119 – 138.
Wermers, R. (1997). “Momentum Investment Strategies of Mutual Funds, Performance Persistence, and Survivorship Bias”. Working paper, University of Maryland.
Wermers, R. (2000). “Mutual Fund Performance: An Empirical Decomposition into Stock-Picking Talent, Style, Transactions Costs, and Expenses”. The Journal of
Finance, LV (4).
Wermers, R. (2004). “Is money really smart? New evidence on the relation between mutual fund flows, manager behavior, and performance persistence”. Working paper,
University of Maryland.
Wermers, R. (2006). “Performance Evaluation with portfolio holdings information”.
The North American Journal of Economics and Finance, Vol.17: 207-230.
Wermers, R., Scaillet, O., & Barras, L. (2010). “False Discoveries in Mutual Fund Performance: Measuring Luck in Estimated Alphas.” The Journal of Finance , LXV (1).
Attachments
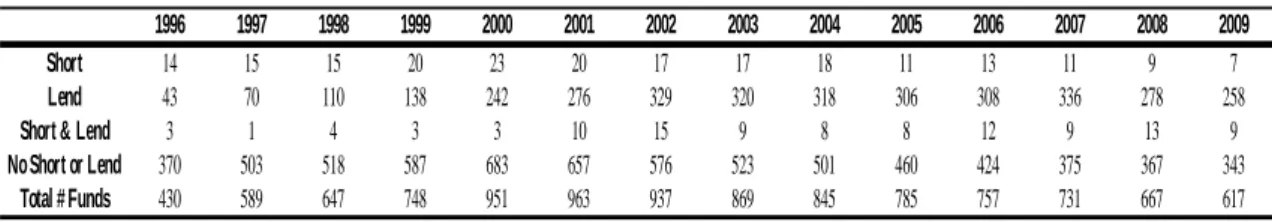
Table V – Summary of Short/Lending Strategies per year (for the 1st sample)
Table VI – Summary of Short/Lending Strategies per year (for the 2nd sample)
Attachment VII - Short Sales & Lending: a brief analysis
If one looks at the evolution of the lending and short selling practices of mutual funds that report to the Securities and Exchange Commission (SEC)25 it concludes that both strategies have paved different paths. While the percentage of funds that lend their securities has increased significantly during the 13 years in analysis (from 11% to 38%), the percentage of funds that use short-sales has remained flat at 4%. Both strategies have been increasingly allowed by funds, with lending increasing from 73% to 87%, and the percentage of funds that allow short-sales nearly doubling, from 31% to 60%. I can infer, from the numbers above, that the lack of growth in the percentage of funds that use short-sales is not because funds are not allowed to employ them, but because their managers choose not to engage in short-sale strategies. This is most likely due to the restrictions imposed by the SEC, which considers that short selling is similar to
25 This analysis will be performed taking into consideration the data from the SEC fillings. The restrictions imposed on the previous analysis (investment objectives, size, etc.) are not applicable in this, as this only looks at the evolution of the adaptation of short-sales and lending strategies by US mutual funds.
1996 1997 1998 1999 2000 2001 2002 2003 2004 2005 2006 2007 2008 2009
Short 14 15 17 24 31 36 43 40 42 30 34 33 28 30
Lend 43 70 111 161 284 361 468 457 486 489 524 578 492 427
Short & Lend 3 1 4 3 3 13 20 17 16 17 23 24 26 13
No Short or Lend 373 503 525 652 862 967 895 868 857 834 788 742 696 650 Total # Funds 433 589 657 840 1180 1377 1426 1382 1401 1370 1369 1377 1242 1120
1996 1997 1998 1999 2000 2001 2002 2003 2004 2005 2006 2007 2008 2009
Short 14 15 15 20 23 20 17 17 18 11 13 11 9 7
Lend 43 70 110 138 242 276 329 320 318 306 308 336 278 258
Short & Lend 3 1 4 3 3 10 15 9 8 8 12 9 13 9
No Short or Lend 370 503 518 587 683 657 576 523 501 460 424 375 367 343 Total # Funds 430 589 647 748 951 963 937 869 845 785 757 731 667 617
using leverage, and thus regulates this practice by funds under the same conditions as the use of leverage or senior securities26. Therefore in the beginning, funds were obliged to maintain an asset coverage of a minimum of 300% – the fund’s net assets plus the market value of the securities that are shorted must be at least 300% of the latter – or place adequate liquid assets (cash, US Securities and high grade debt) in segregated accounts to undo or cleanse the effects of leveraging. Nowadays, this requirement has been relaxed with funds only being required to hold in the segregated account an amount enough to cover the market value of the security being sold short and with other assets (e.g. stocks) being accepted on the segregated account.
Although lending practices are also regulated by the SEC, these requirements are less restrictive than those of short-sales – i.e. funds can lend no more than one third of its total value; must disclose the lending practices to shareholders; and receive 100% collateral in exchange for the lent holdings, etc27. These less restrictive rules, coupled with the inability of many fund managers to act upon the short-selling signal due to fund family restrictions, justifies the increasing adaptation of lending as a additional source of income for fund.
26
Section 18 of the SEC Act.
27