EUROPEAN ORGANIZATION FOR NUCLEAR RESEARCH (CERN)
CERN-PH-EP/2013-149 2014/02/27
CMS-SMP-12-002
Measurement of associated W + charm production in pp
collisions at
√
s
=
7 TeV
The CMS Collaboration
∗Abstract
Measurements are presented of the associated production of a W boson and a charm-quark jet (W + c) in pp collisions at a center-of-mass energy of 7 TeV. The analy-sis is conducted with a data sample corresponding to a total integrated luminos-ity of 5 fb−1, collected by the CMS detector at the LHC. W boson candidates are identified by their decay into a charged lepton (muon or electron) and a neutrino. The W + c measurements are performed for charm-quark jets in the kinematic re-gion pjetT > 25 GeV, |ηjet| < 2.5, for two different thresholds for the transverse mo-mentum of the lepton from the W-boson decay, and in the pseudorapidity range
|η`| < 2.1. Hadronic and inclusive semileptonic decays of charm hadrons are used to measure the following total cross sections: σ(pp → W+c+X) × B(W → `ν) = 107.7±3.3 (stat.)±6.9 (syst.) pb (p`T > 25 GeV) and σ(pp → W+c+X) ×
B(W → `ν) = 84.1±2.0 (stat.)±4.9 (syst.) pb (p`T > 35 GeV), and the cross sec-tion ratios σ(pp → W++c+X)/σ(pp → W−+c+X) = 0.954±0.025 (stat.)±
0.004 (syst.) (p`T > 25 GeV) and σ(pp → W++c+X)/σ(pp → W−+c+X) =
0.938±0.019 (stat.)±0.006 (syst.) (pT` > 35 GeV). Cross sections and cross section ratios are also measured differentially with respect to the absolute value of the pseu-dorapidity of the lepton from the W-boson decay. These are the first measurements from the LHC directly sensitive to the strange quark and antiquark content of the proton. Results are compared with theoretical predictions and are consistent with the predictions based on global fits of parton distribution functions.
Published in the Journal of High Energy Physics as doi:10.1009/JHEP02(2014)013.
c
2014 CERN for the benefit of the CMS Collaboration. CC-BY-3.0 license ∗See Appendix B for the list of collaboration members
1
1
Introduction
The study of associated production of a W boson and a charm (c) quark at hadron colliders (hereafter referred to as W+c production) provides direct access to the strange-quark content of the proton at an energy scale of the order of the W-boson mass (Q2∼(100 GeV)2)[1–3]. This sensitivity is due to the dominance of sg→W−+c and sg→W++c contributions at the hard-scattering level (Fig. 1). Recent work [4] indicates that precise measurements of this process at the Large Hadron Collider (LHC) may significantly reduce the uncertainties in the strange quark and antiquark parton distribution functions (PDFs) and help resolve existing ambiguities and limitations of low-energy neutrino deep-inelastic scattering (DIS) data [5]. More precise knowledge of the PDFs is essential for many present and future precision analyses, such as the measurement of the W-boson mass [6]. An asymmetry between the strange quark and antiquark PDFs has also been proposed as an explanation of the NuTeV anomaly [5], making it crucial to measure observables related to this asymmetry with high precision.
W+c production receives contributions at a few percent level from the processes dg→W−+c and dg → W++c, which are Cabibbo suppressed [7]. Overall, the W−+c yield is expected to be slightly larger than the W++c yield at the LHC because of the participation of down valence quarks in the initial state. A key property of the qg → W+c reaction is the presence of a charm quark and a W boson with opposite-sign charges.
s ,
c
c
_g
W
d
_s ,
c
c
_g
W
+
_d
_Figure 1: Main diagrams at the hard-scattering level for associated W + c production at the LHC.
The pp → W+c+X process is a sizable background for signals involving bottom or top quarks and missing transverse energy in the final state. Particularly relevant cases are top-quark studies and third-generation stop-quark searches. Measurements of the pp → W+c+X cross section and of the cross section ratio σ(pp→W+c-jet+X)/σ(pp→W+jets+X)have been performed with a relative precision of about 20–30% at the Tevatron [8–10] hadron collider using semileptonic charm hadron decays.
We present a detailed study of the pp→W+c+X process with the Compact Muon Solenoid (CMS) detector, using a data sample corresponding to a total integrated luminosity of 5 fb−1 collected in 2011 at a center-of-mass energy of 7 TeV. We measure the total cross section and the cross section ratio R±c = σ(W++c)/σ(W−+c)using the muon and electron decay chan-nels of the W boson. Charm-quark jets are identified within the fiducial region of transverse momentum pjetT > 25 GeV and pseudorapidity|ηjet| < 2.5 using exclusive hadronic, inclusive hadronic, and semileptonic decays of charm hadrons. Furthermore, the cross section and the R±c ratio are measured as a function of the pseudorapidity of the lepton from the W decay, thus probing a wide range in the Bjorken x variable, which at leading order can be interpreted as the momentum fraction of the proton carried by the interacting parton.
2 3 Analysis strategy
general analysis strategy is outlined in Section 3. The samples used to carry out the measure-ment and the event selection criteria are presented in Sections 4 and 5. Section 6 details the measurement of the total cross section and Sections 7 and 8 are devoted to studies of the differ-ential cross section and the charge ratio. Results and comparisons with theoretical predictions are discussed in Section 9. Finally, we summarize the results of this paper in Section 10.
2
CMS detector
The central feature of the CMS apparatus is a superconducting solenoid of 6 m internal di-ameter, providing a magnetic field of 3.8 T. Within the field volume are a silicon pixel and strip tracker, an electromagnetic calorimeter (ECAL), and a brass/scintillator hadron calorime-ter (HCAL). Muons are detected in gas-ionization detectors embedded in the steel flux return yoke of the magnet.
The CMS experiment uses a right-handed coordinate system with the origin at the nominal interaction point, the x axis pointing to the center of the LHC ring, the y axis pointing up (perpendicular to the LHC plane), and the z axis along the anticlockwise-beam direction. The polar angle θ is measured from the positive z axis and the azimuthal angle φ is measured in the x-y plane. The pseudorapidity is given by η = −ln(tan(θ/2)).
The tracker measures charged-particle trajectories in the pseudorapidity range |η| ≤ 2.5. It consists of 1440 silicon pixel and 15 148 silicon strip detector modules. It provides an impact parameter resolution of 15 µm and a transverse momentum (pT) resolution of about 1% for
charged particles with pT around 40 GeV. The ECAL consists of nearly 76 000 lead tungstate
crystals, which provide coverage in pseudorapidity|η| ≤ 1.479 in a cylindrical barrel region and 1.479 ≤ |η| ≤ 3.0 in two endcap regions (EE). A preshower detector, consisting of two planes of silicon sensors interleaved with a total of three radiation lengths of lead, is located in front of the EE. The ECAL has an ultimate energy resolution of better than 0.5% for unconverted photons with transverse energies (ET) above 100 GeV. The energy resolution is 3% or better for
the range of electron energies relevant for this analysis. The HCAL is a sampling device with brass as passive material and scintillator as active material. The combined calorimeter cells are grouped in projective towers of granularity∆η×∆φ = 0.087×0.087 at central rapidities and 0.175×0.175 at forward rapidities. Muons are detected in the pseudorapidity range|η| ≤ 2.4, with detection planes based on three technologies: drift tubes, cathode strip chambers, and resistive-plate chambers. A high-pTmuon originating from the interaction point produces track
segments in typically three or four muon stations. Matching these segments to tracks measured in the inner tracker results in a pT resolution between 1% and 2% for pTvalues up to 100 GeV.
The first level of the CMS trigger system, composed of custom hardware processors, is designed to select the most interesting events in less than 1 µs using information from the calorimeters and muon detectors. The high-level trigger processor farm further decreases the event rate to a few hundred hertz before data storage. A more detailed description of CMS can be found elsewhere [11].
3
Analysis strategy
We study W+c associated production in final states containing a W → `ν decay (where` = µ or e) and a leading jet with charm-quark content. Jets originating from a c (c) parton are identified using one of the three following signatures: a displaced secondary vertex with three tracks and an invariant mass consistent with a D+ → K−π+π+ (D− → K+π−π−) decay; a displaced secondary vertex with two tracks consistent with a D0 → K−π+ ( ¯D0 → K+π−)
3
decay and associated with a previous D∗+(2010) → D0π+(D∗−(2010) →D¯0π−) decay at the primary vertex; or a semileptonic decay leading to a well-identified muon. In total, since both electron and muon channels are considered in the W-boson decay, six different final states are explored.
The D±, D∗±(2010), and c→ `ν+X decays provide a direct measurement of the charm-quark jet charge, which is a powerful tool to disentangle the W+c signal component from most of the background processes. We define two types of distributions: opposite-sign distributions, denoted by OS, are built on samples containing a W boson and a charm-quark jet with an opposite-charge sign; same-sign distributions, denoted by SS, are built from samples where the W boson and the charm-quark jet have the same charge sign. The final distributions used in the analysis are obtained by subtracting the SS distribution from the OS distribution (re-ferred to as OS−SS) for any given variable. This subtraction has no effect on the signal at leading order. In contrast, W+cc and W+bb events provide the same OS and SS contribu-tions and are suppressed in OS−SS distributions. Moreover, any OS−SS asymmetry present in tt, single-top-quark, or W+light-quark jet backgrounds is found to be negligible according to simulations. As a consequence, OS−SS distributions are largely dominated by the W+c component, allowing for many detailed studies of the pp→W+c+X process.
Using displaced secondary vertices is a simple way to suppress backgrounds, such as Drell– Yan events, W+light-quark jet, and multijet final states with no heavy-flavour content. It also reduces backgrounds containing b-hadron decays, which often lead to secondary vertices with a higher track multiplicity than a typical D-meson decay.
The sample containing semileptonic charm decays is complementary; it is a larger data sample but is more affected by backgrounds, in particular Drell–Yan events. Exclusive identification of D± and D∗±(2010)final states allows for a precise accounting of systematic uncertainties in charm branching fractions and acceptances for cross section measurements. However, only charge identification is strictly required for studies that are independent of the overall W+
c normalization, such as relative differential measurements or measurements of the σ(W++
c)/σ(W−+c)ratio.
In order to improve the statistical precision, we also employ inclusive selections of charm hadron decays, i.e. without requiring the identification of the full final state, thus allowing for decays with one or more neutral particles. Inclusive samples of events with three-track and two-track secondary vertices are selected by loosening the invariant mass constraints. Even with these relaxed criteria, simulations predict that the background contributions to the OS−SS subtracted distributions in these inclusive samples are small compared with the signal yield.
4
Data and Monte Carlo samples and signal definition
The analysis reported in this paper was performed with a data sample of proton-proton col-lisions at √s = 7 TeV collected with the CMS detector in 2011. A detailed data certification process [12] guarantees that the data set available for analysis, corresponding to an integrated luminosity L = 5.0±0.1 fb−1, fulfills the quality requirements for all detectors used in this analysis. Candidate events for the muon decay channel of the W boson are selected online by a single-muon trigger that requires a reconstructed muon with pT >24 GeV. Candidate events
for the electron channel are selected by a variety of electron triggers. Trigger conditions were tightened throughout the 2011 data run to cope with the increasing instantaneous luminosity of the LHC collider. Most of the data used in this analysis are selected by requiring an electron
4 4 Data and Monte Carlo samples and signal definition
candidate with transverse energy ET >32 GeV.
Muon and electron candidates are reconstructed following standard CMS algorithms [13, 14]. Jets, missing transverse energy, and related quantities are computed using particle-flow tech-niques [15] in which a full reconstruction of the event is developed from the individual particle signals in the different subdetectors. Jets are reconstructed from the particle-flow candidates using an anti-kT clustering algorithm [16] with a distance parameter of 0.5. Charged
parti-cles with tracks not originating at the primary vertex are not considered for the jet clustering, and the extra energy clustered in jets from the presence of additional pp interactions (pileup events) is subtracted from the jet energy [17, 18]. Finally, energy corrections derived from data and simulated samples are applied to correct for η and pTdependent detector effects [19].
Large samples of events simulated with Monte Carlo (MC) techniques are used to evaluate signal and background efficiencies. The W-boson signal (W → µν and W → eν) as well as other electroweak processes (such as Z → µµ, Z → ee, W → τν, and Z → ττ production) are generated with the MADGRAPH[20] (v5.1.1) event generator, interfaced to thePYTHIA[21] (v6.4.24) program for parton shower simulation. The MADGRAPHgenerator produces parton-level events with a vector boson and up to four partons in the final state on the basis of matrix element calculations. It has been shown to reproduce successfully the observed jet multiplicity and kinematic properties of W+jets final states at the LHC energy regime [22]. The match-ing matrix element/parton shower scale m2 is equal to (10 GeV)2 and the factorization and
renormalization scales are set to Q2 = M2W/Z+p2T,W/Z. Constraints on the phase space at the generator level are not imposed, except for the condition M`` > 10 GeV in the case of Z(γ∗) production.
Potential backgrounds in this analysis come from tt and single-top-quark production. A sample of tt events is generated with the MADGRAPH generator interfaced to PYTHIA.
Single-top-quark events are generated in the t-channel, s-channel, and tW associated modes with the next-to-leading-order (NLO) generatorPOWHEG [23] (v1.0), interfaced with PYTHIA. The PDF set used in thesePOWHEGproductions is CT10 [24]. We also consider the small contributions from diboson (WW, WZ, ZZ) events and quantum chromodynamics (QCD) multijet events using
PYTHIA. All leading-order (LO) generations use the CTEQ6L1 PDF set [25] with parameters set for the underlying event according to the Z2 tune [26].
Cross sections for single W and Z production processes are normalized to the predictions from
FEWZ [27] evaluated at next-to-next-to-leading order (NNLO) using the MSTW08NNLO [28]
PDF set. The tt cross section is taken at NNLO from Ref. [29]. For the rest of the processes, cross sections are normalized to the NLO cross section predictions fromMCFM[30] using the MSTW08NLO PDF set. The QCD multijet cross section is evaluated at LO.
Several minimum-bias interactions, as expected from the projected running conditions of the accelerator, are superimposed on the hard scattering to simulate the real experimental condi-tions of multiple pp collisions occurring simultaneously. To reach an optimal agreement with the experimental data, the simulated distributions are reweighted according to the actual num-ber of interactions (an average of nine) occurring given the instantaneous luminosity for each bunch crossing. Generated events are processed through the full GEANT4 [31] detector simu-lation, trigger emusimu-lation, and event reconstruction chain of the CMS experiment. Predictions derived from the MC-simulated samples are normalized to the integrated luminosity of the data sample.
At the hard-scattering level we identify W+c signal events as those containing an odd number of charm partons in the final state. This choice provides a simple operational definition of the
5
process and ensures that pure QCD splittings of the g→cc type are associated with the back-ground. Events containing b quarks in the final state are always classified as W+b+X in order to correctly identify b→c decays. The W+c signal reference is defined at the hard-scattering level of MADGRAPH, which provides an implicit parton-jet matching for a jet separation
pa-rameter of R=
q
(∆η)2+ (∆φ)2=1 that is suitable for comparisons with the NLO theoretical predictions of MCFM at the .1% level. The phase space definition at the generator level is chosen in order to approximately match the experimental selections used in the analysis. For charm partons we require pcT >25 GeV,|ηc| <2.5. Differential measurements are performed as a function of the absolute value of the lepton pseudorapidity|η`|, whereas total cross sections and average ratios require|η`| <2.1. Potential dependencies on the center-of-mass energy of the hard scattering process are explored by considering two different transverse momentum thresholds for the charged leptons from the W-boson decay: p`T > 25 GeV and p`T > 35 GeV. The p`T >25 GeV case is analyzed in the W→µνchannel only.
5
Event selection
The selection of W-boson candidates closely follows the criteria used in the analysis of inclu-sive W → µνand W → eν production [32]. The leptonic decay of a W boson into a muon or an electron, and a neutrino is characterized by the presence of a high-transverse momentum, isolated lepton. The neutrino escapes detection causing an apparent imbalance in the trans-verse energy of the event. Experimentally, the magnitude of the vector momentum imbalance in the plane perpendicular to the beam direction defines the missing transverse energy of an event, EmissT . In W-boson events, this variable is an estimator of the transverse energy of the undetected neutrino.
Muon tracks are required to have a transverse momentum pTµ > 25 GeV and to be measured in the pseudorapidity range|ηµ| < 2.1. A muon isolation variable, Irelµ , is defined as the sum of the transverse energies of neutral particles and momenta of charged particles (except for the muon itself) in a ∆R =
q
(∆η)2+ (∆φ)2 = 0.4 cone around the direction of the muon, and normalized to the muon transverse momentum. The muon is required to be isolated from any other detector activity according to the criterion Irelµ <0.12.
Electron candidates with peT >35 GeV are accepted in the pseudorapidity range|ηe| <2.1 with the exception of the region 1.44 < |ηe| < 1.57 where service infrastructure for the detector is located, thus degrading the performance. The electron isolation variable, Irele , is defined as the sum of the transverse components of ECAL and HCAL energy deposits (excluding the footprint of the electron candidate) and transverse momenta of tracks reconstructed in the inner tracker in a∆R=0.3 cone around the electron direction, and normalized to the electron pT. An
isolated electron must satisfy Irele <0.05.
The background arising from Drell–Yan processes is reduced by removing events containing additional muons (electrons) with p`T > 25 (20)GeV in the pseudorapidity region|ηµ| < 2.4 (|ηe| <2.5). Finally, the reconstructed transverse mass, MT, which is built from the transverse
momentum of the isolated lepton, p`T, and the missing transverse energy in the event, MT ≡
√
2 pT` EmissT [1−cos(φ`−φEmiss
T )], where φ` and φEmissT are the azimuthal angles of the lepton
and the EmissT vector, must be large. In the muon channel, MTmust be greater than 40 GeV. A
higher threshold is set in the electron channel, MT >55 GeV, since a condition on this variable
(MT >50 GeV) is already included in the online trigger selection. This requirement reduces the
6 5 Event selection
in the electron channel is estimated from the experimental ETmissdistribution. It is found to be negligible after subtraction of the SS component.
A W+jets sample is selected by demanding the presence of at least one jet with pjetT >25 GeV in the pseudorapidity range|ηjet| < 2.5, thus ensuring that the jet passes through the tracker volume, and hence achieving the best possible jet pTresolution. A W+c candidate sample is
further selected by searching for a distinct signature of a charmed particle decay among the constituents of the leading jet associated with the W boson, as introduced in Section 3. For that purpose, events with a secondary vertex consistent with the decay of a relatively long-lived quark are kept. Secondary vertices are reconstructed using an adaptive vertex finder [33] algorithm with well understood performance [34]. This algorithm is stable with respect to alignment uncertainties and is an essential component of the vertex-based b-tagging algorithms used in the CMS experiment. In its default implementation, used in this analysis, tracks within a∆R = 0.3 cone around the jet axis, that have a transverse momentum larger than 1 GeV and a probability of originating from the primary vertex below 50% are considered to come from a secondary vertex. Finally, only secondary vertices with a transverse decay length significance with respect to the primary vertex position larger than 3 are kept.
A search for D±and D0charm meson decays is carried out in those events having reconstructed
secondary vertices with three or two tracks, respectively. In addition, a W+c candidate sample with the charm quark decaying semileptonically is selected from the events with an identified muon among the particles constituting the jet. These samples are described in more detail in the following subsections.
5.1 Selection of exclusive D±decays
We identify D± → K∓π±π± decays in the selected W+jets sample using secondary ver-tices with three tracks and a reconstructed invariant mass within 50 MeV of the D± mass, 1869.5±0.4 MeV [35]. The kaon mass is assigned to the track that has opposite sign to the total charge of the three-prong vertex and the remaining tracks are assumed to have the mass of a charged pion. This assignment is correct in more than 99% of the cases, since the fraction of double Cabibbo-suppressed decays is very small:B(D+ →K+π+π−)/B(D+ →K−π+π+) = 0.00577±0.00022 [35].
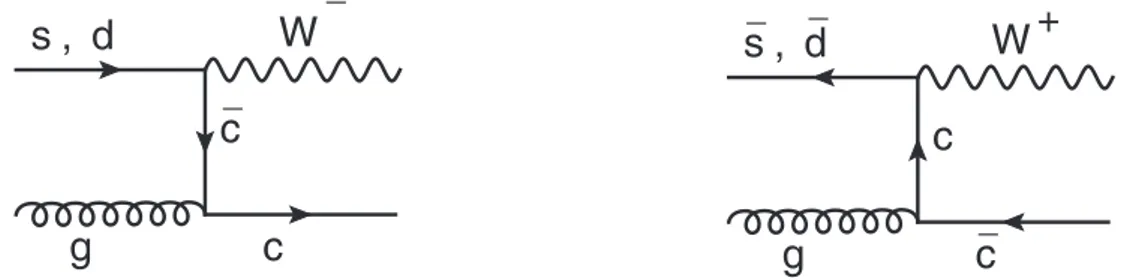
Figure 2 shows the OS−SS distributions of the reconstructed invariant mass for D±candidates associated with W → µν and W → eν decays. It is compared with the predictions obtained from the simulated MC samples. We distinguish two different contributions in the W+c pre-diction. A resonant W+c component is composed of those events with a D±meson decaying into the K∓π±π±final state at generator level; it is visible as a clear peak around the D±mass in Fig. 2. A nonresonant component arises from W+c events where the charm meson decays to any final state other than K∓π±π±. The reconstructed invariant mass distribution in this case extends as a continuum over the whole spectrum. The distribution presented in Fig. 2 is al-most exclusively populated by W+c events. The contribution from the non-(W+c) processes introduced in Section 4 is shown as part of the background.
The MC prediction for the D± signal is scaled by the ratio of the branching fractions B(c →
D±→K∓π±π±)used in the simulation and measured experimentally. The branching fraction used in the PYTHIAsimulation,(1.528±0.008)%, is about 25% smaller than the experimental measurement,(2.08±0.10)%. This value is the combination of three measurements performed at LEP [36–38] of this branching fraction times the relative partial decay width of the Z boson into charm-quark pairs, Rc = Γ(Z→cc)/Γ(Z→hadrons). The original LEP measurements
5.2 Selection of exclusiveD∗±(2010)decays 7
Secondary vertex mass [GeV]
1.6 1.8 2 2.2
(OS-SS) events / 0.012 GeV
0 200 400 600 Data W+c resonant W+c non-resonant Background fit ± π ± π ± K → ± D > 25 GeV µ T p M [GeV]: 1.868 ± 0.001 [MeV]: σ 15.85 ± 0.90 = 7 TeV s at -1 L = 5.0 fb CMS
Secondary vertex mass [GeV]
1.6 1.8 2 2.2
(OS-SS) events / 0.012 GeV
0 100 200 300 Data W+c resonant W+c non-resonant Background fit ± π ± π ± K → ± D > 35 GeV e T p M [GeV]: 1.868 ± 0.001 [MeV]: σ 19.2 ± 1.3 = 7 TeV s at -1 L = 5.0 fb CMS
Figure 2: The invariant mass distribution of three-prong secondary vertices in data, after sub-traction of the SS component. The position and width of the resonance peak are in reasonable agreement with the MC expectations (only statistical uncertainties are quoted). The channels shown correspond to muon and electron decay channels of the W boson with pTµ > 25 GeV (left) and peT > 35 GeV (right). The different contributions shown in the plot are described in the text. Note that the amount of non-(W+c) background predicted by the simulation is almost negligible.
combination of these three experiments, we have assumed that experimental systematic un-certainties are uncorrelated among the measurements, given the substantially different sources of uncertainty considered by each experiment, whereas the experimental uncertainty in Rc is
propagated in a correlated way. Agreement between data and predictions is reasonable, al-though a small signal excess over the predictions (of about 10%) is visible in Fig. 2.
For illustration purposes, the sum of a Gaussian function to describe the signal plus a second-degree polynomial for the nonresonant background is fitted to the data distribution. The PDG value of the D±mass is reproduced precisely in all cases.
5.2 Selection of exclusive D∗±
(
2010)
decaysThe first step in the identification of D∗+(2010) → D0π+ (D∗−(2010) → D¯0π−) decays is the selection of a secondary vertex with two tracks of opposite charge, as expected from a D0 →
K−π+( ¯D0 → K+π−) decay. This two-track system is combined with a primary track having pT >0.3 GeV found in a cone of∆R=0.1 around the direction of the D0candidate momentum.
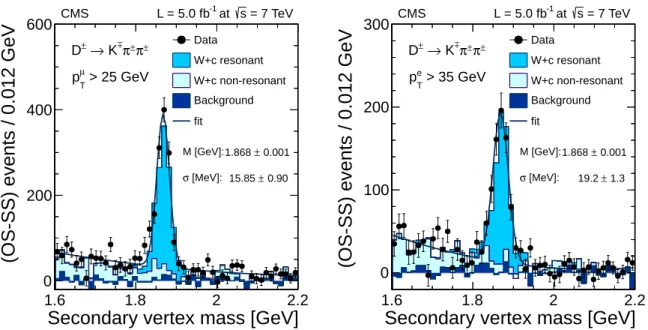
The secondary track with charge opposite to the charge of the primary track is assumed to be the kaon in the D0 decay. Only combinations with a reconstructed mass differing from the D0 mass (1864.86±0.13 MeV [35]) by less than 70 MeV are kept. The D∗±(2010)signal is identified as a peak in the distribution of the difference between the reconstructed D∗±(2010) and D0 masses near the expected value, mrec(D∗±(2010)) −mrec(D0) =145.421±0.010 MeV [35]. The OS−SS distribution of the reconstructed mass difference mrec(D∗±(2010)) −mrec(D0) is
shown in Fig. 3. Both W → µν and W → eν decays are considered, with transverse mo-mentum requirements of pµT > 25 GeV and peT > 35 GeV. The resonant W+c component is
8 5 Event selection
composed here of those events with a D∗±(2010)meson decaying into the D0π+; D0 →K−π+ ( ¯D0π−; ¯D0 →K+π−) final state at generator level; it is visible as a clear peak around the nom-inal mass difference mrec(D∗±(2010)) −mrec(D0)in Fig. 3. The nonresonant component comes from W+c events where the charm meson decays to any final state other than D0π+; D0 →
K−π+( ¯D0π−; ¯D0 →K+π−). Note that the amount of background predicted by the simulation, and also observed in data, is extremely small.
Mass difference [GeV]
0.14 0.15 0.16 0.17
(OS-SS) events / 0.02 GeV
0 50 100 150 200 250 Data W+c resonant W+c non-resonant Background ± π ± K → 0 ; D ± π 0 D → ± D* > 25 GeV µ T p = 7 TeV s at -1 L = 5.0 fb CMS
Mass difference [GeV]
0.14 0.15 0.16 0.17
(OS-SS) events / 0.02 GeV
0 50 100 Data W+c resonant W+c non-resonant Background ± π ± K → 0 ; D ± π 0 D → ± D* > 35 GeV e T p = 7 TeV s at -1 L = 5.0 fb CMS
Figure 3: Distribution of the reconstructed mass difference between D∗±(2010)and D0
candi-dates in the selected W+c sample, after subtraction of the SS component. The position and width of the peak near 145 MeV are in agreement with the MC expectations. The different con-tributions shown in the plot are described in the text. The channels shown correspond to muon and electron decay channels of the W boson with pµT >25 GeV (left) and peT >35 GeV (right).
The MC prediction for the full D∗±(2010)decay chain is scaled by the ratio between the product of the branching fraction for the decay chainB(c → D∗+(2010)) × B(D∗+(2010) → D0π+) ×
B(D0 → K−π+) used in the simulation and the experimental measurement. The product of the branching fractions used in thePYTHIA simulation is (0.743±0.005)%, which is about 20% larger than our estimation of the experimental value, (0.622±0.020)%. The latter num-ber is a weighted average that uses as inputs the dedicated measurements of this product times Rcby ALEPH [37] and OPAL [39], as well as the measurement of B(c → D∗+(2010)) ×
B(D∗+(2010) → D0π+)by DELPHI [40]. To obtain the charm fractions needed for the W+c cross section normalization, the ALEPH [37] and OPAL [39] measurements are divided by the world-average Rc experimental value and the DELPHI [40] measurement is multiplied by the
world-averageB(D0 → K−π+) = 0.0388±0.0005, both taken from the PDG [35]. Also in this case, experimental systematic uncertainties are assumed to be uncorrelated among the three LEP measurements and the experimental uncertainty in Rcis propagated in a correlated way.
A small excess of data over the theoretical predictions is also observed in this channel.
5.3 Selection of semileptonic charm decays
In addition to the previous exclusive channels, we consider the identification of charm-quark jets via semileptonic decays of the c quark. Only jets containing semileptonic decays into
5.3 Selection of semileptonic charm decays 9
muons are considered. Muons in jets are identified with the same criteria used for muon identi-fication in W-boson decays, with the exception that the isolation requirements are not applied. Since the OS−SS strategy effectively suppresses all backgrounds except Drell–Yan processes, additional requirements are applied in order to reduce the Drell–Yan contamination to man-ageable levels without affecting the signal in an appreciable way. We require pµT < 25 GeV, pµ
T/p jet
T < 0.6, and prelT < 2.5 GeV, where p
µ
T denotes here the transverse momentum of the
muon identified inside the jet and prelT is its transverse momentum with respect to the jet direc-tion. We also require the invariant mass of the dilepton system to be above 12 GeV, in order to avoid the region of low-mass resonances. Finally, dimuon events with an invariant mass above 85 GeV are rejected. The latter requirement is not applied to the sample with W-boson decays into electrons, which is minimally affected by high-mass dilepton contamination.
For the input semileptonic branching fraction of charm-quark jets, we employ the valueB(c→ `) = 0.091±0.005, which is the average of the inclusive value, 0.096±0.004 [35], and of the exclusive sum of the individual contributions from all weakly decaying charm hadrons, 0.086±
0.004 [35, 41]. The uncertainty is increased in order to cover both central values within one standard deviation. This value is consistent with thePYTHIAvalue present in our simulations (9.3%).
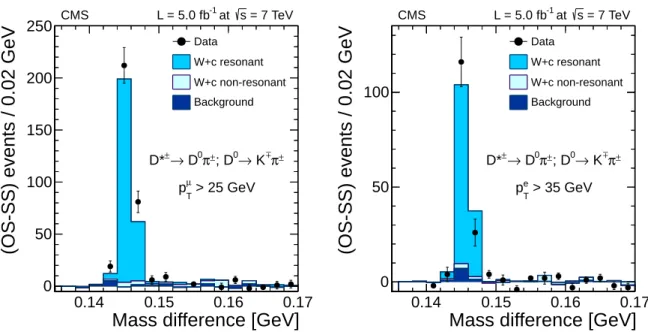
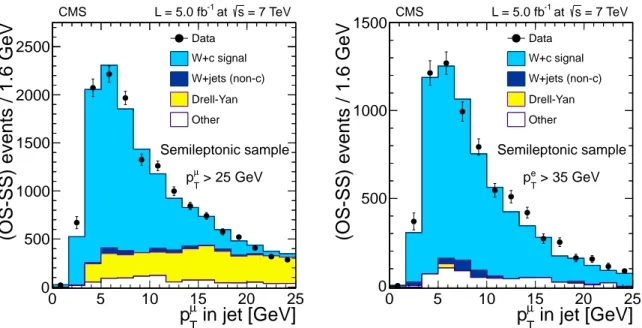
Figure 4 shows the resulting transverse momentum distribution of the selected muons inside the leading jet after the OS−SS subtraction procedure. Again, both W → µνand W → eν decays are considered, with transverse momentum requirements of pµT > 25 GeV and peT >
35 GeV for the leptons from the W-boson decay. The background predicted by the simulation is rather small in the electron channel, but has a substantial Drell–Yan component in the muon channel. The visible excess of data over the predictions is consistent with the observations in the D±and D∗±(2010)channels.
in jet [GeV]
µ
T
p
0 5 10 15 20 25
(OS-SS) events / 1.6 GeV
0 500 1000 1500 2000 2500 Data W+c signal W+jets (non-c) Drell-Yan Other Semileptonic sample > 25 GeV µ T p = 7 TeV s at -1 L = 5.0 fb CMS
in jet [GeV]
µ Tp
0 5 10 15 20 25(OS-SS) events / 1.6 GeV
0 500 1000 1500 Data W+c signal W+jets (non-c) Drell-Yan Other Semileptonic sample > 35 GeV e T p = 7 TeV s at -1 L = 5.0 fb CMS
Figure 4: Distributions of the transverse momentum of the muon inside the leading jet of the event, after subtraction of the SS component. The channels shown correspond to muon and electron decay channels of the W boson with pµT >25 GeV (left) and peT >35 GeV (right).
10 5 Event selection
5.4 Selection of inclusive D±and D∗±
(
2010)
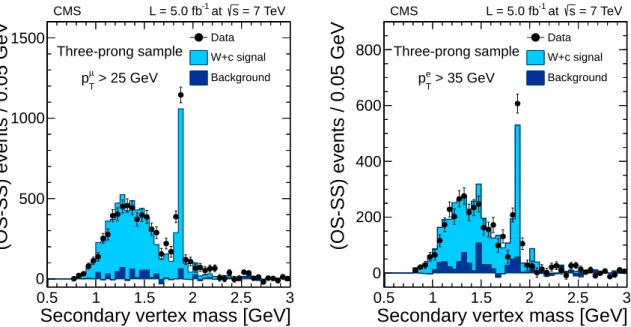
decaysEnlarged samples of W+c candidates are selected from the events with secondary vertices with three or two tracks, in order to increase the size of the samples available for the differential measurements. We refer to them as inclusive three-prong and two-prong samples, respectively. Candidates for charm meson decays in the D± → K∓π±π± decay mode are selected among the events with a secondary vertex with three tracks and with a vertex charge equal to ±1, which is computed as the sum of the charges associated with the tracks constituting the vertex. The mass assignment for the secondary tracks follows the procedure described in Section 5.1. However, the constraint that the invariant mass of the secondary vertex be compatible with the D±nominal mass within 50 MeV is not required in this case. The OS−SS distribution of the reconstructed invariant mass in events with three prongs is presented in Fig. 5. In addition to the resonant peak at the D± mass, there is a nonresonant spectrum with lower values of the invariant mass corresponding mainly to D±decays with one or more unaccounted neutral particles in the final state. For the differential cross section measurement, we consider the region of the invariant mass spectrum m(K∓π±π±) < 2.5 GeV. This results in a sample five times larger than the D±exclusive sample.
Secondary vertex mass [GeV]
0.5 1 1.5 2 2.5 3
(OS-SS) events / 0.05 GeV
0 500 1000 1500 Data W+c signal Background Three-prong sample > 25 GeV µ T p = 7 TeV s at -1 L = 5.0 fb CMS
Secondary vertex mass [GeV]
0.5 1 1.5 2 2.5 3
(OS-SS) events / 0.05 GeV
0 200 400 600 800 Data W+c signal Background Three-prong sample > 35 GeV e T p = 7 TeV s at -1 L = 5.0 fb CMS
Figure 5: Inclusive three-prong samples: Invariant mass distribution of the three tracks com-posing a secondary vertex assuming a D±→K∓π±π±hypothesis. The left plot is for W→µν events, with pµT>25 GeV. The right plot is for W→eν events, with peT >35 GeV. Distributions are presented after subtraction of the SS component.
Similarly, candidates for D0charm meson decays are reconstructed in the W+jets events with a displaced secondary vertex built from two tracks of opposite curvature. The two tracks are assumed to correspond to the decay products of a D0. The decay chain D∗±(2010) → D0π±, D0→K∓π±is identified according to the procedure described in Section 5.2, but dropping the D0mass constraint |m(K∓
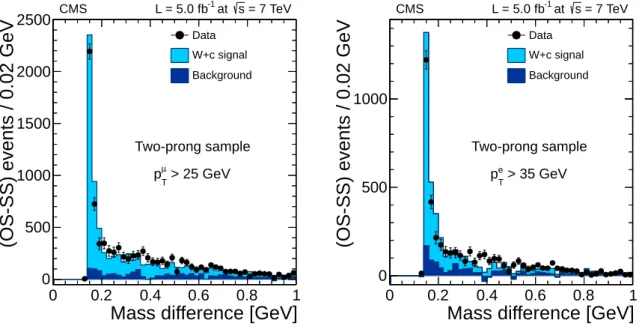
π±) −1864.86 MeV| < 70 MeV. Figure 6 shows the OS−SS distri-butions of the mass difference m(K∓π±π±) −m(K∓π±), where one of the pions is the closest track from the primary pp interaction vertex. The peak at m(K∓π±π±) −m(K∓π±)∼145 MeV corresponds to the nominal D∗±(2010) −D0 mass difference [35]. W+c events are still the dominant contribution at larger values of the mass difference. The remaining background is
11
small and it is mainly due to residual W+light-quark jets, W+cc, and tt production. We select the events with an invariant mass difference m(K∓π±π±) −m(K∓π±) < 0.7 GeV. The size of the sample is increased by a factor of∼25 with respect to the exclusive D∗±(2010)sample.
Mass difference [GeV]
0 0.2 0.4 0.6 0.8 1
(OS-SS) events / 0.02 GeV
0 500 1000 1500 2000 2500 Data W+c signal Background Two-prong sample > 25 GeV µ T p = 7 TeV s at -1 L = 5.0 fb CMS
Mass difference [GeV]
0 0.2 0.4 0.6 0.8 1
(OS-SS) events / 0.02 GeV
0 500 1000 Data W+c signal Background Two-prong sample > 35 GeV e T p = 7 TeV s at -1 L = 5.0 fb CMS
Figure 6: Inclusive two-prong samples: Distribution of the difference between the invariant mass of the two-track system and the closest track from the primary pp interaction vertex and the invariant mass of the two secondary vertex tracks (m(K∓π±π±) −m(K∓π±)), assuming the decay chain D∗±(2010) → D0π± → K∓
π±π±. The sharp peak at 145 MeV reflects the nominal mass difference between the invariant mass of the D0 and the primary-pion system and the D0mass for the decay D∗±(2010) → D0π±. The left plot is for W → µνevents, with pTµ > 25 GeV. The right plot is for W → eν events, with peT > 35 GeV. The distributions are presented after subtraction of the SS component.
6
Measurement of the W
+
c cross section
The measurement of the W+c cross section is performed with several different final states containing a well-identified W → `νdecay plus a leading jet with charm content. We use the exclusive D±and D∗±(2010)samples and the semileptonic sample, described in Section 5. Two sets of measurements are provided: one with p`
T > 25 GeV using only W → µνdecays; and a
second one, using both W→µνand W→eν decays with p`T >35 GeV.
For all channels under study, the W+c cross section is determined in the fiducial region p`T >
25(35)GeV,|η`| <2.1, pjetT >25 GeV,|ηjet| <2.5 using the following expression:
σ(W+c) =
Nsel−Nbkg
Lint B C ,
where Nsel is the number of OS−SS events selected in the defined signal region, Nbkg is the
estimated number of background events after OS−SS subtraction,Lintis the integrated lumi-nosity, andB is the relevant charm branching fraction, derived in Section 5, for the channel under study, i.e.B ≡ B(c → D+; D+ → K−π+π+) = (2.08±0.10)% in the case of the D± channel,B ≡ B(c→D∗+(2010); D∗+(2010) →D0π+; D0→K−π+) = (0.622±0.020)% for the D∗±(2010)channel, andB ≡ B(c→ `) = (9.11±0.49)% for the semileptonic channel.
12 6 Measurement of the W+c cross section
The factorC accounts for limited acceptances and efficiencies. In W+c events, less than 20% of the events have a well-identified secondary vertex, while less than 50% of the muons from semileptonic charm decays have sufficiently high energy to be reconstructed and identified in the muon spectrometer. The simulated W+jets sample generated by MADGRAPH+PYTHIAis
used to calculate the fraction of events within the fiducial region that fulfil the criteria for the several charm-quark jet categories. These simulated samples are corrected for any differences between data and MC description in lepton trigger, identification and reconstruction efficien-cies. Scaling factors, defined as the ratio efficiencydata/efficiencyMCas a function of the lepton pseudorapidity, are determined with samples of Z→ `+`−events. An invariant mass (m`
+`−)
constraint and tight quality requirements assigned to one of the leptons (“tag”) allow the other lepton to be used as a probe to test the different steps in lepton identification (“tag-and-probe” method) [32]. The precision in the factorC is limited by the size of the MC sample employed; its statistical uncertainty is propagated as a systematic uncertainty to the W+c cross section. The signal region for the D± channel is defined by the constraint ∆m(D±) ≡ |mrec(D±) −
1.87 GeV| < 0.05 GeV, where mrec(D±)is the reconstructed mass of the D±candidate (Fig. 2). The same requirement is applied to the MC simulations in order to determine the correction fac-torC. We estimate values ofC =0.1114±0.0033(pµT>25 GeV)andC =0.0834±0.0032(peT >
35 GeV), where the quoted uncertainties are statistical only. The background is fully dom-inated by the nonresonant W+c component. It is subtracted from the selected number of events in the data window by using the number of events selected in a control region away from the resonance, extending up to a difference of 200 MeV with respect to the nominal D± mass, N[0.05 GeV < ∆m(D±) < 0.20 GeV]. This number is scaled by the ratio N[∆m(D±) <
0.05 GeV]/N[0.05 GeV < ∆m(D±) < 0.20 GeV] observed in the simulation in order to obtain the number of background events expected in the reference window. This procedure is largely independent of uncertainties in the charm fractions present inPYTHIA. Systematic biases due to the assumed nonresonant background subtraction are expected to be negligible compared to the statistical uncertainty, given the approximate agreement between data and MC distribu-tions.
The signal region for the D∗±(2010) channel is restricted to the interval ∆m(D∗±(2010)) ≡ |mrec(D∗±(2010)) −mrec(D0) −145 MeV| < 5 MeV, where mrec(D∗±(2010)) −mrec(D0)is the reconstructed mass difference between the D mesons (Fig. 3). The same procedure is applied to the MC simulations in order to determine the correction factor C. We estimate values of
C =0.0849±0.0040(pµT > 25 GeV)andC =0.0559±0.0036(peT >35 GeV), where the quoted uncertainties are statistical only. As in the D± case, the background is subtracted from the selected number of data events in a sideband sample, 5 MeV < ∆m(D∗±(2010)) < 20 MeV. This number is scaled by the ratio N[∆m(D∗±(2010)) <5 MeV]/N[5 MeV<∆m(D∗±(2010)) <
20 MeV]observed in the simulation.
For the semileptonic channel, Nsel is given by the number of events with a W-boson
candi-date decaying into a high-pT muon or electron and an identified muon inside the jet passing
the requirements described in Section 5.3. The correction factors C for the different lepton thresholds are estimated in the MC simulation as C = 0.2035±0.0021 (pµT > 25 GeV) and
C = 0.1706±0.0021 (pe
T > 35 GeV), where the quoted uncertainties are statistical only. The
number of background events remaining after selection is estimated from the simulated sam-ples. In the sample with two opposite-sign muons, the residual Drell–Yan background corre-sponds to events with significant missing transverse energy and one low-pTmuon inside a jet.
Potential discrepancies between data and MC description in this particular phase space region are evaluated by analyzing the Drell–Yan-dominated control sample with dimuon invariant masses above 85 GeV. A correction factor of 1.2±0.1 provides agreement between data and
13
MC simulation in this region and it is applied to estimate the background in the signal region. The uncertainty in this correction factor is propagated as a systematic uncertainty in the cross section measurement. This takes into account possible differences in the description of events below and around the Z-boson peak, where this factor is derived.
Table 1 contains all the relevant inputs used in the measurements and the resulting cross sec-tions in the different subchannels. The sources of systematic uncertainties affecting the mea-surement are discussed in Section 6.1.
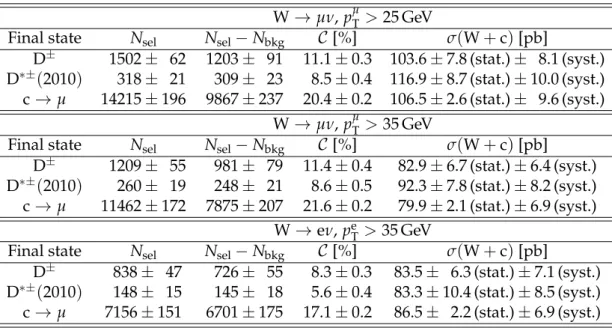
Table 1: Cross section results for three specific final states. Here Nselis the estimated number of
selected events in the signal region (around the resonance in the case of D±and D∗±(2010)final states). Nsel−Nbkgis the estimate for the signal events after background subtraction using the method described in the text,Cis the acceptance and efficiency correction factor, and σ(W+c)
is the measured W+c cross section after correction for the charm fractions as discussed in the text. Results obtained with the sample of W bosons decaying into a muon and a neutrino and for the two muon transverse momentum thresholds (pµT>25 GeV and pµT >35 GeV) are shown in the first two blocks of the table. Results obtained when the W boson decays into an electron and a neutrino (peT >35 GeV) are given in the lowest block of the table. All uncertainties quoted in the table are statistical, except for the measured cross sections, which include systematic uncertainties due to the sources discussed in Section 6.1.
W→µν, pµT>25 GeV
Final state Nsel Nsel−Nbkg C[%] σ(W+c)[pb]
D± 1502± 62 1203± 91 11.1±0.3 103.6±7.8 (stat.)± 8.1 (syst.) D∗±(2010) 318± 21 309± 23 8.5±0.4 116.9±8.7 (stat.)±10.0 (syst.) c→µ 14215±196 9867±237 20.4±0.2 106.5±2.6 (stat.)± 9.6 (syst.)
W→µν, pµT>35 GeV
Final state Nsel Nsel−Nbkg C[%] σ(W+c)[pb] D± 1209± 55 981± 79 11.4±0.4 82.9±6.7 (stat.)±6.4 (syst.) D∗±(2010) 260± 19 248± 21 8.6±0.5 92.3±7.8 (stat.)±8.2 (syst.) c→µ 11462±172 7875±207 21.6±0.2 79.9±2.1 (stat.)±6.9 (syst.)
W→eν, peT>35 GeV
Final state Nsel Nsel−Nbkg C[%] σ(W+c)[pb]
D± 838± 47 726± 55 8.3±0.3 83.5± 6.3 (stat.)±7.1 (syst.) D∗±(2010) 148± 15 145± 18 5.6±0.4 83.3±10.4 (stat.)±8.5 (syst.) c→µ 7156±151 6701±175 17.1±0.2 86.5± 2.2 (stat.)±6.9 (syst.)
For each W-boson decay channel and lepton pTthreshold considered, the cross sections
mea-sured from the three charm meson decay samples are consistent and are combined. Measure-ments performed in the muon and electron channel with a lepton pT threshold of 35 GeV are
also combined. The combination is a weighted average of the individual measurements taking into account their statistical and systematic uncertainties. Systematic uncertainties arising from a common source and affecting several measurements are considered to be fully correlated. For pµT >25 GeV the average W+c cross section is
14 6 Measurement of the W+c cross section
For p`T >35 GeV we obtain
σ(pp→W+c+X) × B(W→µν)(pµT >35 GeV) =82.9±2.6 (stat.)±5.1 (syst.) pb, σ(pp→W+c+X) × B(W→eν)(peT >35 GeV) =85.3±2.5 (stat.)±5.7 (syst.) pb,
σ(pp→W+c+X) × B(W→ `ν)(p`T >35 GeV) =84.1±2.0 (stat.)±4.9 (syst.) pb.
The average cross sections are dominated by the measurements in the semileptonic channel (∼50%), followed by the D±channel (∼30%) and the D∗±(2010)channel (∼20%). The weight of the W→µνchannel in the cross section measurement with a lepton pTthreshold of 35 GeV
is∼30% higher than the contribution from the W→eν channel.
These measurements are largely background-free. The overall relative uncertainty, 6–7%, is dominated by systematic uncertainties in the theoretical modeling of the signal and by exper-imental uncertainties in the efficiency of the selection criteria. A detailed comparison with theoretical predictions is provided in Section 9.
6.1 Systematic uncertainties in the W
+
c cross section measurementThe various sources of systematic uncertainties are presented in Table 2. The limited precision in the branching fractions of the charm decays is one of the dominant sources of uncertainties. Tracking reconstruction inefficiencies are intrinsically small (<1% [42]). Given the nature of the method used to build secondary vertices, tracks are assigned to either the primary or secondary vertex in a way that may be different in data and MC simulation. In order to estimate the size of a potential discrepancy, the set of secondary tracks is either increased by adding a nearby primary track or decreased by dropping one of the original secondary tracks. A systematic uncertainty of 3.3% in the measured cross sections is estimated from the observed differences at the resonant D0 and D±peaks between data and simulation. Its impact on the final cross sections is reduced after combination with the results from the semileptonic channel, which is free of this uncertainty.
Uncertainties due to the pileup modeling are calculated using a modified pileup profile ob-tained with a minimum bias cross section increased by its estimated uncertainty, ≈6%. Jet energy scale uncertainties are extracted from dedicated CMS studies [19], which also take into account possible variations in the jet flavour composition. Additional ETmiss effects are esti-mated by smearing the MTdistribution in simulation in order to match the MTshape observed
in data. Their impact is≈2% on the final measurement.
Lepton trigger and selection inefficiencies are included in the simulation by applying the cor-responding data/MC scale factors determined in dedicated “tag-and-probe” studies as a func-tion of the lepton pseudorapidity. For muons we estimate a 0.7% uncertainty according to CMS studies on dimuon events in the Z-boson mass peak. In the electron case we consider the dif-ference between switching on and off the efficiency scale factors, because of the presence of missing transverse energy requirements at the trigger level that cannot be fully accounted by using “tag-and-probe” techniques. The effect of momentum and energy resolution corrections determined at the Z-boson mass peak is also propagated as an additional uncertainty. We com-bine the uncertainties due to lepton identification, isolation, and trigger efficiencies with the uncertainty in the lepton momentum and energy resolution in a single entry in Table 2.
The efficiency uncertainty for muons inside jets is taken to be 3.0% according to dedicated studies in multijet events. The systematic uncertainty arising from the Drell–Yan background
6.2 Characterization ofW+c kinematics 15
subtraction in the semileptonic channel is determined as the change in the cross section when the correction factor to the MC simulation is varied within its uncertainties.
The propagation of the statistical uncertainty in the factorCto the cross section is not negligible due to the limited size of the MC samples used. The uncertainties related to initial-state radi-ation (ISR) are estimated by recalculating the factor C from samples generated with different renormalization and factorization scales (half and twice the default scale Q2used in the gener-ation). The average value of the meson energy fraction in charm decays is varied by 4%, which is about twice the uncertainty in the D∗±(2010)fragmentation determined at LEP [37, 39], in order to cover possible uncertainties in the assumed shape. Other theoretical uncertainties in
C include PDF effects and potential biases due to the adoption of the MADGRAPH jet-parton
matching scheme as the reference to be compared with theMCFMcalculations (≈1%).
The integrated luminosity measurement has a 2.2% uncertainty [43]. Physics backgrounds, in-cluding the gluon-splitting W+cc component, have a negligible contribution to the systematics compared with the statistical uncertainties in the background subtraction.
Table 2: Breakdown of the different contributions to the total systematic uncertainty (∆syst) in
the combined σ(W+c)measurements in the fiducial region given by pjetT >25 GeV,|ηjet| <2.5,
|η`| <2.1 for two different thresholds of the transverse momentum of the lepton from the W-boson decay: p`T >25 GeV (muon channel only) and pT` >35 GeV (muon and electron channels combined).
pµT>25 GeV p`T >35 GeV Source ∆syst[%] ∆syst[%]
B(c→D±→K∓π±π±) 1.5 1.5
B(c→D∗±(2010) →D0→K∓π±) 0.7 0.6
B(c→µ) 2.6 2.7
Vertex reconstruction 1.8 1.7
Pileup 0.9 0.8
Jet energy scale 3.0 1.7
ETmiss 2.0 2.0
Lepton efficiency, resolution 0.8 1.5 Muon efficiency in charm decay 1.4 1.5
Drell–Yan background 1.4 0.9
MC statistics (Cstat. uncert.) 1.6 1.3 ISR and renormalization/
0.2 0.2
factorization scales
Fragmentation function 0.8 0.6 Other theoretical uncertainties 0.8 0.7
Luminosity 2.2 2.2
Total 6.3 5.7
6.2 Characterization of W
+
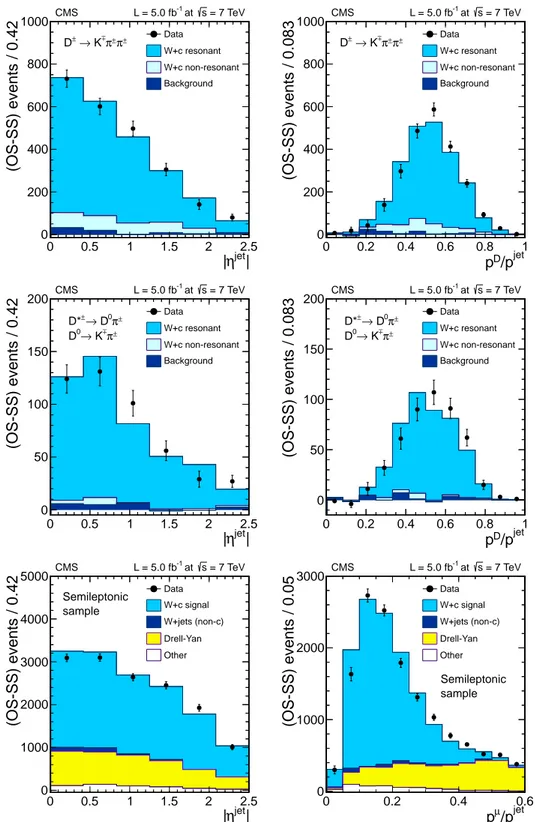
c kinematicsThe high signal purity of the selected samples allows a deeper study of the properties of W+
c events. Figure 7 shows the distributions of the jet pseudorapidity and the jet momentum fraction carried by the D±candidates (top row of plots) and the D∗±(2010)candidates (middle row of plots), while the jet pseudorapidity and the jet momentum fraction carried by the muon is shown for the semileptonic candidates (bottom row of plots). The latter observable is directly
16 7 Measurement of the differential cross section as a function of the lepton pseudorapidity
related to the charm fragmentation function. The normalization of the W+c component in the simulation has been scaled by a factor of 1.1 in order to match approximately the experimental rate measured in data. Electron and muon channels are added in order to enhance the statistical power of the comparison. All distributions show reasonable agreement with the predictions of MADGRAPH+PYTHIA, although the experimental charm fragmentation spectra are slightly harder than the predicted ones.
7
Measurement of the differential cross section as a function of
the lepton pseudorapidity
The W+c cross section is also measured differentially with respect to the absolute value of the pseudorapidity of the lepton from the W-boson decay. We first determine the normalized differential cross section,(1/σ(W+c))dσ(W+c)/d|η|. The absolute differential cross section is derived from the normalized one just by scaling to the average cross section presented in the previous section.
For this measurement, the inclusive three-prong and two-prong samples of W+c candidates are used. In addition, the semileptonic sample is employed. Five bins in the absolute value of the lepton pseudorapidity are considered: [0, 0.35], [0.35, 0.7], [0.7, 1.1], [1.1, 1.6], [1.6, 2.1]; this binning is chosen in order to have a uniform distribution of the events among the five bins. The normalized differential cross section is computed from the observed number of OS−SS events with the lepton from the W-boson emitted in a given pseudorapidity bin (Nsel,i), after
subtraction of the residual background (Nbkg,i), which is evaluated with the simulated samples.
A bin-by-bin correction (Cnorm
i ) is used to correct(Nsel,i−Nbkg,i)for detector inefficiencies. For
this differential cross section only the differences among rapidity bins are relevant. Hence we define the lowest rapidity bin [0, 0.35] as Cnorm
1 = 1.0 and compute the correction factors
rel-ative to this bin. These correction factors are displayed in Table 3. For Cnorm
i only selection
requirements related to the W-boson identification and jet selection are applied; these will be used to correct the observed events in the semileptonic sample. This procedure is done sepa-rately for events with a secondary vertex using the correction factorsCnorm
SV , which are applied
to the events in the inclusive three- and two-prong samples. Global factors correcting for effects independent of the pseudorapidity of the lepton from the W-boson decay affect equally all bins and cancel in the normalization. The statistical uncertainty in theCnorm
i factors is propagated
as a systematic uncertainty to the normalized differential cross section.
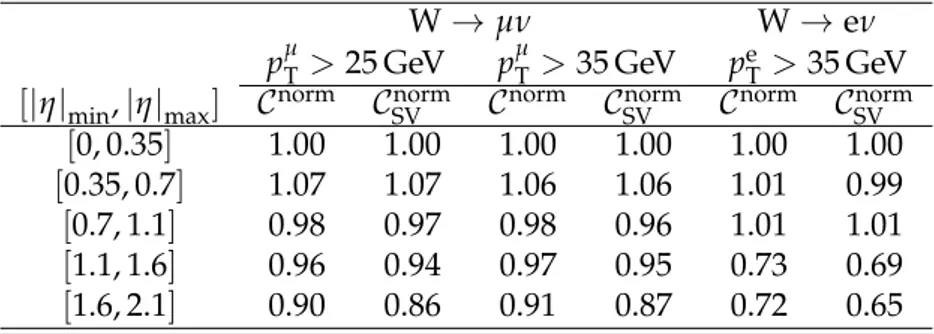
Table 3: Correction factors Cnorm used for the calculation of the differential measurements.
Statistical uncertainties inCnormare typically 0.3% while inCnorm
SV they are roughly 1%.
W →µν W→eν
pµT >25 GeV pµT >35 GeV peT >35 GeV
[|η|min,|η|max] Cnorm CSVnorm Cnorm CSVnorm Cnorm CSVnorm
[0, 0.35] 1.00 1.00 1.00 1.00 1.00 1.00
[0.35, 0.7] 1.07 1.07 1.06 1.06 1.01 0.99
[0.7, 1.1] 0.98 0.97 0.98 0.96 1.01 1.01
[1.1, 1.6] 0.96 0.94 0.97 0.95 0.73 0.69
[1.6, 2.1] 0.90 0.86 0.91 0.87 0.72 0.65
The number of events selected, Nsel,i, in the inclusive three-prong sample is subject to the
17 | jet η | 0 0.5 1 1.5 2 2.5 (OS-SS) events / 0.42 0 200 400 600 800 1000 Data W+c resonant W+c non-resonant Background ± π ± π ± K → ± D = 7 TeV s at -1 L = 5.0 fb CMS jet /p D p 0 0.2 0.4 0.6 0.8 1 (OS-SS) events / 0.083 0 200 400 600 800 1000 Data W+c resonant W+c non-resonant Background ± π ± π ± K → ± D = 7 TeV s at -1 L = 5.0 fb CMS | jet η | 0 0.5 1 1.5 2 2.5 (OS-SS) events / 0.42 0 50 100 150 200 Data W+c resonant W+c non-resonant Background ± π ± K → 0 D ± π 0 D → ± D* = 7 TeV s at -1 L = 5.0 fb CMS jet /p D p 0 0.2 0.4 0.6 0.8 1 (OS-SS) events / 0.083 0 50 100 150 200 Data W+c resonant W+c non-resonant Background ± π ± K → 0 D ± π 0 D → ± D* = 7 TeV s at -1 L = 5.0 fb CMS | jet η | 0 0.5 1 1.5 2 2.5 (OS-SS) events / 0.42 0 1000 2000 3000 4000 5000 Data W+c signal W+jets (non-c) Drell-Yan Other sample Semileptonic = 7 TeV s at -1 L = 5.0 fb CMS jet /p µ p 0 0.2 0.4 0.6 (OS-SS) events / 0.05 0 1000 2000 3000 Data W+c signal W+jets (non-c) Drell-Yan Other sample Semileptonic = 7 TeV s at -1 L = 5.0 fb CMS
Figure 7: Distributions of W+c selected events in the different charm decay channels as a function of the jet pseudorapidity (left) and the jet momentum fraction (right) carried by the D meson or by the muon inside the jet. The top row corresponds to the D± decay channel, the middle row corresponds to the D∗±(2010)decay channel, and the bottom row corresponds to semileptonic charm decays into muons. Only events in the signal region used to determine the cross section are used. The Monte Carlo predictions have been scaled by a factor of 1.1 in order to approximately match the W+c yield measured in data.
18 7 Measurement of the differential cross section as a function of the lepton pseudorapidity
2.5 GeV. The events included in the inclusive two-prong sample have a mass difference of less than 0.7 GeV between (1) the invariant mass of the two-track system plus the closest track from the primary pp interaction m(K∓π±π±), and (2) the invariant mass of the two-track system m(K∓π±). For the semileptonic channel Nsel,i is given by the number of events with a W-boson candidate decaying into a high-pTlepton and an identified muon inside the jet passing
the requirements described in Section 5.3. The assignment to the corresponding ith bin in the differential distribution is determined by the absolute value of the pseudorapidity of the lepton from the W-boson decay.
The normalized differential cross sections are presented graphically in Fig. 8. The number of OS−SS events in each lepton pseudorapidity bin for the three charm meson decay samples are detailed in Tables 11, 12, and 13 of Appendix A, together with the expected residual back-ground Nbkg,i and the numerical values of the normalized cross sections. The estimation of
this background contamination has large statistical uncertainties due to the limited size of the MC samples, mainly for the data with a displaced secondary vertex. This uncertainty is propa-gated to the differential cross sections as a systematic uncertainty in the measurement. Unlike the W →eν sample, there is a sizable background contribution in the W→ µνsample arising from Drell–Yan events.
| µ η | 0 0.5 1 1.5 2 | η (W+c)/d| σ (W+c) d σ 1/ 0.2 0.4 0.6 0.8 Three-prong sample Two-prong sample Semileptonic sample = 7 TeV s at -1 L = 5.0 fb CMS > 25 GeV µ T p > 25 GeV jet T p | µ η | 0 0.5 1 1.5 2 | η (W+c)/d| σ (W+c) d σ 1/ 0.2 0.4 0.6 0.8 Three-prong sample Two-prong sample Semileptonic sample = 7 TeV s at -1 L = 5.0 fb CMS > 35 GeV µ T p > 25 GeV jet T p | e η | 0 0.5 1 1.5 2 | η (W+c)/d| σ (W+c) d σ 1/ 0.2 0.4 0.6 0.8 Three-prong sample Two-prong sample Semileptonic sample = 7 TeV s at -1 L = 5.0 fb CMS > 35 GeV e T p > 25 GeV jet T p
Figure 8: Normalized differential cross section distribution of W+c (W → `ν) events as a function of the absolute value of the pseudorapidity of the lepton from the W-boson decay. The first two plots show the results from the W→µνsample, with pTµ>25 GeV (left plot) and pµ
T > 35 GeV (middle plot). The right plot shows the results from the W → eν sample, with
peT > 35 GeV. The results obtained with the inclusive three-prong sample are shown as open points. Solid squares represent the results obtained with the inclusive two-prong sample and the open triangles give the result from the semileptonic sample. Data points showing the results from the three-prong and the semileptonic samples are slightly displaced in the horizontal axis for better visibility of the results.
The normalized differential cross sections measured with the different W+c subsamples and for the two W → `ν decay channels are consistent. Therefore, the results obtained in the W→µνchannel with pµT>25 GeV are averaged, as are the results for the W→µνand W→eν channels with p`
T > 35 GeV. These combinations are a weighted average of the individual
measurements taking into account their statistical and systematic uncertainties. Systematic uncertainties arising from a common source and affecting several measurements are considered to be fully correlated among them. The existing statistical correlations among the normalized cross section in the five pseudorapidity bins are included in the combination. These averaged values are given in Table 4. The corresponding correlation matrices are presented in Table 5.
7.1 Systematic uncertainties in the normalized differential cross section measurement 19
The normalized differential cross sections obtained for pµT >25 GeV and p`T >35 GeV are com-bined with the respective W+c cross sections presented in Section 6 to obtain the absolute differential cross sections, dσ(W+c)/d|η|. Results are shown in Table 6. Normalized differ-ential cross section and total cross section measurements are essdiffer-entially uncorrelated and the full covariance matrices for the absolute differential cross sections can be obtained by propa-gating the information contained in Tables 4 and 5 and the total uncertainty in the W+c cross sections.
Table 4: The normalized differential cross section as a function of the absolute value of the lepton pseudorapidity. These results are the average of the three samples (inclusive three-prong, inclusive two-three-prong, and semileptonic). The left column shows the results obtained with the W → µν sample for muons with pT > 25 GeV, while the right column combines the
results obtained with the W→µνand W→eν samples for leptons with pT>35 GeV. Normalized differential cross section,(1/σ(W+c))dσ(W+c)/d|η|
[|η|min,|η|max] pT` >25 GeV p`T >35 GeV
[0, 0.35] 0.638±0.016 (stat.)±0.012 (syst.) 0.622±0.013 (stat.)±0.010 (syst.)
[0.35, 0.7] 0.556±0.016 (stat.)±0.012 (syst.) 0.585±0.014 (stat.)±0.010 (syst.)
[0.7, 1.1] 0.527±0.015 (stat.)±0.011 (syst.) 0.541±0.012 (stat.)±0.009 (syst.)
[1.1, 1.6] 0.416±0.012 (stat.)±0.009 (syst.) 0.407±0.010 (stat.)±0.008 (syst.)
[1.6, 2.1] 0.326±0.012 (stat.)±0.009 (syst.) 0.316±0.010 (stat.)±0.007 (syst.)
Table 5: Correlation matrices for the averaged normalized differential cross sections(1/σ(W+
c))dσ(W+c)/d|η|. Matrices are symmetric and only the lower part of them is shown. The top matrix is for the normalized differential cross section requiring that the pT of the lepton be
larger than 25 GeV (W→µνsample only). The bottom one refers to the combination of results obtained with the W→µνand W→eν samples for leptons with pT >35 GeV.
p` T>25 GeV [|η|min,|η|max] [0, 0.35] [0.35, 0.7] [0.7, 1.1] [1.1, 1.6] [1.6, 2.1] [0, 0.35] 1.00 [0.35, 0.7] −0.22 1.00 [0.7, 1.1] −0.24 −0.22 1.00 [1.1, 1.6] −0.26 −0.26 −0.28 1.00 [1.6, 2.1] −0.24 −0.24 −0.26 −0.26 1.00 p`T>35 GeV [|η|min,|η|max] [0, 0.35] [0.35, 0.7] [0.7, 1.1] [1.1, 1.6] [1.6, 2.1] [0, 0.35] 1.00 [0.35, 0.7] −0.20 1.00 [0.7, 1.1] −0.22 −0.21 1.00 [1.1, 1.6] −0.26 −0.26 −0.28 1.00 [1.6, 2.1] −0.24 −0.24 −0.25 −0.27 1.00
7.1 Systematic uncertainties in the normalized differential cross section
mea-surement
The dominant source of systematic uncertainty in the normalized differential cross sections from the three samples is the limited size of the MC samples. It impacts the statistical accuracy
20 7 Measurement of the differential cross section as a function of the lepton pseudorapidity
Table 6: The differential cross section as a function of the absolute value of the lepton pseudo-rapidity. These results are the average of the three samples (inclusive three-prong, inclusive two-prong, and semileptonic). The left column shows the results obtained with the W → µν sample for muons with pT > 25 GeV, while the right column combines the results obtained
with the W→µνand W→eν samples for leptons with pT >35 GeV.
Differential cross section, dσ(W+c)/d|η|[pb]
[|η|min,|η|max] p`T >25 GeV p`T >35 GeV
[0, 0.35] 68.7±2.7 (stat.)±4.6 (syst.) pb 52.3±1.7 (stat.)±3.2 (syst.) pb
[0.35, 0.7] 59.9±2.5 (stat.)±4.0 (syst.) pb 49.2±1.6 (stat.)±3.0 (syst.) pb
[0.7, 1.1] 56.7±2.4 (stat.)±3.8 (syst.) pb 45.5±1.5 (stat.)±2.7 (syst.) pb
[1.1, 1.6] 44.8±1.9 (stat.)±3.2 (syst.) pb 34.2±1.2 (stat.)±2.1 (syst.) pb
[1.6, 2.1] 35.1±1.7 (stat.)±2.4 (syst.) pb 26.6±1.0 (stat.)±1.7 (syst.) pb
in the estimation of the residual background after the SS subtraction, and to a lesser extent, in the determination of the correction factorsCnorm
i . As summarized below, most of the other
sources that have been discussed in Section 6 have a negligible impact in the differential distri-butions since their effects largely cancel out in the ratios.
Differential distributions are mostly independent of jet energy scale effects since they are mea-sured as a function of the pseudorapidity of the lepton from the W-boson decay and the spanned jet kinematic region is similar in all cases, independently of the pseudorapidity of the lepton. Possible effects due to jet energy scale uncertainties are evaluated by changing the jet energy scale in the simulated W+c sample in accord with the results of dedicated studies by CMS [19]. The variations observed in the resulting differential distribution can be largely explained by statistical fluctuations in the MC sample.
The calibration factors for lepton momentum scale and resolution have been derived from de-tailed studies of the position and width of the Z-boson peak [44, 45]. The systematic uncertainty in the normalized differential cross section is estimated in the W → eν channel by comparing the resulting distributions with and without calibration corrections. Variations are smaller than 1% in the barrel, and of the order of 1.5% in the endcap region. In the W → µν channel the measurement is repeated many times, varying the muon calibration factors within their uncer-tainties and comparing to the values obtained when applying the central value of the correcting factors. The width of the resulting distribution is taken as the systematic uncertainty arising from limited knowledge of the muon momentum scale and resolution. Uncertainties between 0.2% and 0.4% in the normalized differential distributions are obtained, depending on the par-ticular muon pseudorapidity bin, the sample selection, and the pTµthreshold.
We estimate a residual∼0.35% systematic uncertainty in the muon efficiency scaling factors, which are treated as uncorrelated among the different pseudorapidity bins. For the W → eν channel, the effect of the efficiency corrections in the measured ratios (∼0.25%) is computed and taken as an estimation of the systematic uncertainty.
In the modeling of the background remaining after the SS subtraction, the only physical pro-cess with a visible contribution to the final sample is Drell–Yan production, which, when one of the two muons is inside a jet, mimics the semileptonic sample in the W →µνchannel. The correction factor (1.2±0.1) applied to the Drell–Yan prediction is varied by one sigma and the differential distribution is reevaluated. Variations smaller than 0.3% are observed and taken as the associated systematic uncertainty. Top-quark contributions have also been varied by 6% for tt production and by 15% for single-top-quark production. Variations in the differential