A N I N T E R N A T I O N A L J O U R N A L
Feasibility Study through Grid-Connected Photovoltaic
Systems in Curitiba
Camila
de Oliveira Silveira
1*,
Allyson dos Reis Moreira
1,
Bárbara Luíza P. Moreira
1,
Jair
Urbanetz Junior
11 Universidade Tecnológica Federal do Paraná, Curitiba, Brasil.
ABSTRACT
The increase in energy demand in Brazil encourages the country to increasingly invest in generation of electric energy, where the demand for other renewable sources increases gradually because they have a lower impact on the environment. The use of Grid-Connected Photovoltaic Systems (GCPVS) is a viable solution for the country, since it presents favorable natural conditions for the use of solar energy. This study approaches the current scenario of three photovoltaic systems installed in Curitiba in 2016 and part of 2017: Green Office (GO) located in Curitiba Campus Downtown, Curitiba Campus Neoville, both of the Federal Technological University of Paraná (UTFPR), as well as a residence. By means of performance parameters, performance analysis of these systems were carried out and, in order to measure the length of time of the return of the initial investment in its installation, a study of the economic viability of these systems according to the current rate model in Brazil through economic engineering tools was carried out: Simple Payback and Discounted Payback, Net Present Value and Internal Rate of Return. Finally, the application of the saved value of electric energy bills was simulated in a bank account during the system´s lifespan.
Key words: Photovoltaic Systems, Distributed Generation, Performance Parameters, Economic Viability
INTRODUCTION
The search for the use of other sources of electric energy in Brazil is necessary since the projection of consumption for the next years is much higher than the supply of energy. It is estimated that by 2050 the total electricity consumption will increase by
3.2% per year1. As an alternative, the generation of solar energy can help in the supply
of this demand, since the country has a large territorial extension and great solar incidence with high irradiation rates. Obtaining electric energy from solar energy can be done through Grid-Connected Photovoltaic Systems (GCPVS). Some efforts have been made to develop this technology, such as ANEEL´s Normative Resolution n. 482 dated April 17, 2012, which establishes the general conditions for microgeneration and minigeration access to the distribution system, establishing in Brazil the electrical
energy compensation2. On March 1, 2016, the amendments to ANEEL’s Normative
Resolution no. 482 from Normative Resolution n. 687 came into force, making the
compensation system more comprehensive3.
MATERIAL AND METHODS
Performance Parameters
In order to measure the viability of the GCPVS in Curitiba, solar irradiation data were
collected in the city through the National Institute of Meteorology4 (INMET),
according to figure 1. To determine the values of the irradiation incident on the photovoltaic panels of the three cases of study, it was necessary to use the RADIASOL software, provided by the Federal University of Rio Grande do Sul (UFRGS).
Figure 1 - Average Daily Irradiance
Table 1 shows the geographic characteristics that should be included in RADIASOL, as well as other aspects that influence the performance of GCPVS, such as installed power and the average electricity generation in a year, corresponding to the months
0 1 2 3 4 5 6
kW
h
/m
2.d
In order to evaluate the performance of the systems studied by means of obtained values, the merit indicators were calculated, which are classified as Capacity Factor (CF), Final Yield (YF) and Performance Ratio (PR). These parameters allow performance comparison between GCPVSs operating with different powers or
premises5.
Table 1 - Characteristics of GCPVS
UTFPR’s GO UTFPR’s Neoville Residence
Start of Operation Dec 2011 Feb 2016 Jan 2016
Latitude 25.44º S 25.50º S 25.42º S
Longitude 49.27º W 49.32º W 49.33º W
Angle of Inclination 15º 25º 22º
Azimuthal Deviation 22º W 0º 2º E
Installed Power 2.1 kWp 10.2 kWp 3.0 kWp
Power Generation 208.00 kWh/month 1,067.65 kWh/month 340.17 kWh/month
The ratio between power generation (kWh) and maximum total production (kWp) in a
given period corresponds to the capacity factor6, which is calculated by means of
equation (1).
CF = Generated EnergyPower* Time (%) (1)
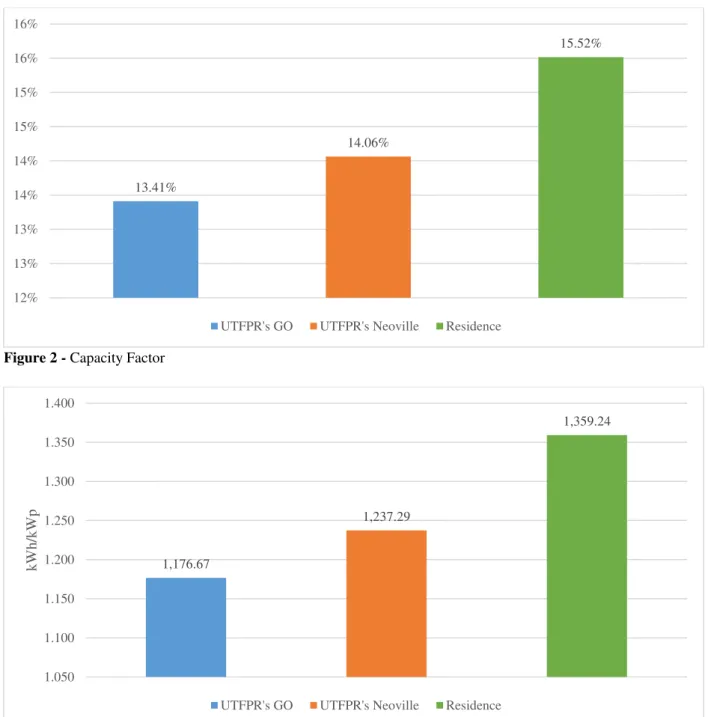
In Brazil, GCPVS have between 13% and 18% CF, varying according to the
availability of the solar resource, the technology and the form of design adopted7.
The YF reflects the performance of each GCPVS by means of relation between
generated energy (kWh) and installed power (kWp) of the system6. This index is
obtained through equation (2).
YF = Generated EnergyInstalled Power (kWhkWp) (2)
Finally, the performance ratio represents the real capacity to convert available solar energy in the plane of the panels into alternating current, usually linked to a year of
operation6. This index takes into account the losses occurred in the process of
conversion of solar energy into electricity and is expressed in equation (3).
PR = Irradiation/1000 YF (%) (3)
Economic Analysis
For the economic study, the period of average annual value of electricity consumption was the same of data collected from generation. Based on the energy bills of the GO, Neoville and residence, the consumptions of these systems were 2,273.92 kWh/month, 34,533.25 kWh/month and 501.25 kWh/month, respectively. In the case of residence, a consumption scenario was created for the GCPVS already installed. In addition, the connection type for each consumer unit was considered, which is three-phase and must pay in relation to the cost of availability - value in reals at 100 kWh referring to the minimum consumption paid by the consumer.
The energy distributor specifies the electric energy rate, which includes federal (PIS / COFINS) and state (ICMS) taxes. For the scenarios studied, data from Parana Energy Company (COPEL) were considered. The residential consumer and the GO have their rates according to subgroup B1, conventional rate. Meanwhile, Neoville belongs to the
A4 subgroup, green rate - public power8. The values of these rates are specified by
COPEL and are shown in table 2.
Table 2 - Electric Energy Rates Residence B1
(without taxes) Residence B1 (with taxes) Green Horo-seasonal A4 off-peak (with taxes)
R$ 0.41613/kWh R$ 0.6402/kWh R$ 0.42147/kWh
In order to estimate electricity rates over the next 25 years, the lifespan average of a
GCPVS, the annual adjustments for 2010 to 2016 were explored10 and the data
average was considered as the default value for a correction of the rate, that is, 8.45% per year.
For the residential scenario, two hypotheses were considered in relation to taxes. First, it considered the ICMS in the energy calculations compensated at night, which is the current economic situation in Parana. Subsequently, this rate was disregarded in compliance with ICMS Agreement 16/2015 of the National Council of Finance Policy
(CONFAZ)9. For the purpose of financial analysis, it was considered for the
residential scenario a percentage distribution of 30% at daytime and 70% at the night, representing 150.38 kWh / month and 350.88 kWh / month consumption of electricity average, respectively. The systems of UTFPR are considered ideal cases and do not need to consider the ICMS discount because all the energy produced by the GCPVS during the day is consumed, with no energy left to be compensated.
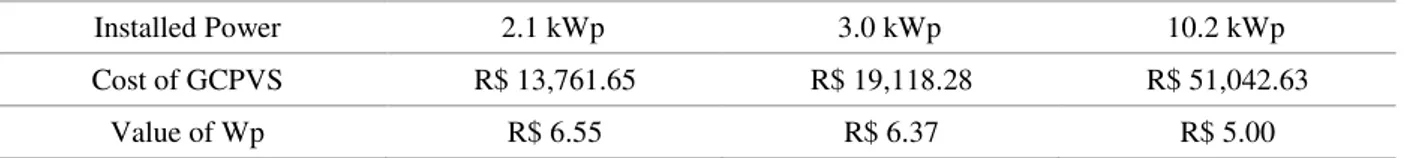
The costs of implementing GCPVS include the average watt-peak value of R$ 8.58 for
systems up to 5 kWp and R$ 7.57 for systems from 5 kWp to 30 kWp11. Table 3
presents the approximate cost of each system based on surveys carried out in the market of installers in Curitiba in April 2017.
Table 3 - Cost of GCPVS in Curitiba
Installed Power 2.1 kWp 3.0 kWp 10.2 kWp
Cost of GCPVS R$ 13,761.65 R$ 19,118.28 R$ 51,042.63
Value of Wp R$ 6.55 R$ 6.37 R$ 5.00
The cost of operating and maintaining the GCPVS is 1% per year over the initial
investment value and the efficiency loss of a GCPVS generator is 0.65% per year12.
to replace the inverter every 10 years, an extra investment is required, which
represents 16.09% of the total cost of the GCPVS12.
Based on the data collected, it was possible to prove the feasibility of the project through economic engineering tools such as Simple Payback, Discounted Payback, Net Present Value (NPV), and Internal Rate of Return (IRR).
Simple payback allows calculating how many years it takes to make the project cash flow equal to the investment amount. This method does not consider the current value of money. The difference between simple and discounted payback is that, in the second case, it is necessary to bring the entire cash flow (CF) to the present value (PV), according to equation (4), through a given interest rate (i) during the period
considered13.
PV = (1+i)CFn (4)
Another method used was the NPV, presented in equation (5), which explicitly considers the time value of money, calculating the present value of the cash flow over the period considered by means of an interest rate and discounting the initial cost of
the project14. In comparative terms, the payback equals the NPV when it becomes
equal to zero, that is, the payback corrected the investment.
NPV = - CF0+(1+i)CF11+ … +(1+i)CFnn (5)
Finally, the IRR represents the NPV equal to zero when the payback is reached, that is, the investment could be paid. The IRR considers the value of money over time and, after being calculated, is compared with the rate of return expected by the investment,
indicating whether or not the project is viable13. Through the "IRR" function of the
Excel software, the internal rate of return was obtained for the cases studied.
Capital Application
The savings generated after 25 years of GCPVS installation can be applied in a bank as a form of income. For the calculation of the saved balance, the fees of savings
account in a bank between 2010 to 201615 were considered, that is 7.22%. This value
was used as default rate of return for the next 25 years. The application of the savings in a bank was done yearly.
RESULTS
Performance Parameters
Figure 2 - Capacity Factor
Figure 3 - Final Yield
13.41%
14.06%
15.52%
12% 13% 13% 14% 14% 15% 15% 16% 16%
UTFPR's GO UTFPR's Neoville Residence
1,176.67
1,237.29
1,359.24
1.050 1.100 1.150 1.200 1.250 1.300 1.350 1.400
kW
h/k
W
p
Figure 4 - Performance Ratio
Economic Analysis
In order to evaluate the economic viability of the systems, it was necessary to undertake a study based on economic engineering tools, according to current rate model in Brazil. Table 4 shows the return on the initial investment time of the GCPVS studied.
Table 4 - Time to recover the capital invested in a GCPVS
Simple Payback Discounted Payback
UTFPR’s GO 7 years & 5 months 13 years & 3 months
UTFPR’s Neoville 8 years 15 years
Residence (Present) 7 years & 8 months 14 years & 1 month Residence (ICMS 16/15) 6 years & 5 months 10 years & 8 months
To calculate the simple payback, it was necessary to adopt a cash flow to control positive and negative cash flows of financial funds based on generation values, day and night energy consumption, COPEL rates with and without taxes, maintenance and operation costs, inverter exchanges and savings generated by the installation of the GCPVS. It can be noticed that the investment was paid at the moment when the cash flow becomes positive.
For the analysis of the discounted payback, the value of the average SELIC rate for the
years 2010 to 201616 was considered as the reference of the interest rate in
calculations, that is, 10.98%.
To calculate the NPV and IRR, the initial investment and the savings generated over 25 years were considered. The SELIC interest rate of 11.25% was adopted for the purpose of calculations, which was in force in April 2017 when the data of operation
of the GCPVS were collected16. The results of these indices can be seen in table 5.
74.33%
79.86%
87.66%
65% 70% 75% 80% 85% 90%
Table 5 - Economic Analysis of GCPVS
NPV IRR
UTFPR’s GO R$ 8,015.18 16.40%
UTFPR’s Neoville R$ 21,443.75 15.06%
Residence (Present) R$ 9,747.96 15.77%
Residence (ICMS 16/15) R$ 17,318.60 18.92%
Capital Application
The values saved in bank account at the end of 25 years after the installation of GCPVS are presented in figure 5.
Figure 5 - Economy after 25 years with GCPVS
In comparative terms, table 6 shows the savings obtained if the GCPVS´s investment value were applied directly in a bank account under the same rate of return.
Table 6 - Comparative of obtained economy
With GCPVS Without GCPVS
UTFPR’s GO R$ 204,748.76 R$ 78,553.64
UTFPR’s Neoville R$ 684,933.91 R$ 291,35.27
Residence (Present) R$ 272,740.79 R$ 109,130.12
Residence (ICMS 16/15) R$ 340,041.67 R$ 109,130.12
DISCUSSION
Regarding merit indicators, the capacity factor is adequate since it presents values between 13% and 18%, which comprise the percentage expected in Brazil.
R$100.000,00 R$200.000,00 R$300.000,00 R$400.000,00 R$500.000,00 R$600.000,00 R$700.000,00
irradiation rates become high, also maximizing the performance rate, which presents satisfactory indexes around the expected percentage of 75% for the GCPVS.
As for the period of return on investment, it is worth mentioning that in an economy where the annual adjustment of the electricity rate was higher, the return on investment would be anticipated. In addition, it can be seen that the GO and
residence’s payback occurs more quickly when compared to Neoville because the electric energy rate is higher in consumer units of subgroup B1 than in A4. In relation to the ICMS Agreement 16/15, the economy in the home becomes more attractive in this scenario since it exempts the payment of taxes when the consumer returns energy to the electricity grid.
In an application of the balance saved in the bank after the installation of the GCPVS, it is possible to notice that the economy over 25 years is bigger for the case of Neoville, because the installed power is higher when compared to the other systems, thus generating more electric power and more economy. If the GCPVS were not installed and the cost of the investment was applied to a bank account, at the end of 25 years the economy would be lower in all cases.
CONCLUSIONS
The GCPVS can be installed in buildings being an option to produce electricity, such as distributed generation, contributing to the increase of electricity availability in Brazil. Despite being considered a high-cost investment, the long-term economy can become advantageous to the consumer who installs the system due to the electric energy compensation system.
The performance parameters are adequate when compared to the period of operation of each system and it is possible to notice that the plants installed in 2016, both residential and Neoville, have higher performance when compared to an older plant, such as the Green Office.
The economic analysis served as a basis to prove the feasibility of the system’s project
for all the cases studied. Through the calculation of simple and discounted payback, the time required for the payment of the systems was lower than its lifespan, which is approximately 25 years. In relation to the NPV, it presented a positive value at the end of the analyzed period, indicating the viability of the project. From the point of view of the IRR, this was higher than the interest rate considered, the SELIC, indicating that the installation of the GCPVS system is viable.
REFERENCES
1. EPE - Empresa de Pesquisa Energética; Updated in 2016; Accessed in 2017. Demanda de Energia 2050. Available from:
http://www.epe.gov.br/Estudos/Documents/DEA%2013-15%20Demanda%20de%20Energia%2020 50.pdf.
2. ANEEL – Agência Nacional de Energia Elétrica; Updated in 2012; Accessed in 2017. Resolução Normativa nº 482. Available from:
http://www.aneel.gov.br/cedoc/ren2012482.pdf.
3. ANEEL – Agência Nacional de Energia Elétrica; Updated in 2015; Accessed in 2017. Resolução Normativa nº 687. Available from:
http://www2.aneel.gov.br/cedoc/ren2015687.pdf.
4. INMET – Instituto Nacional de Metereologia; Updated in 2017; Accessed in 2017. Estação Meteorológica de Observação de Superfície Automática. Available from: https://www.inmet.gov.br/portal/index.php?r=estacoes/estacoesAutomaticas. 5. Urbanetz Jr J. Energia Solar Fotovoltaica e o Desempenho dos SFVCR da UTFPR.
6. Urbanetz Jr J.; Casagrande Jr EF.; Tiepolo GM. Acompanhamento do Desempenho do Sistema Fotovoltaico Conectado à Rede Elétrica do Escritório Verde da UTFPR. [Monitoring the Performance of the Photovoltaic System Connected to the Power Grid
of UTFPR’s Green Office]. IX Congresso Brasileiro de Planejamento Energético; 2014;
Florianópolis.
7. Benedito RDS. Caracterização da geração distribuída de eletricidade por meio de sistemas fotovoltaicos conectados à rede, no Brasil, sob os aspectos técnico, econômico e regulatório. São Paulo: Universidade de São Paulo; 2009.
8. COPEL – Companhia Paranaense de Energia Elétrica; Updated in 2017; Accessed in 2017. Taxas e Tarifas. Available from: https: //goo.gl/kMwkNl.
9. Ambiente Energia; Updated in 2016; Accessed in 2017. 21 estados já aderiram a convênio que isenta geração distribuída de ICMS. Available from:
https://www.ambienteenergia.com.br/index.php/2016/08/21-estados-ja-aderiram-convenio-que-isenta-geracao-distribuida-de-icms/30123.
10. COPEL – Companhia Paranaense de Energia Elétrica; Updated in 2017; Accessed in 2017. Alterações Tarifárias. Available from: https://goo.gl/ xrtrT9.
11. Instituto Ideal – Instituto para o Desensolvimento de Energias Alternativas na América Latina; Updated in 2016; Accessed in 2017. O mercado brasileiro de geração distribuída fotovoltaica. Available from:
https://issuu.com/idealeco_logicas/docs/estudofv2016_final.
12. EPE – Empresa de Pesquisa Energética; Updated in 2012; Accessed in 2017. Análise da Inserção da Geração Solar na Matriz Elétrica Brasileira. Available from:
http://www.epe.gov.br/geracao/Documents/Estudos_23/NT_EnergiaSolar_2012.pdf. 13. Lemes Jr AB.; Cherobim APM.; Rigo CM. Fundamentos de finanças empresariais:
técnicas e práticas essenciais. 1. ed. Rio de Janeiro: LTC; 2015.
14 - Gitman, LJ. Princípios de administração financeira. 12. ed. São Paulo: Pearson; 2010. 15. Portal Brasil; Updated in 2017; Accessed in 2017. Caderneta de Poupança - Índices
Mensais. Available from: http://www.portalbrasil.net/poupanca_mensal.htm. 16. Banco Central do Brasil; Updated in 2017; Accessed in 2017. Histórico das Taxas de
Juros. Available from: https://www.bcb.gov.br/Pec/Copom/Port/taxaSelic.asp#nota.