1 Universidade Federal de Viçosa, Departamento de Nutrição e Saúde, Programa de Pós-Graduação em Ciência da Nutrição. Av. PH Rolfs, s/n., CCB-II, 36570-000, Viçosa, MG, Brasil. Correspondência para/Correspondence to: KBD MORAIS. E-mail: <[email protected]>.
2 Universidade Federal de Minas Gerais, Escola de Enfermagem, Departamento de Nutrição, Programa de Pós-Graduação em Nutrição e Saúde. Belo Horizonte, MG, Brasil.
Article based on the master’s thesis of KBD MORAIS, entitled “Capacidade preditiva de indicadores de adiposidade sobre o risco cardiometabólico em idosos de Viçosa (MG)”. Universidade Federal de Viçosa; 2014.
Support: Coordenação de Aperfeiçoamento de Pessoal de Nível Superior.
Como citar este artigo/How to quote this article
Morais KBD, Martinho KO, Franco FS, Pessoa MC, Ribeiro AQ. Predictive capacity of indicators of adiposity in the metabolic syndrome in elderly individuals. Rev Nutr. 2018;31(2):199-209. http://dx.doi.org/10.1590/1678-98652018000200006
Predictive capacity of indicators of
adiposity in the metabolic syndrome
in elderly individuals
Capacidade preditiva de indicadores de
adiposidade sobre a síndrome
metabólica em idosos
Keila Bacelar Duarte de MORAIS1 0000-0002-4754-3796
Karina Oliveira MARTINHO1 0000-0001-9978-0112
Fernanda Silva FRANCO1 0000-0002-3880-3584
Milene Cristine PESSOA2 0000-0002-1053-5450
Andréia Queiroz RIBEIRO1 0000-0001-6546-1252
A B S T R A C T
Objective
To evaluate the predictive ability of adiposity indicators as MetS predictors in elderly individuals.
Methods
classified according to the harmonizing criteria. The predictive ability of anthropometric variables was evaluated using Receiver Operating Characteristic curves.
Results
Regarding male individuals, our research indicates that the BMI, Waist-Height Ratio and Waist Hip Ratio are better predictors and they are equivalent to each other. As for female individuals, results show that the Body Mass Index and Waist-Height Ratio are better predictors and equivalent to each other.
Conclusion
Waist-Height Ratio and Body Mass Index are good MetS predictors for elderly individuals, especially among men. More research in this area is important. Comitê de Ética em Pesquisa com Seres Humanos da Universidade Federal de Viçosa. (Viçosa University Ethics Committee in Research with Human Beings) (nº 039/2011).
Keywords: Aging. Cutoff Points. Elderly individuals. Metabolic Syndrome. Obesity.
R E S U M O
Objetivo
Este estudo objetivou avaliar a capacidade preditiva dos indicadores de adiposidade como preditores da Síndrome Metabólica em idosos.
Métodos
Trata-se de estudo transversal com idosos inscritos na Estratégia Saúde da Família. Foram aferidas medidas antropométricas e calculados o Índice de Massa Corporal, a Relação Cintura-Quadril, a Relação Cintura-Estatura, o Índice de Conicidade e o Índice de Adiposidade Corporal. Foi coletada amostra sanguínea e aferida a pressão arterial de repouso. A Síndrome Metabólica foi classificada de acordo com os Critérios Harmonizados. A capacidade preditiva das variáveis antropométricas foi avaliada por meio das curvas Receiver Operating Characteristic.
Resultados
Para o sexo masculino, o Índice de Massa Corporal, a Relação Cintura-Estatura e a Relação Cintura-Quadril são melhores preditores e equivalentes entre si. Já para o sexo feminino, os dois primeiros são melhores preditores e equivalentes entre si.
Conclusão
Concluiu-se que o Índice de Massa Corporal e a Relação Cintura-Estatura são bons preditores da Síndrome Metabólica em indivíduos idosos, especialmente entre homens. Mais investigações nesse âmbito se fazem importantes. Comitê de Ética em Pesquisa com Seres Humanos da Universidade Federal de Viçosa. (nº 039/2011).
Palavras-chave: Envelhecimento. Pontos de Corte. Idosos. Síndrome Metabólica. Obesidade.
I N T R O D U C T I O N
The Metabolic Syndrome (MetS) is recognized by the occurrence of multiple metabolic abnormalities [1,2]. Although there is little data available on the prevalence of MetS in the elderly population both in Brazil and in a global scale [3], it is known that the prevalence increases with age [2,3]. Detecting metabolic disorders – preferably early – is essential to prevent and delay the onset of cardiovascular diseases, including MetS, and to guide their treatment [4-7].
Studies have suggested the use of body measurements to assess adiposity [4,8]. This is an important fact, since age-associated increases in central fat distribution correlate with metabolic and cardiovascular abnormalities [3,6].
individuals. However, there is still no consensus about which adiposity indicator is the best predictor of cardiovascular events resulting from body fat accumulation within this age group [5,8-11].
Studies have identified associations among adiposity indicators, adverse health events, and cardiometabolic risk in elderly individuals. However, few studies investigating appropriate cutoff points of such indicators as predictors of cardiovascular diseases have been performed, and very few have specifically addressed MetS in elderly individuals [4,9,12,13].
The current study aims to evaluate the predictive capacity of adiposity indicators to predict MetS in elderly men and elderly women and to determine specific cutoff points regarding this population.
M E T H O D S
It is a cross-sectional study conducted in all Estratégia Saúde da Família (Family Health
Strategy, FHS) units in Viçosa (MG), from August
2011 to June 2012, including its urban and rural areas.
The study fully met the standards regarding research involving human beings, Resolution 196/96 of the National Health Council from 10/10/1996 and the Helsinki Resolution. The research project was approved
by the Comitê de Ética em Pesquisa com Seres
Humanos da Universidade Federal de Viçosa
(Viçosa University Ethics Committee in Research with Human Beings) (nº 039/2011).
The sample size calculation considered a 95% confidence level, a 65% MetS prevalence [1] and a 5% tolerated error. Thus, the sample comprised 331 elderly individuals, to which 20% was added to cover possible losses, in a total of 398 individuals. The final sample consisted of 402 people. The sample size calculation was performed using Epi-Info 3.5.1 software (CDC – Center of Disease Control and Prevention, Georgia, United State of America).
The inclusion criteria for participation in the study were that the volunteers had to be 60 years old or above, registered in the Family Health Strategy, and that they had to attend the two meetings in conducting the study.
Data collection was performed in all the Family Health Strategy during two meetings. In the first meeting, participants were informed about the research goals and signed the Informed Consent Form. Subsequently, a questionnaire was completed to collect
participants’ sociodemographic features. Then,
anthropometric assessment was obtained.
Weight and height were measured as recommended by the World Health Organization
(WHO) [14]. The volunteers’ weight was measured
using a digital electronic scale from Kratos®
(Kratos Equipamentos Industriais, Cotia, São
Paulo, Brazil) of 150kg capacity and 50g of weight sensitivity. Their height was obtained using the millimetric vertical anthropometer
from Welmy®, (Welmy, Santa Barbara d´Oeste,
São Paulo, Brazil) with a maximum height of 2m, divided into centimeters and subdivided into millimeters. A trained professional measured
the participants’ waists and hips three times and
calculated the mean value. These measurements were obtained by using a millimeter graduated
inextensible tape measure from Cardiomed®
(Curitiba, Paraná, Brazil), as recommended by the WHO [15].
From these measurements, the anthropometric indices were calculated: Body Mass Index (BMI), Waist-Hip Ratio (WHR), Waist-to-Height Ratio (WHeR), Conicity Index (CoI) and Body Adiposity
Index (BAI). The volunteers’ nutritional status
was classified by their BMI according to Lipschitz [16].
sphygmomanometer from Tycos®, model EC 048 (Tyco Fire Products LP, Pennsylvania, United States of America) The VII Brazilian Guidelines on Arterial Hypertension [17] recommendations were followed. Biochemical analyses were
performed in the Laboratório de Biofarmacêutica
do Departamento de Bioquímica e Biologia Celular Universidade Federal de Viçosa. (Viçosa University - Biopharmaceutical Laboratory of the Department of Biochemistry and Cell Biology).
Elderly individuals were classified as syndromic according to the Joint Interim Statement (JIS) [18] harmonizing criteria. The outcome variable was the presence of three or more than five components of the metabolic syndrome.
Data analysis was initially performed by frequency distribution and estimation of central and dispersion tendencies. The mean values and ratios of sociodemographic and anthropometric variables were compared according to the individual’s sex. As for the quantitative variables, a Shapiro-Wilk normality test was carried out. Variables without normal distribution were
transformed into a logarithm. Both a student’s
test and a Pearson’s chi-square test were
used in this stage, taking under consideration the significance level =0.05. The prevalence of changes in MetS components was also estimated according to sex.
The predictive ability of adiposity indicators as well as the cutoff points were established by Receiver Operating Characteristic (ROC) curve analysis. The total Area Under the ROC Curve (AUC) and the respective confidence intervals (95% CI) were also determined. The difference between the curves generated from each indicator was compared using a Z-statistics test. Sensitivity (SE), Specificity (ES), Positive (PPV) and Negative (NPV) predictive values were also calculated for each indicator. The best cutoff point corresponded to the anthropometric indicator value that presented the greatest accuracy. Statistical analyses were conducted through STATA 13.0 software (StataCorp LLC, College Station, Texas, United State of America).
R E S U L T S
Four hundred and two elderly individuals were evaluated, 60.4% of them were women. Their average age was of 72.8±7.0 years among women and 71.2±7.0 years among men. The Tables 1 and 2 show the socioeconomic and anthropometric characteristics stratified by sex evaluated in the study.
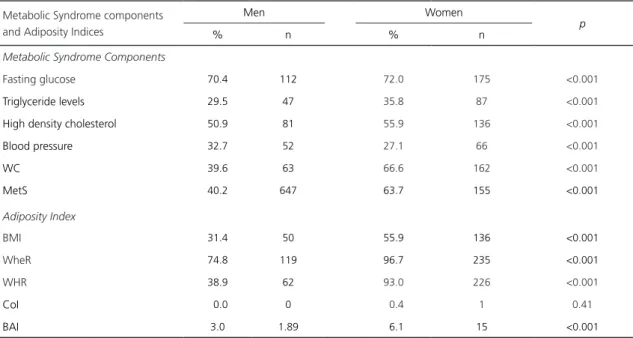
Table 3 shows the frequency of altered components of MetS and in the adiposity indicators. There was a high frequency of altered biochemical components, especially fasting glucose, HDL and blood pressure. Differences between sexes were statistically significant. WC measurement showed higher levels of
alteration in women (p<0.001). Regarding the
anthropometric indicators, only CoI and BAI showed lower levels of alteration among elderly individuals. As for the others, the frequency was high, especially among women, and the
differences were significant (p<0.001). The
MetS prevalence was 54.8% (95.0% CI:49.0% - 59.0%), 40.3% (95% CI:32.0% - 47.0%) in men and 63.8% (95% CI:57.0% - 69.0%) in
women (p<0.001).
Table 4 shows the anthropometric variables’
predictive ability regarding MetS in both sexes. In men, the evaluation of the predictive ability of adiposity indicators and body composition showed that all the indicators presented good predictive ability; however, BMI, WHeR and WHR were the best predictors and they were equivalent to each other, thus showing a higher area under the ROC curve (AUC).
Table 1. Sociodemographic features of the elderly assisted by the Health Strategy Family Program in Viçosa (MG), 2012.
Variables Total Men Women p*
n % n % N %
Marital Status
Married 228 57 122 76.7 106 43.6 <0.01
Divorced/ widowed/ single 174 43 37 23.3 137 56.4
Ethnicity
White 109 27.1 41 25.8 68 28 0.77
Brown 196 48.7 81 50.9 115 7.4
Black 97 24.2 37 23,3 60 24.6
Work
Active 117 29.2 53 33.3 64 26.6 0.14
Not active 283 70,8 106 66.7 177 73.4
Own housing
Yes 371 92.3 147 92.3 224 92.2 0.92
No 31 7.7 12 7.7 19 7.8
Schooling
Illiterate 111 27.6 36 22.7 75 30.9 0.16
1- 4 years of study 234 58.2 97 61 137 56.4
5 or more years of study 57 14.2 26 16.3 31 12.7
Note: *Pearson Chi-Square test.
Table 2. Mean, standard deviation of the anthropometric variables in elderly enrolled in the Family Health Strategy Program in Viçosa
(MG), 2012.
Variables
Men (n=159) Women (n=243)
p*
Mean SD Mean SD)
Age (years) 71.2 7.0 72.8 7.0 0.02
Weight (kg) 69.2 12.6 62.8 11.4 <0.001
Height (m) 1.65 6.7 1.5 6.4 <0.001
BMI (kg/m²) 25.3 4.1 27.6 4.6 <0.001
WC (cm) 92.0 11.6 94.3 11.5 <0.001
HC (cm) 94.5 6.8 98.0 8.9 <0.001
WHR 0.9 0.0 0.9 0.0 0.19
WheR 0.5 0.0 0.6 0.0 <0.001
CoI 1.3 0.0 1.3 0.1 <0.001
BAI 20.2 2.7 25.3 4.0 <0.001
Note: *t student test. SD: Standard Deviation; BMI: Body Mass Index; WC: Waist Circumference; WHR: Waist-Hip Ratio; WHeR: Waist-Height
Ratio; CoI: Conicity Index; BAI: Body Adiposity Index.
similar among all the indicators. Specificity was higher in CoI, WHR and BAI. NPV was higher in WHeR and in BMI.
Table 3. Frequency of MetS components and high anthropometric parameters according to sex. Viçosa (MG), 2012.
Metabolic Syndrome components and Adiposity Indices
Men Women
p
% n % n
Metabolic Syndrome Components
Fasting glucose 70.4 112 72.0 175 <0.001
Triglyceride levels 29.5 47 35.8 87 <0.001
High density cholesterol 50.9 81 55.9 136 <0.001
Blood pressure 32.7 52 27.1 66 <0.001
WC 39.6 63 66.6 162 <0.001
MetS 40.2 647 63.7 155 <0.001
Adiposity Index
BMI 31.4 50 55.9 136 <0.001
WheR 74.8 119 96.7 235 <0.001
WHR 38.9 62 93.0 226 <0.001
CoI 0.0 0 0.4 1 0.41
BAI 3.0 1.89 6.1 15 <0.001
Note: *Pearson Chi-Square test.
WC: Waist Circumference; MetS: Metabolic Syndrome; BMI: Body Mass Index; WHeR: Waist-Height Ratio; WHR: Waist-Hip Ratio; CoI: Conicity Index; BAI: Body Adiposity Index.
Table 4. The predictive ability of adiposity indicators of metabolic syndrome in elderly men and women enrolled in the Health
Strategy Family Program. Viçosa (MG), 2012.
Predictive Variables AUC* (CI95%) Cutoff points SE** (CI95%) ES** (CI95%) PPV** NPV**
Men¹
BMI 0.87 (0.81 – 0.92) 24.75 89,06 (78,7 - 95,5) 63,16 (63,6 - 82,2) 69.50 90.90
WHeR 0,87 (0 ,81 –0,92) 0.55 92,19 (82,7 - 97,4) 69,47 (60,3 - 79,4) 67.00 93.00
WHR 0,86 (0,79 – 0,91) 0.98 81,25 (64,3 - 86,2) 75,79 (72,9 - 89,2) 69.30 85.70
CoI 0,81 (0,74 – 0,87) 1.32 71,87 (60,9 - 83,7) 76,84 (67,1 - 84,9) 67.60 80.20
BAI 0,75 (0,68 – 0,82) 20.28 76,56 (64,3 - 86,2) 71,58 (61,4 - 80,4) 64.50 81.90
Women²
BMI 0,71 (0,65 – 0,76) 23.73 89,68 (88,5 - 96,9) 42,05 (28,4 - 49,6) 73.20 69.80
WHeR 0,69 (0,63 – 0,75) 0.59 77,92 (70,5 - 84,2) 53,41 (42,5 - 64,1) 74.50 58.00
WHR 0,66 (0,60 – 0,72) 0.97 51,61 (44,7 - 61,0) 72,73 (62,2 - 81,7) 76.90 46.00
CoI 0,62 (0,56 – 0,68) 1.32 69,03 (59,1 - 74,4) 52,27 (44,7 - 66,3) 71.80 48.90
BAI 0,63 (0,57 – 0,69) 24.01 71,61 (63,8 - 78,6) 52,27 (41,4 - 63,0) 72.50 51.10
Note: *Z test for comparison between areas under the curves – p<0.001 for males and p=0,002 for females. **Percentage. Comparison of
predictive ability of BMI, WHeR, WHR, CoI and BAI for MetS based on sex.
1Men: statistical difference between the area under the curve: BMI x WHeR (p=0.857), BMI x WHR (p=0.721), WHeR x WHR (p=0,505), WHeR x CoI
(p=0,016), WHeR x BAI (p<0,001), CoI x BAI (p=0,174), WHR x CoI (p=0,053), WHR x BAI (p=0.0151), BMI x CoI (p=0,127), BMI x BAI (p<0,001),
BMI x WHR x CoI (p=0,076), BMI x WHR x BAI (p<0,001), BMI x WHR x WHeR (0,784). ²Women: BMI x WHeR (p=0.538), BMI x WHR (p=0.233),
WHeR x WHR (p=0.307), WHeR x CoI (p=0,011), WHeR x BAI (p=0,021), CoI x BAI (p=0,711), WHR x CoI (p=0.075), WHR x BAI (p=0.620), BMI
x CoI (p=0.041), BMI x BAI (p<0,001), BMI x WHR x CoI (p=0.067), BMIx WHR x BAI (p<0,001), BMI x WHR x WHeR (p=0.558).
AUC: Receiver Operating Characteristic Curves Analysis; CI: Confidence Interval; SE: Sensitivity; ES: Specificity; PPV: Positive Predictive Value; NPV:
were statistically different from BAI and CoI, which presented a lower AUC and a lower discriminatory ability. WHR did not differ from any indicator.
BMI and WHeR were the most sensitive indicators in MetS diagnosis. The other indicators showed similar sensitivity values, except for WHR. Although WHR showed greater PPV, all the indices showed close values to each other. The most specific indicator was WHR and the biggest NPV was BMI, whereas the other indicators showed similar SE and NPVs.
D I S C U S S I O N
The study showed a MetS prevalence of 54.8% in elderly individuals (95.0% CI:49.0% - 59.0%); this prevalence was significantly higher among women. A Brazilian study of 243 elderly individuals (whose average age was 71±7 years for women and 70±7 years for men),
predominantly female (74.0%), conducted in Rio
de Janeiro, revealed a higher overall prevalence of MetS using the same criterion diagnosis, 69.1%. In the present study, the prevalence of MetS among men and women was similar, but in comparison, the prevalence among men was higher than that found in the present study, 69.8%, and similar in relation to the female subjects, 68.9% [19]. Research in Taiwan evaluated a cohort of 18,916 elderly individuals divided into three age subgroups using the Joint Interim Statement (JIS) criterion. It evidenced the increasing prevalence of MetS and its components among the age groups, particularly among women [3].
The predictive ability of adiposity indicators on MetS occurrence in men showed that although the WHeR and BMI indices have shown higher values of area under the ROC curve, the differences were not significant. The considered indices showed satisfactory and similar capacity to discriminate MetS.
In women, the predictive ability of anthropometric variables was lower than that
found in men. All the indices showed moderate predictive ability and were equivalent to each other, since no AUC exceeded 0.8.
Chu et al. [20] evaluated the predictive ability of anthropometric indicators regarding MetS in elderly female adults women and found an AUC lower than 0.8 in WHeR, WHR, BMI and WC. They attributed the low predictive ability to the average age of women, approximately 72 years old. This age group has a high probability of having other cardiometabolic risk factors besides body adiposity; indicators that rely on body fat may be less predictive for this reason.
Other studies [3,20] showed age and menopause as independent MetS predictors in elderly women, since the presence of MetS components increased with aging and menopausal status. According to the current study, the best MetS predictor cutoff points in WheR were 0.55 (men) and 0.59 (women). These values were higher than those recommended for adults in literature (0.5) [21]. A major age-stratified MetS study performed in employees from a Chinese company found that the WHeR cutoff point (0.53) in elderly men was similar to that found in the current study. However, they found an AUC of 0.6, lower than the one found in the current research [21]. Another study on Iranian elderly men identified a higher cutoff point than the one found in the present study, 0.58 (AUC=0.68; 95% CI:0.60 - 0.75)
[4]. A study conducted in Salvador, Brazil, with
203 elderly individuals residing in a long-term
institution in Salvador, identified a cut-off point
for the MetS predictor WHeR equal to that of the present study for males, 0.55 (AUC=0.89, 95% CI:0.71-0.98), with sensitivity and specificity values of 0.92 and 0.90, respectively [11].
Regarding women, the Chinese study found a lower cutoff point, 0.55 (AUC=0.615). The current study, despite having identified a higher cutoff point, obtained the best area under the ROC curve. This study, conducted on
WHR cutoff point of 0.6 (AUC=0.67; 95.0% CI:0.58 - 0.76) in MetS, with a sensitivity of 73.3% [22], a similar result to the one found in the present study (0.59). In another Brazilian
study with institutionalized elderly in Salvador,
the sample consisted of 77.8% women, showing a lower cutoff point, 0.54 (AUC=0.856, CI 95.0%: 0.78-0.91), sensitivity of 0.84 and specificity of 0.78 [11].
WHeR is based on the assumption that height influences body fat accumulation and distribution [23] as well as WC size, over time [24]. Hence, changes associated with aging, such as reduced height and abdominal fat deposition may influence WHeR results differently in elderly age groups [14,22]. As an indicator of central adiposity and given the natural changes to the body composition of the elderly, the cutoff point higher than the recommended for young adults seems to predict cardiometabolic changes in this population.
Regarding the BMI, the cutoff point evidenced by the current study to predict MetS was 24.75kg/m² in men and 23.73kg/m² in women. It is an index that discriminates the nutritional status, adiposity and is associated with the risk of cardiovascular diseases. The results found in the present study for both sexes were lower than the value proposed by Lipschitz [16] for elderly individuals, and lower than the value presented by The Pan American Health Organization (PAHO) [25] for adults. However, findings in the literature show consistent values
with those found in the present study. Wang et
al. [24] identified the cutoff point of 23.93kg/m²,
but with a lower AUC value, 0,65 (95% CI:0.64 - 0.66) in men. As for elderly women, they found the value of 24.15kg/m², (AUC=0.64; 95% CI: 0.61 - 0.67).
Gharipour et al. [4] identified 26.65kg/
m² in elderly men, with a lower AUC value, 0,64 (95% CI:0.56- 0.72), sensitivity of 48% and specificity of 76%.
The cutoff points identified in this study are lower than those indicated for the elderly
and adult populations. Body fat accumulation and lean body mass decreases may induce an increase or a decrease regarding body mass measurements and, consequently, in BMI values. This index does not properly distinguish fat mass and lean mass. It may be less useful as an adiposity indicator among elderly people, who have more body fat at a given BMI, than it is among young individuals, due to age-related body mass reduction. Thus, BMI cannot be used as a single estimate of obesity or body fat mass in elderly individuals; it is an indicator of total body weight regarding height [8,26].
The epidemiological investigation found that an increasing BMI and abdominal fat is mainly associated with high fasting glucose, triglyceride levels and blood pressure, and reduced HDL levels. Thus, a greater MetS frequency was observed in the group of overweight and obese individuals [27].
The WHR anthropometric index also proved to be useful in predicting MetS, and showed the best cutoff points: 0.98 (AUC=0.86; 95% CI:0.79 - 0.91) and 0.97 (AUC=0.66; 95% CI:0.60 - 0.73) in men and women, respectively. Regarding men, the cutoff point found in this study was lower than that suggested for adults by the WHO [15] (1.0). The cutoff point identified for women was higher than that recommended by the WHO [15] (0.85).
The study on Chinese elderly women showed a similar cutoff point to the one aimed at adults, 0.86 (AUC=0.58; 95% CI:0.55 - 0.61) [21]. Accordingly, two studies that evaluated samples from elderly individuals and adult women identified cutoff points of 0.84 and 0.87 [28,29].
Gharipour et al. [4] found a similar value
(0.95) to that which was found in the present study, with an AUC of 0.64, sensitivity of 69%
and specificity of 29%. Wang et al. (2009) [24]
WHR is a useful parameter in the evaluation of body fat distribution. WC and HC reflect different aspects of body composition and configure independent and opposite results in determining the risk of cardiometabolic diseases and risk factors. Thus, narrow waists and wide hips are associated with protection against cardiometabolic diseases. The literature suggests that WHR may be a less valid measure, since this indicator does not detect waist and hip proportional changes [30].
CoI and BAI were considered satisfactory MetS predictors among men and weak predictors among women. Regarding CoI, the widely used reference, intended for adults, it indicates values above 1.73 as risk of developing cardiovascular diseases [31].
The main studies performed to identify the association between CoI and cardiometabolic risk factors were conducted by Pitanga and collaborators in Brazil [12,32]. However, their sample was mainly composed of adults and a few elderly individuals, and it was not stratified by age to investigate the predictive ability of anthropometric indicators on high coronary risk.
A study conducted in Viçosa (MG) comprising
113 elderly women obtained the same mean CoI found in the present study, which is similar to the identified cutoff point [22].
BAI is a recent anthropometric indicator, which was suggested as an alternative parameter to BMI in body fat assessment and it reflects a direct estimate of body fat percentage. The authors did not propose a cutoff point for this index. There is still controversy about its effectiveness in adiposity assessment [33,34].
The present study found the BAI cutoff point of 20.28% in elderly men and 24.01% in elderly women. Studies have found that BAI overestimates obesity in men and shows slight underestimation in women [33,34] regarding the ability to discriminate individuals with higher or lower fat percentage. Further studies are needed to assess BAI effectiveness as well as
the determinations of sensitive cutoff points in elderly individuals.
It is possible to see that the cutoff points found in the current study for anthropometric measurements in male and female elderly corroborate other findings in the literature. However, the differences found among values may be attributed to regional ethnic differences that influence people’s life habits and determine peculiarities in the individuals’ body composition [34].
This study’s strength was the fact that
a single trained professional performed all the anthropometric measurements, thus minimizing inter and intrapersonal variations.
Some limitations should be mentioned. The first concerns the sample representativeness, which does not comprise all elderly individuals
from Viçosa, since the source population was
composed of people enrolled in the FHS Program. Several diagnostic criteria suggested by different organizations to classify MetS showed differences in their components and/or in the adopted cutoff point values. It is difficult to compare these studies.
C O N C L U S I O N
WHeR and BMI are good MetS predictors among elderly individuals, especially among men. Regarding CoI and BAI, further studies are needed to elucidate the importance of these indicators in predicting MetS among elderly individuals.
It was observed that the cutoff points of anthropometric indicators identified in elderly women were higher, therefore more specific than those suggested for younger adults. The cutoff points identified in elderly men were lower, thus more sensitive in comparison to those recommended for younger adults.
in clinical practice since they are simple to use, non-invasive, low cost and are relatively easy to interpret.
C O N T R I B U T O R S
KBD MORAIS, AQ RIBEIRO contributed to all stages of conception and design of this study. KO MARTINHO, FS FRANCO and MC PESSOA contributed to the analysis of results and manuscript writing.
R E F E R E N C E S
1. Martinho KO, Dantas EHM, Longo GZ, Ribeiro AQ, Pereira ET, Franco FS, et al. Comparison of functional autonomy with associated sociodemographic factors, lifestyle, chronic diseases (CD) and neuropsychiatric factors in elderly patients with or without the metabolic syndrome (MS). Arch Gerontol Geriatr. 2013;57(2):151-5. http://dx.doi. org/10.1016/j.archger.2013.04.005
2. Hu H, Kurotani K, Sasaki N, Murakami T, Shimizu C, Shimizu M, et al. Optimal waist circumference cut-off points and ability of different metabolic syndrome criteria for predicting diabetes in Japanese men and women: Japan epidemiology collaboration on occupational health study. BMC Public Health. 2016;16(1):220. http://dx.doi.org/10. 1186/s12889-016-2856-9
3. Chuang T-J, Huang C-L, Lee C-H, Hsieh C-H, Hung Y-J, Hung C-F, et al. The differences of metabolic syndrome in elderly subgroups: A special focus on young-old, old-old and oldest old. Arch Gerontol Geriatr. 2016;65:92-7. http://dx.doi.org/10.1016/j. archger.2016.03.008
4. Gharipour M, Sadeghi M, Dianatkhah M, Bidmeshgi S, Ahmadi A, Tahri M, et al. The cut-off values of anthropometric indices for identifying subjects at risk for metabolic syndrome in Iranian elderly men. J Obes. 2014;2014:6. http://dx.doi.org/10. 1155%2F2014%2F907149
5. Corrêa MM, Thumé E, De Oliveira ERA, Tomasi E. Performance of the waist-to-height ratio in identifying obesity and predicting non-communicable diseases in the elderly population: A systematic literature review. Arch Gerontol Geriatr. 2016;65:174-82. http://dx.doi.org/10.1016/j.archger.2016.03.021
6. Macias N, Quezada AD, Flores M, Valencia ME, Denova-Gutiérrez E, Quiterio-Trenado M, et al. Accuracy of body fat percent and adiposity indicators cut off values to detect metabolic risk factors in a sample of Mexican adults. BMC Public Health. 2014;14(1):341. http://dx.doi.org/10.1186/1471-24 58-14-341
7. Santos PCM, Ferreira ALL, Mori RMSC. Frequência da Síndrome Metabólica em idosos cadastrados no Programa Saúde do Idoso de uma Unidade Municipal de Saúde de Belém-PA. Rev Assoc Bras Nutr. 2017 [acesso 2017 mar 3];8(1):75-81. Disponível em: https://rasbran.emnuvens.com.br/ rasbran/article/view/338/162
8. Delvarianzadeh M, Abbasian M, Khosravi F, Ebrahimi H, Ebrahimi MH, Fazli M. Appropriate anthropometric indices of obesity and overweight for diagnosis of metabolic syndrome and its relationship with oxidative stress. Diabetes Metab Syndr: Clin Res Rev. 2017;11:S907-S11.
9. Wang H, Liu A, Zhao T, Gong X, Pang T, Zhou Y, et al. Comparison of anthropometric indices for predicting the risk of metabolic syndrome and its components in Chinese adults: A prospective, longitudinal study. BMJ Open. 2017;7(9):e016062. http://dx.doi.org/10.1136/bmjopen-2017-016062 10. Oliveira CC, Costa ED, Roriz AKC, Ramos
LB, Gomes Neto M. Predictors of Metabolic Syndrome in the elderly: A review. Int J Cardiol Sci. 2017;30(4):343-53. http://dx.doi.org/10.59 35/2359-4802.20170059
11. Oliveira CC, Roriz AKC, Ramos LB, Neto MG. Indicators of adiposity predictors of Metabolic Syndrome in the elderly. Ann Nutr Metab. 2017 [cited 2017 Mar 25];70(1):9-15. Available from: https://www.ncbi. nlm.nih.gov/pubmed/28103600?dopt=Abstract
12. Haun DR, Pitanga FJG, lessa I. Razão cintura/estatura comparado a outros indicadores antropomé-tricos de obesidade como preditor de risco coronariano elevado. Rev Assoc Med Bras. 2009;55(6):705-11. http://dx.doi.org/10.1590/S0104-42302009000 600015
13. Fogal AS, Ribeiro AQ, Priori SE, Franceschini SCC. Prevalência de síndrome metabólica em idosos: uma revisão sistemática. Rev Assoc Bras Nutr. 2014 [acesso 2017 abr 8];6(1):29-35. Disponível em: https://rasbran.emnuvens.com.br/rasbran/article/ viewFile/174/126
14. World Health Organization. Physical status: The use and interpretation of anthropometry: Report of a WHO Expert Committee. Geneva: World Health Organization; 1995 [cited 2017 Apr. 8]. Available from: http://www.who.int/iris/handle/1 0665/37003
15. World Health Organization. Obesity: Preventing and managing the global epidemic. Report of the WHO Consultation on Obesity. Geneva: WHO; 1998. 16. Lipschitz DA. Screening for nutritional status
in the elderly. Prim Care. 1994 [cited 2017 May 17];21(1):55. Available from: https://www.ncbi.nlm. nih.gov/pubmed/8197257
Disponível em: http://publicacoes.cardiol.br/2014/ diretrizes/2016/05_HIPERTENSAO_ARTERIAL.pdf
18. Alberti KG, Eckel RH, Grundy SM, Zimmet PZ, Cleeman JI, Donato KA, et al. Harmonizing the metabolic syndrome: A joint interim statement of the International Diabetes Federation Task Force on Epidemiology and Prevention; National Heart, Lung, and Blood Institute; American Heart Association; World Heart Federation; International Atherosclerosis Society; and International Association for the Study of Obesity. Circulation. 2009;120(16):1640-5. http://dx.doi.org/10.1161/ CIRCULATIONAHA.109.192644
19. Saad MAN, Cardoso GP, Martins WA, Velarde LGC, Cruz Filho RA. Prevalence of Metabolic Syndrome in elderly and agreement among four diagnostic criteria. Arq Bras Cardiol. 2014;102(3):263-9. http://dx.doi.org/10.5935%2Fabc.20140013
20. Chu FL, Hsu CH, Jeng C. Low predictability of anthropometric indicators of obesity in metabolic syndrome risks among elderly women. Arch Gerontol Geriatr. 2012;55(3):718-23. http://dx.doi. org/10.1016/j.archger.2012.02.005
21. Hsieh SD, Yoshinaga H. Waist/Height Ratio as a simple and useful predictor of coronary heart disease risk factors in women. Intern Med. 1995;34(12):1147-52. http://dx.doi.org/10.2169/ internalmedicine.34.1147
22. Paula HAA, Ribeiro RCL, Rosado LEFPL, Pereira RSF, Franceschini SCC. Comparação de diferentes critérios de definição para diagnóstico de síndro-me síndro-metabólica em idosas. Arq Bras Cardiol. 2010;95(3):346-53. http://dx.doi.org/10.1590/S006 6-782X2010005000100
23. Eshtiaghi R, Esteghamati A, Nakhjavani M. Menopause is an independent predictor of metabolic syndrome in Iranian women. Maturitas. 2010;65(3):262-6. http://dx.doi.org/10.1016/j.maturitas.2009.11.004
24. Wang F, Wu S, Song Y, Tang X, Marshall R, Liang M, et al. Waist circumference, body mass index and waist to hip ratio for prediction of the metabolic syndrome in Chinese. Nutr Metab Cardiovasc Dis. 2009;19(8):542-7. http://dx.doi. org/10.1016/j.numecd.2008.11.006
25. Organización Panamericana de la Salud. División de Promoción y Protección de la Salud. Encuesta multicentrica salud bienestar y envejecimiento (SABE) en América Latina: informe preliminar / Multicenter survey aging, health and wellbeing in Latin América and the Caribbean (SABE): preliminary report. Presentado en: Reunión del Comité Asesor de Investigaciónes en Salud 2001 [acceso 2017 jun 2];36. Disponible en: http:// www1.paho.org/Spanish/HDP/HDR/CAIS-01-05. PDF
26. Jahanlou AS, Kouzekanani K. The accuracy of Body Mass Index and Gallagher’s Classification in detecting obesity among Iranians. Iran J Med Sci. 2016 [cited 2017 Jul 18];41(4):288-95. Available from: http://www.ncbi.nlm.nih.gov/pmc/articles/ PMC4912647/
27. Ortiz-Rodríguez MA, Yáñez-Velasco L, Carnevale A, Romero-Hidalgo S, Bernal D, Aguilar-Salinas C, et al. Prevalence of metabolic syndrome among elderly Mexicans. Arq Bras Cardiol. 2017 [cited 2017 Aug 2];73:288-93. Available from: https:// www.ncbi.nlm.nih.gov/pubmed/28910752
28. Almeida RT, Almeida MMG, Araújo TM. Obesidade abdominal e risco cardiovascular: desempenho de indicadores antropométricos em mulheres. Arq Bras Cardiol. 2009;92(5):375-80. http://dx.doi. org/10.1590/S0066-782X2009000500007
29. Gharakhanlou R, Farzad B, Agha-Alinejad H, Steffen LM, Bayati M. Medidas antropométricas como preditoras de fatores de risco cardiovascular na população urbana do Irã. Arq Bras Cardiol. 2012;98(2):126-35. http://dx.doi.org/10.1590/S00 66-782X2012005000007
30. Vasques ACJ, Rosado LEFPL, Rosado GP, Ribeiro RCL, Franceschini SCC, Geloneze B, et al. Dife-rentes aferições do diâmetro abdominal sagital e do perímetro da cintura na predição do HOMA-IR. Arq Bras Cardiol. 2009;93(5):511-8. http://dx.doi. org/10.1590/S0066-782X2009005000001
31. Valdez R, Seidell JC, Ahn YI, Weiss KM. A new index of abdominal adiposity as an indicator of risk for cardiovascular disease: A cross-population study. Int J Obes Relat Metab Disord. 1993 [cited 2017 Aug 7];17(2):77-82. Available from: https:// www.ncbi.nlm.nih.gov/pubmed/8384168
32. Pitanga FJG, Lessa I. Razão cintura-estatura como discriminador do risco coronariano de adultos. Rev Assoc Med Bras. 2006;52(3):157-61. http:// dx.doi.org/10.1590/S0104-42302006000300016 33. López AA, Cespedes ML, Vicente T, Tomas M,
Bennasar-Veny M, Tauler P, et al. Body Adiposity Index utilization in a Spanish mediterranean population: Comparison with the Body Mass Index. PLoS One. 2012;7(4):e35281. http://dx.doi. org/10.1371%2Fjournal.pone.0035281
34. Bennasar Veny M, Lopez Gonzalez AA, Tauler P, Cespedes ML, Vicente Herrero T, Yañez A, et al. Body Adiposity Index and cardiovascular health risk factors in Caucasians: A comparison with the Body Mass Index and others. PLoS One. 2013;8(5):e63999. http://dx.doi.org/10.1371%2 Fjournal.pone.0063999