www.ecography.org
ECOGRAPHY
Ecography
––––––––––––––––––––––––––––––––––––––––
© 2020 The Authors. Ecography published by John Wiley & Sons Ltd on behalf of Nordic Society Oikos Subject Editor: Michel Baguette
Editor-in-Chief: Miguel Araújo Accepted 1 July 2020
43: 1–9, 2020
doi: 10.1111/ecog.05066
43 1–9
Anthropogenic climate change is altering the geographical distribution and regular movements of species. Highly-mobile pelagic seabirds, such as albatrosses, are particu-larly threatened by human activities, such as fisheries bycatch. Predicting the impact of climate change on how these animals roam the ocean is an important step towards making informed conservation decisions. In this study, we used a mechanistic model of migratory movements to predict how the migration of albatross species that breed in the southern Indian Ocean may change between now and the end of the century. The model is able to generate non-breeding movement patterns of albatrosses that correspond to empirical patterns from tracking data, thus providing confidence in the ability of the model to make future predictions. We projected the model using envi-ronmental conditions for 2100 based on a scenario assuming high emissions (IPCC RCP 8.5). Overall, we found very little projected change in the non-breeding distribu-tion of albatrosses compared to the present. Some change, however, is predicted for large albatrosses, which, due to their size, are more affected by wind, and are projected to migrate further eastwards in the future scenario. These results contrast with previous analyses focusing on the breeding distribution that used statistical modelling, such as habitat and species distributions models, and predicted poleward shifts in geographical distributions of various seabird species including albatrosses. Therefore, it highlights the need for formal comparison of predicted changes in distribution during differ-ent phases of the annual cycle of the albatrosses and/or integration of the differdiffer-ent approaches. Our analysis also predicts that the overlap of albatrosses with Regional Fisheries Management Organisations (RFMOs) during the non-breeding season will remain similar in 2100 compared to today. This implies that large-scale by-catch miti-gation measures implemented through fisheries management organisations will remain important over the next hundred years of climate change.
Keywords: bird migration, climate change, fisheries bycatch, future predictions, mechanistic model, seabirds
Projected migrations of southern Indian Ocean albatrosses as a
response to climate change
Marius Somveille, Maria P. Dias, Henri Weimerskirch and Tammy E. Davies
M. Somveille (https://orcid.org/0000-0002-6868-5080) ✉ (marius@somveille.com), M. P. Dias and T. E. Davies, BirdLife International, The David Attenborough Building, Cambridge, UK. MPD also at: Marine and Environmental Sciences Centre (MARE), ISPA – Inst. Univ., Lisbon, Portugal. – H. Weimerskirch, Centre d’Etude Biologique de Chizé, Villiers en Bois, France.
Introduction
Anthropogenic climate change is affecting the distribution of species across the world (Chen et al. 2011, Pecl et al. 2017). This must be taken into account for adequately protecting threatened species and designing effective management mea-sures for continued ecosystem functioning (Pecl et al. 2017). Conservation decision-making is increasingly based on stan-dardised data-driven criteria (Donald et al. 2018) and, to be effective in the face of climate change, must include quanti-tative predictions of the future distributions of mobile spe-cies in line with changing climatic conditions (Hobday et al. 2014).
Marine ecosystems are affected by particularly rapid rates of climate change (Burrows et al. 2011). Many marine spe-cies are adapted to the inherent dynamic nature of the ocean by being highly mobile, which allows them to respond to climate change by modifying their geographical distribution and regular movements (Sorte et al. 2010, Poloczanska et al. 2013). Pelagic seabirds such as albatrosses are highly mobile and among ocean top-predators, typically foraging over large oceanic areas (Croxall et al. 2005). They are however expe-riencing an alarming decline and high extinction risk due to human activities, notably fisheries bycatch (Croxall et al. 2012, Lewison et al. 2014, Dias et al. 2019). Predicting shifts in distribution and seasonal movements of seabirds as a response to climate change is therefore important for their conservation as it could lead to greater overlap with fisheries, and thus higher frequency of bycatch (Krüger et al. 2017). Such predictions could inform fisheries management prac-tices, such as bycatch mitigation measures implemented through Regional Fisheries Management Organisations (RFMOs) (Anderson et al. 2011), or dynamic ocean man-agement approaches (Hobday et al. 2014, Hazen et al. 2018). Previous studies that projected changes in species distri-butions given future climate change have mainly used sta-tistical correlative models that relate species occurrence data with climate data (Garcia Molinos et al. 2015, Pacifici et al. 2015, Krüger et al. 2017). This approach has the limitation that it only projects potential distribution (probability of occurrence) and assumes no constraints linked to movement. Thus it does not take into account how and if species could reach suitable new areas. Moreover, for highly mobile spe-cies such as seabirds, observational data are relatively scarce, therefore analyses have typically relied on tracking data to train the models and then project where species will relocate over the next century of climate change (Péron et al. 2012, Krüger et al. 2017). Such data typically accurately captures movement behaviour but are only available for a small pro-portion of the population and have strong auto-correlation, which limits the generalisation of the model for species dis-tribution. In addition, distribution models using such data assume that the link between the position of a bird at a given time and the current local climate is adaptive (i.e. that birds chose to occur in this location rather than other ones because the environment is particularly favourable). However, many seabirds, particularly during their non-breeding season, are
highly vagile and can travel across vast areas of the ocean in search for food, with their movement not necessarily indicat-ing fixed climatic or habitat preferences (Clay et al. 2016). Moreover, tracking data, particularly from light level geolo-cators, can have substantial error margin, which limits the accuracy of the link between bird position and climate.
In this study, we use a mechanistic model of migratory movement, described in Revell and Somveille (2017), to pre-dict how climate change might affect the large-scale move-ment and distribution of albatrosses that breed in the southern Indian Ocean. This model is based on mechanistic, bottom– up rules of movement, and has advantages over classical sta-tistical correlative models relating species occurrence data with climate data as they do not model movement explicitly. We focus on migratory movements during the non-breeding season as seabirds are not constrained by frequent returns to the colony to feed the chicks during this season. In the south-ern Indian Ocean, albatross and petrel species are affected by relatively high bycatch intensity (Barbraud et al. 2012, Lewison et al. 2014) and the distribution and abundance of certain species has already been found to be impacted by on-going climate change (Péron et al. 2010, Barbraud et al. 2012), making it a relevant and interesting group of marine animals to investigate. The model that we use simulates non-breeding movements of seabirds so that they track seasonal food resources over long distances while being impacted by wind patterns, two environmental variables that have been shown to affect the distribution and movement of seabirds at sea (Shaffer et al. 2006, Felicisimo et al. 2008, Weimerskirch et al. 2012, Revell and Somveille 2017), and that are also expected to be affected by future climate change. We then use the projected movements to examine how alba-tross migrations overlap with the broad areas defined by the RFMOs and how this may change in the future. We focussed on RFMOs because they operate at a broad scale in line with our analysis and provide the only formal mechanism for governance of fisheries in areas beyond national jurisdiction (Ban et al. 2014). Incidental capture (bycatch) in fisheries is the main threat to albatrosses (Dias et al. 2019) and conse-quently RFMOs have been the focus of much work to reduce seabird bycatch in fisheries through the implementation of bycatch mitigation measures (Dunn et al. 2007, Maree et al. 2014, Sullivan et al. 2018). The RFMO boundaries are not expected to change by the end of the century so it is impor-tant to know if seabirds will continue to use these areas in a similar way or not given climate change to ensure appropri-ately targeted conservation action.
Material and methods
Study system and tracking dataWe simulated non-breeding migratory movements of alba-trosses breeding on three islands in the French Southern Territories in the southern Indian Ocean: Crozet Islands, Kerguelen Islands and Amsterdam Island, using both
present and future environmental conditions. To deter-mine the empirical movement and distribution patterns of seabirds in the area, we obtained non-breeding movement tracking data (n = 47) from five species of albatrosses (three of which are globally threatened; Table 1; movement data shown in Supplementary material Appendix 1 Fig. A1), col-lected between 2005 and 2012. These tracking data were obtained using Argos Platform Transmitter Terminal (PTT) and were downloaded from the Seabird Tracking Database (<www.seabirdtracking.org>). On the basis of how species are potentially affected by wind, we classified them into two groups (based on their flight behaviour and size, following Spear and Ainley 1997 and Ainley et al. 2015): large glid-ers (movement patterns particularly affected by wind because they are particularly efficient flyers that rely on wind patterns – Amsterdam albatross Diomedea amsterdamensis; Spear and Ainley 1997, Ainley et al. 2015) and medium-small gliders (movement patterns moderately affected by wind because they use wind less efficiently that large gliders – black-browed albatross Thalassarche melanophris, Indian yellow-nosed alba-tross Thalassarche carteri, light-mantled albaalba-tross Phoebetria
palpebrata and sooty albatross Phoebetria fusca; Spear and
Ainley 1997, Ainley et al. 2015) (Table 1). Environmental variables
Two environmental variables were considered in the model: chlorophyll-a concentration, which is a proxy for the amount of food available that the birds are attracted to (Wakefield et al. 2014, Revell and Somveille 2017), and wind, which affects the cost of movement (Spear and Ainley 1997, Ainley et al. 2015). Data for chlorophyll-a concentra-tion and wind, for both present and future, were obtained from IPCC climate projections (IPCC 2014). Climate data were based on the Coupled Model Intercomparison Project CMIP5, using a scenario assuming high emissions of green-house gas and air pollutants (RCP 8.5), and were generated using the ESM2M model (Dunne et al. 2012, 2013; data are available at <http://nomads.gfdl.noaa.gov>). Current environmental conditions were obtained as monthly averages over 2006–2010, and future environmental conditions were
obtained as monthly averages over 2096–2100. All data were downscaled to a 720 × 1440 lattice for the movement simula-tion. As chlorophyll-a concentration data were obtained from a model projection, high-concentration areas tended to be under-estimated compared to remote-sensing data previously used by Revell and Somveille (2017). We therefore trans-formed the chlorophyll-a concentration data by squaring it to improve its ‘attractiveness’.
Simulating migration patterns
To simulate the non-breeding migratory movement of sea-birds, we used the model described in Revell and Somveille (2017). Briefly, this model first defines an environmental potential landscape based on chlorophyll-a concentration and wind data and then simulates bird movement within this potential landscape based on simple probabilistic decision rules. At time t, if the bird is located at lattice point (x,y), the total potential for a neighbouring lattice point (i,j) was calculated as: yij ac k l kl ij kl ij C d = -
å
-, , The left-hand side of the equation above is summed over alllattice points (k,l) where (k,l) ≠ (i,j). Ckl indicate the
chloro-phyll-a concentration at lattice point (k,l), dij,kl indicate the
distance between lattice points (i,j) and (k,l), χij indicates the
wind potential component, which depends on the difference between the empirical wind vector at lattice point (x,y) and the travel vector between lattice points (x,y) and (i,j), and α is a free parameter. This potential is calculated for the eight neighbouring cells of the bird current location. Then, to determine which position the bird will move into, the prob-ability of movement was computed as:
P e e ij k l ij kl =
-å
by by ,Table 1. Seabird species for which non-breeding migratory movements were modelled and projected. This table indicate, for each species, the colony and sample size of the tracking data, the grouping based on flight mode and size, as well as month of departure from colony (estimated from the tracking data).
Common name Scientific name Red List status (start of simulation)Colony location
Tracking data sample size
(individuals) Flight/size grouping
Month leave colony (simulation
start time) Amsterdam
albatross Diomedea amsterdamensis EN Amsterdam Island 14 Large February
Black-browed
albatross Thalassarche melanophris LC Kerguelen Islands 2 Medium-small April/May
Indian yellow-
nosed albatross Thalassarche carteri EN Amsterdam Island 5 Medium-small April
Light-mantled
albatross Phoebetria palpebrata NT Crozet and Kerguelen Islands 7 Medium-small May Sooty albatross Phoebetria fusca EN Crozet Islands and
In this equation, the denominator is summed over the eight neighbouring lattice points (k,l), and β is a free parameter. Starting conditions
The starting location and month of the simulations were derived from empirical tracking data for the respective spe-cies (Table 1). There were three possible starting points, based on the three breeding colonies: Amsterdam Island (77.51°E, 37.85°S), Kerguelen Islands (70.00°E, 49.40°S) and Crozet Islands (51.74°E, 46.42°S); and three possible starting months based on the empirical tracking data for each species: February, April and May (Table 1). This led to four unique simulations based on the species–colony–start time combinations:
C1: large albatrosses (Amsterdam albatross) – Amsterdam Island – February. Empirical data: n = 14.
C2: medium/small albatrosses (Indian yellow-nosed alba-tross, sooty albatross) – Amsterdam Island – April/May. Empirical data: n = 14.
C3: medium/small albatrosses (black-browed albatross, light-mantled albatross) – Kerguelen Islands – April/May. Empirical data: n = 5.
C4: medium/small albatrosses (light-mantled albatross, sooty albatross) – Crozet Islands – April/May. Empirical data: n = 14.
For each of these four combinations (C1–C4) we ran the simulations for a three-month period, which corresponds to a typical amount of time away from the colony before the birds are attracted back towards the colony for breeding. For medium/small gliders, we ran the simulations for both April to June and May to July for each starting location. For simu-lations in the future, we used the same combinations of start-ing coordinates and migration startstart-ing month (Table 1) as we assume that at the end of the century populations will breed at the same location and terminate their breeding season at the same time as today, which is supported by recent evidence showing that climate change is not having an effect on sea-bird phenology (Keogan et al. 2018).
Model calibration
The model has two free parameters: α, which determines the strength of wind relative to attraction to resources, and β, which determines the level of stochasticity. To calibrate the model, we ran it with different combination of values for these two parameters, each time simulating the movement of 10 migratory individuals (for medium/small gliders, we simulated 10 individuals starting in April and 10 individu-als starting in May), and compared the simulated migratory movements with the empirical tracking data. To compare the simulated and the empirical tracks, we computed the propor-tion of data points occurring in 30° (longitude) × 15° (lati-tude) cells across the southern Indian Ocean (between 0° and 180°W in longitude and between 0° and 75°S in latitude; Supplementary material Appendix 1 Fig. A2). We did that for
both simulated and empirical data separately and then com-puted the goodness-of-fit (R2) of the regression between the
two. We scanned several combinations of parameter values and selected the one with the highest resulting R2.
For parameter α, we ran the model for the following val-ues reflecting weak, intermediate and strong effect of wind relative to attraction to resources: α ∈ {1e−4,1e−3,1e−2} for the
Amsterdam albatross (which is generally particularly affected by wind) and α ∈ {1e−5,1e−4,1e−3} for the other species (which
are generally moderately affected by wind). For parameter β, we ran the model for the following values: β ∈ {1e−3,1e−2,1e−1}
to explore different levels of stochasticity, which might reflect the level of knowledge of the environment.
Current and expected overlap with RFMOs
We used the best-fit models (i.e. with the combination of parameter values that best match the empirical data) to com-pute the proportion of simulated data points occurring in each separate RFMO across the study area (i.e. the geographic extent of the non-breeding distribution of albatrosses that breed in the southern Indian Ocean). We considered four different RFMOs, comprising three tuna RFMOs: the International Commission for the Conservation of Atlantic Tunas (ICCAT), the Indian Ocean Tuna Commission (IOTC) and the Western and Central Pacific Fisheries Commission (WCPFC); plus the Commission for the Conservation of Antarctic Marine Living Resources (CCAMLR) (see Supplementary material Appendix 1 Fig. A3 for maps of the boundaries of these RFMOs). This analysis was conducted for both present and future climate conditions in order to estimate how the overlap between alba-trosses’ non-breeding migratory movements and RFMOs is expected to be affected by climate change.
Results
Current distributions
The model is able to simulate non-breeding movement trajec-tories for albatrosses that breed in the southern Indian Ocean that match the empirical tracking data at broad scale. Using a coarse grid for model calibration, we found a very good match between simulated and empirical movement patterns for the Amsterdam albatross (R2 = 0.789, Supplementary
material Appendix 1 Table A1) and the small-medium sized albatrosses breeding on Amsterdam Island (R2 = 0.928,
Supplementary material Appendix 1 Table A1), and we found a moderately good match for the small-medium size albatrosses breeding on Kerguelen Islands (R2 = 0.428,
Supplementary material Appendix 1 Table A1) and Crozet Islands (R2 = 0.442, Supplementary material Appendix 1
Table A1). These results give confidence in the ability of the model to capture broad movement trajectories for albatrosses that breed in the southern Indian Ocean, and also for making future projections. Notable discrepancies between simulated (Fig. 1) and empirical (Supplementary material Appendix 1
Fig. A1) patterns are: some simulated Amsterdam albatrosses tend to migrate further east towards New Zealand; no simu-lated albatross from Kerguelen migrate west towards south-ern Africa; some simulated small-medium size albatrosses breeding on Crozet and Amsterdam islands migrate too far south towards Antarctica.
The best results were generated by combinations of parameter values that reflect various levels of stochastic-ity and strength for the effect of wind in relation to the attraction to resources depending on the colony where the
movements start (Supplementary material Appendix 1 Table A1). As expected, on Amsterdam Island, the best-fit model for Amsterdam albatross had a stronger effect of wind in rela-tion to the attracrela-tion to resources (α = 1e-03) than the best-fit model for the small-medium size albatrosses (α = 1e-04; Supplementary material Appendix 1 Table A1). Also as expected, for the small-medium size albatrosses breeding on Kerguelen and Crozet islands, the best-fit model had a weak effect of wind in relation to the attraction to resources (α = 1e-05; Supplementary material Appendix 1 Table A1).
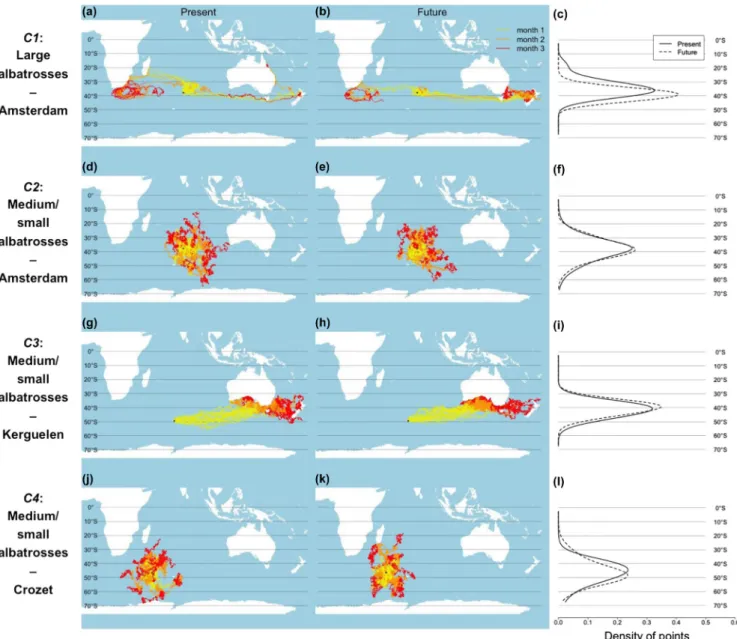
Figure 1. Simulated non-breeding migratory movement of albatrosses that breed in the Southern Indian Ocean for present and future. Movement patterns were simulated for large albatrosses (Amsterdam albatross on Amsterdam Island; combination C1) for (a) present and (b) future (year 2100) environmental conditions; medium/small albatrosses on Amsterdam Island (Indian yellow-nosed albatross and sooty albatross; combination C2) in (c) present and (d) 2100; medium/small albatrosses on Kerguelen Islands (black-browed albatross and light-mantled albatross; combination C3) in (e) present and (f) 2100; and medium/small albatrosses on Crozet Islands (light-light-mantled albatross and sooty albatross; combination C4) in (g) present and (h) 2100. Migratory movements were simulated for 3-month periods and colours in the trajectories indicate each of these months. Black stars indicate the breeding colony, where the movement simulations start.
Future distributions
Predicted migration trajectories for 2100 were largely similar to the ones under current climatic conditions, suggesting a relatively weak effect of climate change on the non-breeding movement patterns of albatrosses that breed in the southern Indian Ocean (Fig. 1). Across all models regardless of their of-fit to empirical data, the average goodness-of-fit between present and future migration patterns was R2 = 0.822, and restricting to models with moderate to very
good match to empirical data (R2> 0.3), the average
good-ness-of-fit between present and future migration patterns was R2 = 0.833. A very good match between current and future
simulated migration patterns were obtained for the best-fit models for medium/small albatrosses (Supplementary material Appendix 1 Table A1): R2 = 0.974 for birds
breed-ing on Amsterdam Island; R2 = 0.791 for birds breeding on
Kerguelen Islands; and R2 = 0.918 for birds breeding on
Crozet Islands. For Amsterdam albatross, the match between current and future simulated migration patterns was much lower (R2 = 0.245), potentially indicating a stronger impact of
climate change on the movement pattern of this species as it is projected to migrate further eastward towards the Tasman Sea in the future, in contrast to the current westward route towards southern Africa (Fig. 1a–b). In addition, the latitu-dinal distribution of albatrosses that breed in the southern Indian Ocean during the non-breeding season is not pre-dicted to change between the present and 2100 (Fig. 1c, g, i and l), although some small shift poleward is predicted by the model for the Amsterdam albatross (Fig. 1c).
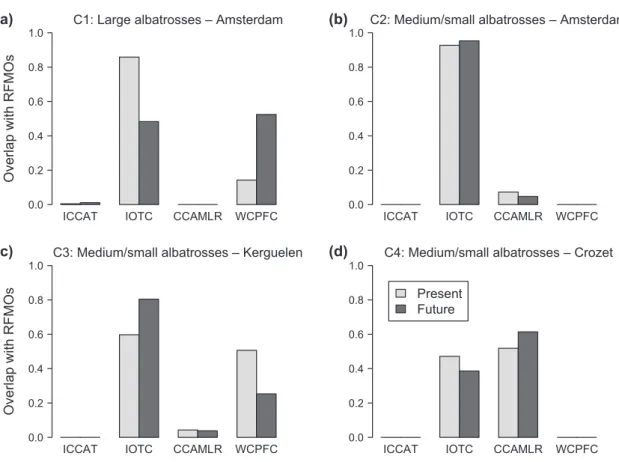
The overlap of the non-breeding migratory movements of albatrosses in the southern Indian Ocean with RFMOs is projected to remain broadly the same with climate change over the next century, but with some changes in the propor-tion of time species spend within each RFMO jurisdicpropor-tion (Fig. 2). A small level of change is predicted by the model for medium/small albatrosses, except for more noticeable change for albatrosses breeding on the Kerguelen Islands as they are expected to spend more time overlapping with IOTC (59.7% overlap at present versus 80.4% overlap in 2100) and less time overlapping with WCPFC (50.7% overlap at present versus 25.3% overlap in 2100; Fig. 2c). For Amsterdam
ICCAT IOTC CCAMLR WCPFC
Over lap with R FMO s 0.0 0.2 0.4 0.6 0.8
1.0 C1: Large albatrosses – Amsterdam
ICCAT IOTC CCAMLR WCPFC
0.0 0.2 0.4 0.6 0.8
1.0 C2: Medium/small albatrosses – Amsterdam
ICCAT IOTC CCAMLR WCPFC
O verla pw ithR FMOs 0.0 0.2 0.4 0.6 0.8
1.0 C3: Medium/small albatrosses – Kerguelen
ICCAT IOTC CCAMLR WCPFC
0.0 0.2 0.4 0.6 0.8
1.0 C4: Medium/small albatrosses – Crozet
Present Future
(a) (b)
(c) (d)
Figure 2. Expected change in overlap between albatrosses non-breeding migratory movements and RFMOs. The barplots indicate the pro-portion of simulated data points occurring in each RFMO in the present (light grey) and future (dark grey; year 2100) for (a) large alba-trosses (Amsterdam albatross on Amsterdam Island; combination C1), (b) medium/small albaalba-trosses on Amsterdam Island (Indian yellow-nosed albatross and sooty albatross; combination C2), (c) medium/small albatrosses on Kerguelen Islands (black-browed albatross and light-mantled albatross; combination C3) and (d) medium/small albatrosses on Crozet Islands (light-mantled albatross and sooty alba-tross; combination C4). ICCAT: International Commission for the Conservation of Atlantic Tunas; IOTC: Indian Ocean Tuna Commission; CCAMLR: Commission for the Conservation of Antarctic Marine Living Resources; WCPFC: Western and Central Pacific Fisheries Commission. For each panel (a–d) the total sum of proportions for present or future can differ from 1 since the RFMOs are overlapping.
albatross, more substantial change is predicted. They are expected to spend less time overlapping with IOTC (85.8% overlap at present versus 48.3% overlap in 2100) and more time overlapping with WCPFC (14.3% overlap at present versus 52.4% overlap in 2100; Fig. 2a), as this species is pre-dicted to migrate further eastwards in the future (Fig. 1a–b).
Discussion
In this study, we used a mechanistic model to predict how the migrations of albatrosses that breed in the southern Indian Ocean will be affected by climate change. Overall, our predictions show a marginal level of change for the non-breeding movements and distribution of albatrosses between the present and the end of the century (Fig. 1). These results must be interpreted at a broad scale, as the model is not intended to examine local individual trajectories but rather large-scale movement patterns. At such scale, despite using a climate change scenario assuming high emissions of green-house gas and air pollutants, we found that albatrosses are expected to follow largely similar migration patterns in 2100 to their current ones. This result is in contrast to previous studies using statistical habitat and distribution modelling that have predicted significant range shifts for seabird species in the future (Péron et al. 2012, Krüger et al. 2017); how-ever these studies were conducted for different species and were not restricted to the non-breeding season, which could account for the disparity. Our results should indeed be inter-preted for pelagic seabirds with similar biology and foraging behaviour to albatrosses during their non-breeding season, i.e. good flying ability and few constraints (e.g. not obligated to return frequently to their nests; Mackley et al. 2010). Our model is based on wind and attraction to resources to gener-ate migratory movements, and our results therefore suggest that future change in wind patterns and resource supplies will not affect significantly the non-breeding distribution of large and highly-mobile seabirds. However, chlorophyll-a is just a proxy for food resources, with many albatross species feeding on fish and cephalopods (Reid et al. 1996), and other factors, such as sex, physiology and biological interactions have been shown to influence non-breeding movement (Phillips et al. 2005, Weimerskirch et al. 2014, Clay et al. 2016) and could also affect future predictions. In addition, our model cur-rently ignores individual differences in behavioural ability, but individual plasticity could lead to altered predictions if individuals evolve differences in how they are attracted to resources and use the wind in the future as we are currently using the same parameter values in the present and future for each population. However, given the longevity of alba-trosses and the type of mechanisms included in our model (i.e. attraction to resources at a distance and effect of wind on movement cost), we do not expect that changes in migra-tion behaviour due to natural selecmigra-tion will affect our model predictions by the end of the century.
We found that the migratory behaviour of large gliders (i.e. here Amsterdam albatross), in comparison to medium/small
gliders (i.e. here Indian yellow-nosed albatross, black-browed albatross, light-mantled albatross and sooty albatross), is bet-ter explained by a model with a relatively strong effect of wind. This result is in line with previous work examining the effect of wind on the flight behaviour of different groups of seabirds (Spear and Ainley 1997, Ainley et al. 2015). As wind is a relatively important factor determining the non-breeding migration of the Amsterdam albatross, this species is particu-larly susceptible to changes in wind patterns under climate change. In fact, previous research found a significant effect of recent changes in wind pattern on the movements and distributions of large albatrosses (Weimerskirch et al. 2012). This is supported by our analysis as we found a stronger effect of climate change for the large Amsterdam albatross com-pared to smaller albatross species of albatrosses (Fig. 1). In fact, the former is projected to have a higher number of indi-viduals migrating eastward towards the Tasman Sea in the future (Fig. 1a–b). However, the model also incorrectly pre-dicts Amsterdam albatrosses to migrate too much eastward at present (Fig. 1a versus Supplementary material Appendix 1 Fig. A1a), which highlights a bias of the model towards east-ward movements for this species that could affect the future projections.
Fisheries bycatch is one the biggest threat to seabirds and particularly albatrosses (Croxall et al. 2012, Lewison et al. 2014, Dias et al. 2019). We found that the non-breeding distribution of albatrosses with overlap with tuna Regional Fisheries Management Organisations and CCAMLR in a largely similar fashion at the end of the century compared to today, although some change in the relative frequency of use is projected, notably between IOTC and WCPFC (Fig. 2). If the predicted increase in albatross density distribution in the Tasman Sea occurs, then this will increase the importance of ensuring effective seabird bycatch mitigation in this area. Currently, all tuna RFMOs that overlap with the distribu-tion of albatrosses breeding in the Southern Indian Ocean mandate that longline vessels use two out of three prescribed seabird bycatch mitigation measures (night setting with minimum deck lighting, bird-scaring lines and line weight-ing) when fishing below 25°S (ICCAT 2011, IOTC 2012, WCPFC 2018). Such bycatch mitigation measures, when implemented, have been shown to be effective in recent years (Anderson et al. 2011, Phillips et al. 2016). Our findings indicate that the current seabird bycatch mitigation require-ments will continue to be a key component of albatross con-servation for the next hundred years of climate change as our model projected a limited change in the latitudinal use of the southern Indian Ocean by non-breeding albatrosses (Fig. 1). Seabird movement patterns simulated in this study were coarse and therefore we chose to overlap them with large-scale fisheries management units (RFMOs). In future studies, if fine-scale data on fishing efforts, particularly asso-ciated with high bycatch risk, can be reliably modelled and projected across the ocean under scenarios of future global change, it will be informative to overlap them with fine-scale mechanistic models of seabird movements in order to predict future bycatch risk for highly-mobile species across the ocean.
Interpretations of the results of this study should acknowl-edge that the mechanistic model that we used is coarse and simple. It only has two free parameters (including one sim-ply determining the level of stochasticity) and is based on two environmental factors (wind and attraction to resources). Yet the model is able to capture well the large-scale patterns in the movement and non-breeding distribution of albatrosses that breed in the southern Indian Ocean. The match between empirical and simulated patterns is relatively high, but not perfect. Some of the discrepancies could be due to missing ecological processes (e.g. competition; Clay et al. 2016), but also because we estimated chlorophyll-a concentration using a model rather than direct observations (e.g. via remote-sensing). A model is required for making future projections, but tends to smooth the distribution of chlorophyll-a concentration across the ocean, dampening the high peaks in upwelling areas for example, which might affect the resulting simulated migration patterns. For instance, no simulated albatross from Kerguelen migrated westwards towards southern Africa, which might be because the attraction towards the area is not strong enough in the model of chlorophyll-a concentration. Interpretations of the results should also acknowledge the relatively small sam-ple sizes in the empirical tracking data used to calibrate the mechanistic model, particularly for albatrosses from Kerguelen (Supplementary material Appendix 1 Fig. A1).
This study highlights the potential for using mechanistic models of movement, calibrated using tracking data, to pre-dict the impact of climate change on highly-mobile species. Such approach could be further developed in future studies, for example adding individual differences, such as how sex and age affect movement behaviour (Åkesson and Weimerskirch 2014), and future work could also explore how to combine it with traditional species distribution and habitat modelling for refining future predictions. Such exercise is important as it can inform large-scale conservation strategies and decision-making, such as ocean-scale mitigation of fisheries bycatch, in the face of rapid anthropogenic climate change.
Data availability statement
The data is deposited on BirdLife’s Seabird Tracking Database.
Acknowledgements – We would like to thank Stephanie Prince and
Cleo Small for helpful suggestions on the manuscript as well as Mario Krapp for guidance on downscaling the climate data.
Funding – This study was supported through a grant to the Global
Ocean Biodiversity Initiative (GOBI) from the International Climate Initiative (IKI). The German Federal Ministry for the Environment, Nature Conservation and Nuclear Safety (BMU) supports this initiative on the basis of a decision adopted by the German Bundestag.
References
Ainley, D. G. et al. 2015. Seabird flight behavior and height in response to altered wind strength and direction. – Mar. Orni-thol. 43: 25–36.
Åkesson, S. and Weimerskirch, H. 2014. Evidence for sex-segre-gated ocean distributions of first-winter wandering albatrosses at Crozet Islands. – PLoS One 9: e86779.
Anderson, O. et al. 2011. Global seabird bycatch in longline fisher-ies. – Endanger. Species Res. 14: 91–106.
Ban, N. C. et al. 2014. Systematic conservation planning: a better recipe for managing the high seas for biodiversity conservation and sustainable use. – Conserv. Lett. 7: 41–54.
Barbraud, C. et al. 2012. Effects of climate change and fisheries bycatch on Southern Ocean seabirds: a review. – Mar. Ecol. Prog. Ser. 454: 285–307.
Burrows, M. T. et al. 2011. The pace of shifting climate in marine and terrestrial ecosystems. – Science 334: 652–655.
Chen, I. et al. 2011. Rapid range shifts of species associated with high levels of climate warming. – Science 333: 1024–1026. Clay, T. A. et al. 2016. Proximate drivers of spatial segregation in
non-breeding albatrosses. – Sci. Rep. 6: 29932.
Croxall, J. P. et al. 2005. Global circumnavigations: tracking year-round ranges of nonbreeding albatrosses. – Science 307: 249–250.
Croxall, J. P. et al. 2012. Seabird conservation status, threats and priority actions: a global assessment. – Bird Conserv. Int. 22: 1–34.
Dias, M. P. et al. 2019. Threats to seabirds: a global assessment. – Biol. Conserv. 237: 525–537.
Donald, P. F. et al. 2018. Important Bird and Biodiversity Areas (IBAs): the development and characteristics of a global inventory of key sites for biodiversity. – Bird Conserv. Int. 29: 177–198. Dunn, E. et al. 2007. Albatross conservation: from identifying
problems to implementing policy. – Aquat. Conserv. Mar. Freshwater Ecosyst. 17: S165–S170.
Dunne, J. P. et al. 2012. GFDL’s ESM2 global coupled climate-carbon Earth system models. Part I: physical formulation and baseline simulation characteristics. – J. Clim. 25: 6646–6665. Dunne, J. P. et al. 2013. GFDL’s ESM2 global coupled climate-car-bon Earth system models. Part II: carclimate-car-bon system formulation and baseline simulation characteristics. – J. Clim. 26: 2247–2267. Felicisimo, A. M. et al. 2008. Ocean surface winds drive dynamics
of transoceanic aerial movement. – PLoS One 3: e2928. Garcia Molinos, J. et al. 2015. Climate velocity and the future
global redistribution of marine biodiversity. – Nat. Clim. Change 6: 83–90.
Hazen, E. L. et al. 2018. A dynamic ocean management tool to reduce bycatch and support sustainable fisheries. – Sci. Adv. 4: eaar3001.
Hobday, A. J. et al. 2014. Dynamic Ocean management: integrat-ing scientific and technological capacity with law, policy and management. – Stanf. Environ. Law J. 33: 125–165.
ICCAT 2011. Supplemental recommendation by ICCAT on reduc-ing incidental bycatch of seabirds in ICCAT longline fisheries. – International Commission for the Conservation of Atlantic Tunas.
IOTC 2012. Resolution 12/06 on reducing the incidental bycatch of seabirds in the longline fisheries. – Indian Ocean Tuna Com-mission.
IPCC 2014. Climate change 2014: synthesis report. – IPCC. Keogan, K. et al. 2018. Global phonological insensitivity to shifting
ocean temperatures among seabirds. – Nat. Clim. Change 8: 313–318.
Krüger, L. et al. 2017. Projected distributions of Southern Ocean albatrosses, petrels and fisheries as a consequence of climate change. – Ecography 40: 1–14.
Lewison, R. L. et al. 2014. Global pattern of marine mammal, seabird and sea turtle bycatch reveal taxa-specific and cumulative mega-fauna hotspots. – Proc. Natl Acad. Sci. USA 111: 5271–5276. Mackley, E. K. et al. 2010. Free as a bird? Activity patterns of
alba-trosses during the nonbreeding period. – Mar. Ecol. Prog. Ser. 406: 291–303.
Maree, B. A. et al. 2014. Significant reductions in mortality of threatened seabirds in a South African trawl fishery. – Anim. Conserv. 17: 520–529.
Pacifici, M. et al. 2015. Assessing species vulnerability to climate change. – Nat. Clim. Change 5: 215–224.
Pecl, G. T. et al. 2017. Biodiversity redistribution under climate change: impacts on ecosystems and human well-being. – Sci-ence 355: eaai9214.
Péron, C. et al. 2010. Interdecadal changes in at-sea distribution and abundance of subantarctic seabirds along a latitudinal gra-dient in the Southern Indian Ocean. – Global Change Biol. 16: 1895–1909.
Péron, C. et al. 2012. Projected poleward shift of king penguins’
Aptenodytes patagonicus) foraging range at the Crozet Islands,
southern Indian Ocean. – Proc. R. Soc. B 279: 2515–2523. Phillips, R. et al. 2005. Summer distribution and migration of
non-breeding albatrosses: individual consistencies and implications for conservation. – Ecology 86: 2386–2396.
Phillips, R. et al. 2016. The conservation status and priorities for albatrosses and large petrels. – Biol. Conserv. 201: 169–183. Poloczanska, E. S. et al. 2013. Global imprint of climate change on
marine life. – Nat. Clim. Change 3: 919–925.
Reid, K. et al. 1996. The fish diet of black-browed albatross
Dio-medea melanophris and grey-headed albatross D. chrysostoma at
South Georgia. – Polar Biol. 16: 469–477.
Revell, C. and Somveille, M. 2017. A physics-inspired mechanistic model of migratory movement patterns in birds. – Sci. Rep. 7: 9870.
Shaffer, S. A. et al. 2006. Migratory shearwaters integrate oceanic resources across the Pacific Ocean in an endless summer. – Proc. Natl Acad. Sci. USA 103: 12799–12802.
Sorte, C. J. B. et al. 2010. Marine range shifts and species introduc-tions: comparative spread rates and community impacts. – Global Ecol. Biogeogr. 19: 303–316.
Spear, L. B. and Ainley, D. G. 1997. Flight speed of seabirds in relation to wind speed and direction. – Ibis 139: 234–251. Sullivan, B. et al. 2018. At‐sea trialling of the Hookpod: a ‘one‐stop’
mitigation solution for seabird bycatch in pelagic longline fish-eries. – Anim. Conserv. 21: 159–167.
Wakefield, E. D. et al. 2014. Habitat-mediated population limita-tion in a colonial central-place forager: the sky is not the limit for the black-browed albatross. – Proc. R. Soc. B 281: 20132883. WCPFC 2018. Conservation and management measure to mitigate
the impact of fishing for highly migratory fish stocks on sea-birds. – Western and Central Pacific Fisheries Commission. Weimerskirch, H. et al. 2012. Changes in wind pattern alter
alba-tross distribution and life-history traits. – Science 335: 211–214. Weimerskirch, H. et al. 2014. Lifetime foraging patterns of the
wandering albatross: life on the move! – J. Exp. Mar. Biol. Ecol. 450: 68–78.
Supplementary material (available online as Appendix ecog-05066 at <www.ecography.org/appendix/ecog-ecog-05066>). Appendix 1.