BGD
8, 9709–9746, 2011Fires during the 21st century
S. Kloster et al.
Title Page
Abstract Introduction
Conclusions References
Tables Figures
◭ ◮
◭ ◮
Back Close
Full Screen / Esc
Printer-friendly Version
Interactive Discussion
Discussion
P
a
per
|
Dis
cussion
P
a
per
|
Discussion
P
a
per
|
Discussio
n
P
a
per
|
Biogeosciences Discuss., 8, 9709–9746, 2011 www.biogeosciences-discuss.net/8/9709/2011/ doi:10.5194/bgd-8-9709-2011
© Author(s) 2011. CC Attribution 3.0 License.
Biogeosciences Discussions
This discussion paper is/has been under review for the journal Biogeosciences (BG). Please refer to the corresponding final paper in BG if available.
The impacts of climate, land use, and
demography on fires during the 21st
century simulated by CLM-CN
S. Kloster1, N. M. Mahowald2, J. T. Randerson3, and P. J. Lawrence4
1
Land in the Earth System, Max Planck Institute for Meteorology, Hamburg, Germany 2
Earth and Atmospheric Sciences, Cornell University, Ithaca, NY, USA 3
Department of Earth System Science, University of California, Irvine, California, USA 4
National Center for Atmospheric Research, Boulder, Colorado, USA
Received: 15 August 2011 – Accepted: 22 September 2011 – Published: 28 September 2011
Correspondence to: S. Kloster ([email protected])
BGD
8, 9709–9746, 2011Fires during the 21st century
S. Kloster et al.
Title Page
Abstract Introduction
Conclusions References
Tables Figures
◭ ◮
◭ ◮
Back Close
Full Screen / Esc
Printer-friendly Version
Interactive Discussion
Discussion
P
a
per
|
Dis
cussion
P
a
per
|
Discussion
P
a
per
|
Discussio
n
P
a
per
|
Abstract
Landscape fires during the 21st century are expected to change in response to multiple agents of global change. Important controlling factors include climate controls on the length and intensity of the fire season, fuel availability, and fire management, which are already anthropogenically perturbed today and are predicted to change further in the 5
future. An improved understanding of future fires will contribute to an improved ability to project future anthropogenic climate change, as changes in fire behavior will in turn impact climate.
In the present study we used a coupled-carbon-fire model to investigate how changes in climate, demography, and land use may alter fire emissions. We used 10
climate projections following the SRES A1B scenario from two different climate mod-els (ECHAM5/MPI-OM and CCSM) and changes in population. Land use and harvest rates were prescribed according to the RCP 45 scenario. In response to the combined effect of all these drivers, our model estimated, depending on our choice of climate projection, an increase in future (2075–2099) fire carbon emissions by 17 and 62 % 15
compared to present day (1985–2009). The largest increase in fire emissions was predicted for Southern Hemisphere South America for both climate projection. For Northern Hemisphere Africa, a region that contributed significantly to the global to-tal fire carbon emissions, the response varied between a decrease and an increase depending on the climate projection.
20
We disentangled the contribution of the single forcing factors to the overall response by conducting an additional set of simulations in which each factor was individually held constant at pre-industrial levels. The two different projections of future climate change evaluated in this study led to increases in global fire carbon emissions by 22 % (CCSM) and 66 % (ECHAM5/MPI-OM). The RCP 45 projection of harvest and land use 25
BGD
8, 9709–9746, 2011Fires during the 21st century
S. Kloster et al.
Title Page
Abstract Introduction
Conclusions References
Tables Figures
◭ ◮
◭ ◮
Back Close
Full Screen / Esc
Printer-friendly Version
Interactive Discussion
Discussion
P
a
per
|
Dis
cussion
P
a
per
|
Discussion
P
a
per
|
Discussio
n
P
a
per
|
We concluded from this study that changes in fire emissions in the future are con-trolled by multiple interacting factors. Although changes in climate led to an increase in future fire emissions this could be globally counterbalanced by coupled changes in land use, harvest, and demography.
1 Introduction
5
Contemporary landscape fires emit about 1.6 to 2.8 PgC yr−1 into the atmosphere
(van der Werf et al., 2010). This equals around 20–30 % of present day fossil fuel burning emissions (Boden et al., 2009). Changes in fires and subsequent changes in ecosystem carbon stocks can therefore have considerable impacts on atmospheric greenhouse gas concentrations and future climate change. In addition, increases in 10
fires represent a severe hazard to human health and ecosystem services, which in many areas will require the development and implementation of new adaptation strate-gies (Bowman et al., 2009).
From paleorecords we know that climate, and particularly rapid climate change, played an important role in determining broad-scale levels of fire activity (Marlon et al., 15
2009). Observations from more recent decades clearly show a link between changing climate and fire behavior (Soja et al., 2007). For example, in the western United States higher temperatures increased the duration and intensity of wildfires since the 1980s (Westerling et al., 2006). Human-induced climate change has had a detectable influ-ence on the area burned by forest fire in Canada over recent decades (Gillett et al., 20
2004). Accelerated carbon losses for the last decades were reported for Alaskan forests and peatlands (Turetsky et al., 2011).
Fires depend on fuel type, fuel moisture, and fuel availability. In addition, fires re-quire an ignition source which can be either of natural (lightning) or anthropogenic origin (Thonicke et al., 2001; Arora and Boer, 2005). Climate impacts fires directly by 25
BGD
8, 9709–9746, 2011Fires during the 21st century
S. Kloster et al.
Title Page
Abstract Introduction
Conclusions References
Tables Figures
◭ ◮
◭ ◮
Back Close
Full Screen / Esc
Printer-friendly Version
Interactive Discussion
Discussion
P
a
per
|
Dis
cussion
P
a
per
|
Discussion
P
a
per
|
Discussio
n
P
a
per
|
growth and litter decomposition that are sensitive to climate change. Fuel availability is controlled by fire as well, which consumes biomass and lowers fuel loads. As such fires and fuel availability are coupled via a negative feedback loop, that will critically define how fires will change in the future.
Fires are directly anthropogenically controlled through human caused ignition and 5
fire management efforts, set in place to suppress fires in places were properties are at risk (Bowman et al., 2009). Land use and wood harvest rates impact fires indirectly by controlling fuel loads and fuel connectivity (Marlon et al., 2009). Consequently, fires depend on social and economic drivers of land use and on demographic trends, which also influences rate of regional and global climate change.
10
Here we investigated how fires may change during the 21st century. We used a global land carbon model that interactively simulated landscape fires, with fires re-sponding to climate, land use and demographic driving variables. The model ac-counted for fires controlled by fuel moisture, fuel availability, and the abundance of ignitions sources (Kloster et al., 2010). We examined how future changes in climate, 15
land use, and demography were likely to influence trajectories of fire emissions during the 21st century. We also considered indirect controls, including for example climate-induced changes in fuel. In the following method section we will introduce the fire model, that was evaluated for the 20th century in an earlier work (Kloster et al., 2010) and our simulation design. In the results section we discuss the simulated future fire 20
emissions and the contribution of the single forcing factors (climate, land use, and de-mography) to the overall response. The conclusion section summarizes the results and discusses the limitations of our approach.
2 Model
All simulations in this study were performed with a modified version of the Community 25
BGD
8, 9709–9746, 2011Fires during the 21st century
S. Kloster et al.
Title Page
Abstract Introduction
Conclusions References
Tables Figures
◭ ◮
◭ ◮
Back Close
Full Screen / Esc
Printer-friendly Version
Interactive Discussion
Discussion
P
a
per
|
Dis
cussion
P
a
per
|
Discussion
P
a
per
|
Discussio
n
P
a
per
|
beyond CLM3.5 incorporate most of the updates of the model that now make up CLM version 4 (Lawrence et al., 2011a) and were described in more detail previously by Kloster et al. (2010), which applied an identical model setup as used in this study.
Fires were represented in the model by a modified version of the fire algorithm de-veloped by Arora and Boer (2005). This fire algorithm was implemented into CLM-CN 5
to simulate landscape fires for the 20th century and was described and evaluated in detail in Kloster et al. (2010). We briefly describe the fire algorithm here.
Fire carbon emissions (FCE) to the atmosphere were parameterized following a mod-ified Seiler and Crutzen (1980) approach (van der Werf et al., 2006):
FCE(x,t)=A(x,t)XCi(x,t)·cci(x,t)·morti(x,t) (1)
10
withArepresenting the area burned,Cthe carbon pool sizes for the different fuel and plant functional types (i) considered in CLM-CN, cc the combustion completeness, and mort the mortality factor for any given locationxand timet. cc and mort varied for different fuel and plant functional types (i) within CLM-CN.
The burned area was parameterized in the fire algorithm as a function of a potential 15
burned area modified with a fire occurrence probability (Arora and Boer, 2005). The potential burned area was defined by the fire spread rate, which was parameterized as a function of wind speed and fuel moisture. The fire occurrence probability was the product of three probability functions representing the availability of biomass, fuel moisture status, and the likelihood of the ignition. Ignition sources can have either a 20
human or lightning origin. Human ignition was scaled for this study with population density. A lightning climatology was constructed using monthly mean maps from the Lightning Imaging Sensor/Optical Transient Detector product (LIS/OTD) modified by a latitudinally varying ratio of the cloud-to-ground flashes to total flashes (Pierce, 1969). In addition the model accounted for fire management (e.g. fire suppression) in areas 25
BGD
8, 9709–9746, 2011Fires during the 21st century
S. Kloster et al.
Title Page
Abstract Introduction
Conclusions References
Tables Figures
◭ ◮
◭ ◮
Back Close
Full Screen / Esc
Printer-friendly Version
Interactive Discussion
Discussion
P
a
per
|
Dis
cussion
P
a
per
|
Discussion
P
a
per
|
Discussio
n
P
a
per
|
The model represented deforestation fires by allowing for a variable fraction of defor-estation carbon to be combusted, with the fraction depending on fuel conditions during the year of land clearing (Kloster et al., 2010). Within CLM-CN land use change and wood harvest were prescribed (Hurtt et al., 2006). Land use conversion transferred biomass into paper and wood products with the remainder left on site (Houghton et al., 5
1983). Here we explicitly attributed a fraction of the on-site fraction to burning. The fraction was allowed to vary as a function of fuel moisture conditions, with drier fuels more likely to be burned in the process of deforestation.
Our model simulations has a spatial resolution of 1.9◦
×2.5◦. More details on the forcing data are given in Sect. 3.
10
The model was able to capture much of the observed mean and variability in fire carbon emissions (Kloster et al., 2010). Global annual mean fire carbon emissions varied between 2.0 and 2.4 PgC yr−1for the time period 1997 to 2004, which lies within
the uncertainty of satellite-based estimates. The best match with observations was found when the model accounted for both human ignition and fire suppression as a 15
function of population density. The simulated trend in fire carbon emission over the 20th century was broadly consistent with observational constraints.
3 Simulation setup
In the present study we analyzed CLM-CN simulations covering the time period 1798– 2100 (Table 1). For the years 1798–2004 these simulations are described in detail in 20
Kloster et al. (2010). As described below, we extended these simulations through the year 2100.
For the 20th century we used NCEP/NCAR reanalysis climate forcing, including tem-perature, precipitation, wind, humidity, pressure, and solar radiation, from Qian et al. (2006). A 25 yr repeat cycle of the reanalysis from years 1948–1972 was used to 25
BGD
8, 9709–9746, 2011Fires during the 21st century
S. Kloster et al.
Title Page
Abstract Introduction
Conclusions References
Tables Figures
◭ ◮
◭ ◮
Back Close
Full Screen / Esc
Printer-friendly Version
Interactive Discussion
Discussion
P
a
per
|
Dis
cussion
P
a
per
|
Discussion
P
a
per
|
Discussio
n
P
a
per
|
nitrogen deposition (Lamarque et al., 2005), atmospheric CO2 concentration (C4MIP reconstruction from Friedlingstein et al., 2006), population density (KleinGoldewijk, 2001), and harvest/land cover (Hurtt et al., 2006) change for the years 1798–2004.
We extended these simulations into the future by applying climate anomalies based on future climate projections of the coupled climate models ECHAM5/MPI-OM (Roeck-5
ner et al., 2006) and CCSM (Meehl et al., 2006), both forced with the SRES A1B sce-nario (Nakicenovic et al., 2000). Both climate model simulations cover the time period 1860 to 2100. The climate models differ in their future projections. For example, the global mean temperature increases are stronger in the ECHAM5/MPI-OM projection compared to CCSM (Fig. 1a).
10
We defined climate anomalies as the mean difference between monthly mean fu-ture projections and a base period (1948–1972) for the climate models and applied these to the NCEP/NCAR reanalysis climate forcing (1948–1972) used to force the CLM-CN model. As a result CLM-CN was in this study forced from 1973 onwards with NCEP/NCAR reanalysis climate forcing scaled by climate anomalies. A subset of 15
our simulations used three different ensemble climate model simulations from each cli-mate model. The different ensembles led to very similar results for both climate model projections and will not be further discussed.
Future changes in population density followed the SRES A1 projections for the SRES world regions (CIESIN, 2002), in which global population increases up to the year 2050 20
and slightly declines afterwards (Fig. 1b). Future atmospheric CO2 concentration
fol-lowed the SRES A1B projections, while nitrogen deposition remained at a present day level. Future harvest/land cover change rates were prescribed following the Repre-sentative Concentration pathways (RCPs) projections 30, 40, 60, and 85 (Moss et al., 2010). The land cover change and wood harvest trajectories were represented in CLM-25
CN through annual time series of vegetation parameters as described in Lawrence et al. (2011b). The RCPs are named according to their radiative forcing level in 2100, i.e. RCP 85 corresponds to a radiative forcing of 8.5 W m−2 in 2100. The single RCP
BGD
8, 9709–9746, 2011Fires during the 21st century
S. Kloster et al.
Title Page
Abstract Introduction
Conclusions References
Tables Figures
◭ ◮
◭ ◮
Back Close
Full Screen / Esc
Printer-friendly Version
Interactive Discussion
Discussion
P
a
per
|
Dis
cussion
P
a
per
|
Discussion
P
a
per
|
Discussio
n
P
a
per
|
the year 2005 derived by Hurtt et al. (2006). The RCP projections differ, for example, in the projected crop area (Fig. 1c). These variations in land cover have important consequences for landscape and deforestation fires.
In sensitivity experiments single forcing factors (climate, population density, and har-vest/land cover change) were individually held constant at preindustrial (year 1850) 5
values throughout the simulation period (Table 1). We then took the difference be-tween the primary simulation and the single forcing runs to isolate the contribution of a single factor to changes in fires.
4 Results
We found that global fire emissions increased in response to combined changes in 10
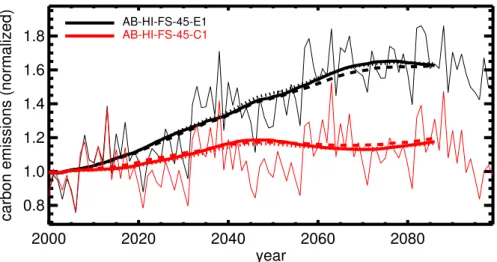
climate, land use change, and demography. Global annual mean fire carbon emis-sions from the simulation (AB-HI-FS, Table 1) for which we obtained the best match with contemporary observations (Kloster et al., 2010) are shown in Fig. 2. In these simulations both human ignition and fire suppression parameterization were derived from time series of population density (SRES A1B) and harvest and land use followed 15
the RCP 45 projection. We forced the model with two different climate projections (ECHAM5/MPI-OM or CCSM, see also Table 1). Global annual mean future (2075– 2099) fire emissions increased by 17 % for CCSM and by 62 % for ECHAM5/MPI-OM compared to present day (1985–2009). This corresponded to increases of 0.29 and 1.03 PgC yr−1, respectively. The largest increase in absolute terms for both climate
20
projections occured in Southern Hemisphere South America (0.20 and 0.57 TgC yr−1,
respectively).
Regionally we found strong differences in the response, as a result of combined changes in climate, land use change, and demography. To disentangle the simulated changes in future fire emissions caused by these different drivers we performed sensi-25
BGD
8, 9709–9746, 2011Fires during the 21st century
S. Kloster et al.
Title Page
Abstract Introduction
Conclusions References
Tables Figures
◭ ◮
◭ ◮
Back Close
Full Screen / Esc
Printer-friendly Version
Interactive Discussion
Discussion
P
a
per
|
Dis
cussion
P
a
per
|
Discussion
P
a
per
|
Discussio
n
P
a
per
|
in climate led to an increase in fire carbon emissions in 2075–2099 compared to
prein-dustrial (+22 % and+66 % for CCSM and ECHAM5/MPI-OM, respectively). Changes
in population density led to an increase in fire emissions when only human ignition was taken into account by+22 %. When changes in fire management efforts to suppress fires in densely populated areas also were included, fire carbon emissions decreased 5
by−6 %. Projected harvest and land use change led to a decrease in fire emissions, with the magnitude of the response depending on the RCP scenario applied (−5 to −35 %).
In the following sections we examine the simulated changes in future fire emissions attributable to different drivers (climate, population density, and harvest/land cover 10
change) in more detail.
4.1 Response of fire to future changes in climate
Fire emissions respond to changes in climate via a range of factors, including changes in fuel moisture, fuel availability, and fire spread (e.g. Spracklen et al., 2009; Flanni-gan et al., 2009). Changes in fire emissions are closely connected to changes in the 15
hydrological cycle. However, future projections of the hydrological cycle are very un-certain. While models show, for example, a consistent increase in globally averaged precipitation with global warming, they differ substantially in magnitude as well as in the spatial and seasonal distributions (Meehl et al., 2007). To partly account for this, we investigated the impact of changes in climate on fire emissions using output from 20
two different coupled ocean-atmosphere models (CCSM and ECHAM5/MPI-OM) both
forced with the IPCC SRES A1B scenario.
The annual mean fire emissions changes due to climate at the end of the 21st cen-tury (2075–2099) simulated for the different climate projections differed substantially in their spatial distribution (Fig. 4). Globally, the annual mean emissions increased for 25
BGD
8, 9709–9746, 2011Fires during the 21st century
S. Kloster et al.
Title Page
Abstract Introduction
Conclusions References
Tables Figures
◭ ◮
◭ ◮
Back Close
Full Screen / Esc
Printer-friendly Version
Interactive Discussion
Discussion
P
a
per
|
Dis
cussion
P
a
per
|
Discussion
P
a
per
|
Discussio
n
P
a
per
|
response for the two climate projections was largest for Southern Hemisphere South America, central Asia, and Northern Hemisphere Africa (Table 2).
In the fire model applied in this study simulated fires depended directly on probabil-ity functions representing the availabilprobabil-ity of biomass (aboveground biomass), moisture (soil moisture), and ignition (lightning and human ignition) (Kloster et al., 2010). The 5
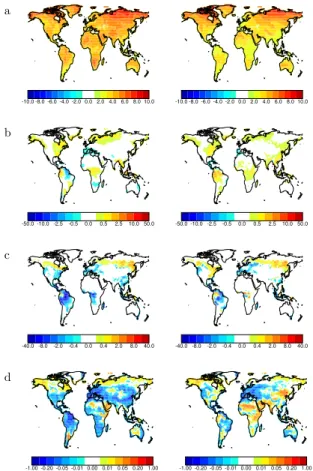
moisture and biomass probability functions responded to changes in climate. Changes in fire emissions as a response to climate change followed in most regions closely the simulated response in soil moisture and resulting moisture probability for fire occur-rence (Figs. 5d and 6b). Reduced soil moisture coincided in many regions with de-creased aboveground biomass and thus lower fuel loads (Figs. 5c and 6a). Therefore, 10
changes in simulated fire emissions were a result of changes in moisture and changes in biomass. However, the overall response pattern was dominated by the simulated re-sponse in the moisture probabilities. Only in some regions, changes in fire emissions were dominated by differences in the aboveground biomass. Southern Europe, for ex-ample, experienced a decrease in precipitation rates according to both applied future 15
climate forcings. The lower precipitation rate led to an increase in moisture probability, but also to a decrease in available biomass for burning and thus a decrease in above-ground biomass and fuel load. Overall the decrease in fuel load (biomass probability) prevailed for Southern Europe resulting in lower future fire emissions (Fig. 4).
Large parts of the Northern Hemisphere showed strong spatial coherency in the re-20
sponse of fire to the two climate projections, with increasing future fire emissions, for example, in Northern Europe and decreasing emissions over Southern Europe (Fig. 4). For the boreal regions (Boreal Asia and Boreal North America) the changes in precipi-tation from the two different climate projections were very similar (Fig. 5b), as were the simulated changes in moisture (Fig. 5d) and biomass (Fig. 5c).
25
BGD
8, 9709–9746, 2011Fires during the 21st century
S. Kloster et al.
Title Page
Abstract Introduction
Conclusions References
Tables Figures
◭ ◮
◭ ◮
Back Close
Full Screen / Esc
Printer-friendly Version
Interactive Discussion
Discussion
P
a
per
|
Dis
cussion
P
a
per
|
Discussion
P
a
per
|
Discussio
n
P
a
per
|
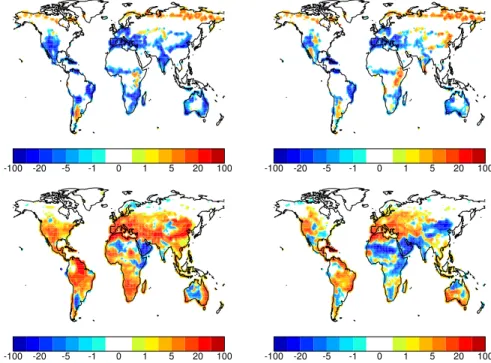
The majority of the grid cells in burn regions, however, showed no change in the month of maximum burning. The length of the burning season (number of months in which fire emissions occured) extended in some regions (Fig. 7b). This change in the fire regime was especially prominent in Central Asia. Here fire emission peaked not only in May but also in August and emissions stayed relatively high in between (Fig. A1). Fires 5
were simulated for all months of the year, including December and January, which ex-perienced no burning without changing climate. This increase in fire emissions and the longer burning season was a result of decreasing soil moisture, which was most pro-nounced for the ECHAM5/MPI-OM climate projection (Fig. A1). At the same time, fuel loads were reduced lowering the biomass probability, which however, was not sufficient 10
to outweigh the increase in fire emissions caused by drier fuels.
The difference in the global response of fire emissions to changes in climate was largely explained by differences over South America and Africa. South America and Africa were the continents that contributed the most to the preindustrial global annual fire emissions (∼25 % and ∼50 %, respectively, Table 2). For South America both fu-15
ture climate forcings led to an increase in fire emissions. However, the response was stronger for the ECHAM5/MPI-OM forcing (+61 % and+84 % for Northern and South-ern Hemisphere South America, respectively) than for the CCSM forcing (+22 % and
+33 % , respectively, Table 2). The difference in fire emissions responses for the two climate projections was a result of differences in projected changes in soil moisture 20
(Fig. 9b). The decreases in soil moisture from the ECHAM5/MPI-OM projection re-sulted in increases in fire carbon emissions for Southern Hemisphere South America not only in September, but also high emissions in October and November (Fig. A2). The ECHAM5/MPI-OM climate projections decreased precipitation to almost zero in August averaged over Southern Hemisphere South America. This resulted in lower 25
BGD
8, 9709–9746, 2011Fires during the 21st century
S. Kloster et al.
Title Page
Abstract Introduction
Conclusions References
Tables Figures
◭ ◮
◭ ◮
Back Close
Full Screen / Esc
Printer-friendly Version
Interactive Discussion
Discussion
P
a
per
|
Dis
cussion
P
a
per
|
Discussion
P
a
per
|
Discussio
n
P
a
per
|
For Africa fire emissions increased with the ECHAM5/MPI-OM climate projection (+50 %), while they decreased with CCSM climate projection (−5 %). Both projections showed an increase in precipitation over Africa (Fig. 5b). However, only the simulation forced with CCSM forcing resulted in an increase in soil moisture (Fig. 5d) over central Africa and thus a decrease in fire emissions. In contrast, the simulation forced with 5
ECHAM5/MPI-OM projection showed an decrease in soil moisture over much of Africa, despite increasing precipitation. The decrease in soil moisture was caused by higher evaporation rates that exceeded the increase in precipitation. Higher evaopration rates were in turn caused by increases in surface temperatures that were stronger in the ECHAM5/MPI-OM projection compared to the CCSM projection (Fig. 5a). While the 10
precipitation change by the two climate models over Africa was comparable, the overall changes in the hydrological cycle defining the soil moisture and thus fire occurrence probability were not. This was also reflected in the seasonal changes (Fig. A3). With the ECHAM5/MPI-OM forcing fire emissions increased for Northern Hemisphere Africa strongly in the burning season and the months with maximum emissions remained 15
February and March. With CCSM climate projections, however, the simulated decrease in fire emissions was most pronounced for these peak months.
4.2 Response of fire to future changes in population density
The response of fire emissions to changes in population density is controlled via two counteracting processes. An increase in population leads to an increase in ignition 20
sources as well as to an increase in fire management efforts set in place to suppress fires. In the model, the probability of human ignition increased with increasing pop-ulation density, while fire suppression rates were highest in densely populated areas (Kloster et al., 2010). Changes in population density were prescribed following Klein-Goldewijk (2001) up to the year 2004. For future years (2005 to 2100) population 25
BGD
8, 9709–9746, 2011Fires during the 21st century
S. Kloster et al.
Title Page
Abstract Introduction
Conclusions References
Tables Figures
◭ ◮
◭ ◮
Back Close
Full Screen / Esc
Printer-friendly Version
Interactive Discussion
Discussion
P
a
per
|
Dis
cussion
P
a
per
|
Discussion
P
a
per
|
Discussio
n
P
a
per
|
When only human ignition was considered in the model, global future fire emissions increased until 2050 as a response to globally increasing population density and stayed almost constant thereafter (Fig. 3, HI case). Taking also fire management into account, global fire emission did not change significantly over the course of the 21st century (Fig. 3; HI-FS case).
5
When only human ignition was considered fire emissions increased globally by 20 % compared to preindustrial times (Table 2). Regionally, increases in fire from human ignition were largest in central America (a 47 % increase) and Equatorial Asia (a 44 % increase). When fire suppression was included, in some regions fire emissions still increased (Northern Hemisphere South America (+22 %), Southern Hemisphere South 10
America (+3 %), boreal North America (+3 %), Australia (+14 %)). However, globally the increase in fire suppression dominated the response and fire emissions decreased
globally by −6 %. Decreases were largest in southern East Asia, Europe and the
Middle East (−33,−29, and−29 %, respectively).
4.3 Response of fire to future changes in harvest and land use
15
The impact of harvest and land use on simulated fire emissions occurs as a result of two different mechanisms. Harvest and changes in land use alter the biomass available for burning and thus emissions from natural landscape fires. In addition, fires are often used as a tool for forest clearing leading to an additional fire source (deforestation fires). For the 20th century we found that globally total fire emissions (landscape and 20
deforestation) decreased as a result of harvest and land use change (Kloster et al., 2010). The simulations presented here showed that this trend generally continues (Fig. 9). Although the response varied considerably between different harvest/land cover change projections (RCP 26, 40, 60, and 85, respectively).
Globally, total (deforestation and landscape) fire emissions decreased by the largest 25
amount for the RCP 85 projection (averaged over the period 2075–2099 by −35 %,
BGD
8, 9709–9746, 2011Fires during the 21st century
S. Kloster et al.
Title Page
Abstract Introduction
Conclusions References
Tables Figures
◭ ◮
◭ ◮
Back Close
Full Screen / Esc
Printer-friendly Version
Interactive Discussion
Discussion
P
a
per
|
Dis
cussion
P
a
per
|
Discussion
P
a
per
|
Discussio
n
P
a
per
|
At a regional scale, RCP 26 and RCP 60 scenarios differed considerable. RCP 30 led to strong decreases in total fire emissions over northern and Southern Hemisphere Africa (−33 % compared to−16 % for RCP 60), while for RCP 60 the decrease was strongest over south East and Equatorial Asia (−52 % compared to −30 % for RCP 26).
5
For all the RCP projections deforestation fire emissions were lower during 2075– 2099 compared to present day, as a result of decreased land conversion rates (see also Fig. 1c). Although, the RCP projection 30 and 85 peaked in between (∼2020 and ∼2015, respectively). Averaged over 2000–2024 deforestation fires emitted globally 134, 64, 145, and 86 Tg C yr−1(RCP 26, 45, 60 and 85, respectively). This was reduced
10
for the period 2075–2099 to 60, 15, 58, and 35 Tg C yr−1, respectively. Thereby, the
burning fraction of the biomass that was left on site after land use conversion remained relatively constant over time (between 33 to 42 %).
The different magnitudes with which landscape fire emissions decreased in the sin-gle RCPs (−20, −5, −21, −34 % for RCP 26, 45, 60, 85, respectively) was partly 15
reflected in the different projections for wood harvest rates that were on average 0.77, 0.78, 1.51, and 1.83 PgC yr−1 between preindustrial times and 2100 for the scenarios
RCP 26, 45, 60 and 85, respectively. Harvest led to a reduction of biomass available for burning, which overall reduced natural landscape emissions. However, the response varied considerably on regional scale for the different harvest and land use change 20
projections (Fig. 9).
Note here, that Lawrence et al. (2011b) found that the carbon harvest rates in our model for the RCP 60 and RCP 85 were higher than what was intended to be pre-scribed from the wood harvest areas given by the harmonized RCP projections (Hurtt,
2009). The simulated wood harvest carbon flux for RCP 60 and RCP 85 was∼5 and
25
8 PgC yr−1 in 2100, respectively. The Global Land Model (GLM, Hurtt (2009)), which
BGD
8, 9709–9746, 2011Fires during the 21st century
S. Kloster et al.
Title Page
Abstract Introduction
Conclusions References
Tables Figures
◭ ◮
◭ ◮
Back Close
Full Screen / Esc
Printer-friendly Version
Interactive Discussion
Discussion
P
a
per
|
Dis
cussion
P
a
per
|
Discussion
P
a
per
|
Discussio
n
P
a
per
|
logging techniques and secondary tree growth in the different RCPs, which will have to be further investigated. Lower wood harvest rates, might led to a less pronounced decrease in landscape fire emissions caused by harvest/land use as simulated here.
5 Discussion and conclusions
We applied a global land carbon model (CLM-CN) that interactively simulated land-5
scape fire carbon emissions to investigate the response of future fires to projected changes in climate, population density, and harvest/land cover change during the 21st century. A previous study showed that the model captured the large scale contempo-rary observed fire patterns as well as observed trends in fire emissions during the 20th century, leading to some confidence that the model includes parameterizations that 10
represent the sensitivity of fire emissions to important climate and land cover drivers. We tested the response of future fire emissions to a range of future forcing projec-tions and found that in the model:
– Fire emissions increased as a response to future climate change. For this anal-yses we applied future climate projections from two different climate models 15
(CCSM and ECHAM5/MPI-OM), both following the SRES A1B scenario. Use of the ECHAM5/MPI-OM climate projection to force CLM-CN resulted in a con-siderable increase in fire emissions globally (+66 % in 2075–2099 compared to preindustrial). Fire emissions increased less when we used CCSM climate projec-tions (+22 %). In most regions changes in fire emissions were caused by primarily 20
changes in the length and intensity of the dry season, with many regions showing increases in the drought stress during the dry season. Climate-induced changes in fuel availability also had effect on fire emissions, with reduced levels of net primary production and fuel loads limiting fire emissions in some regions.
– Fire emissions increased globally as a response to increases in future population 25
BGD
8, 9709–9746, 2011Fires during the 21st century
S. Kloster et al.
Title Page
Abstract Introduction
Conclusions References
Tables Figures
◭ ◮
◭ ◮
Back Close
Full Screen / Esc
Printer-friendly Version
Interactive Discussion
Discussion
P
a
per
|
Dis
cussion
P
a
per
|
Discussion
P
a
per
|
Discussio
n
P
a
per
|
taken into account. Fire emissions remained almost constant globally as a re-sponse to changing population density in the future when besides human ignition also fire management (e.g. fire suppression) set in place in densely populated ar-eas was considered. In this case emissions incrar-eased in South America, Australia and boreal North America but decreased in all other regions.
5
– Fire emissions decreased as a response to future projections of harvest/land cover change. In all future projections harvest/land cover change reduced avail-able fuel load and consequently natural fire emissions. The decrease in total (natural and deforestation) fire emissions was weakest (−5 %) in the RCP45 and strongest (−35 %) in the RCP85 projections averaged over the period 2075–2099. 10
– Overall fire emissions increased in the future assuming that harvest/land cover change will follow the RCP 45 trajectory and population changes will impact fire ignition and suppression in the case of the CCSM climate forcing by 17 % and the ECHAM5/MPI-OM climate forcing by 62 % compared to present day.
Increasing future fire emissions have been reported in earlier work based on global 15
fire models with varying levels of complexity (Scholze et al., 2006; Krawchuk et al., 2009; Pechony and Shindell, 2010). However, regionally the response pattern dif-fered substantially in these global studies as well as in regional studies that focused on the impact of climate change on fires for specific regions (mostly North America, e.g. Spracklen et al., 2009; Euskirchen et al., 2009; Amiro et al., 2009; Flannigan et al., 20
2000). Flannigan et al. (2009) analysed around 40 published studies that investigated the implications of changing climate for global wildland fire on different scales and with models of different complexity. They concluded that fire activity will generally increase in the future, but there will be regions with no changes and regions with decreases. For the boreal and temperate regions they found an overall consensus that the fire 25
BGD
8, 9709–9746, 2011Fires during the 21st century
S. Kloster et al.
Title Page
Abstract Introduction
Conclusions References
Tables Figures
◭ ◮
◭ ◮
Back Close
Full Screen / Esc
Printer-friendly Version
Interactive Discussion
Discussion
P
a
per
|
Dis
cussion
P
a
per
|
Discussion
P
a
per
|
Discussio
n
P
a
per
|
the use of different projections of future climate in individual studies. Our simulations showed that climate projections for the 21st century from two different global climate models that both applied the same SRES A1B scenario resulted in projected fire emis-sion trends that showed considerable difference for example in Africa, between a slight decreasing trend up to a moderate increase in future fire emissions. In a recent study 5
Pechony and Shindell (2010) showed that the same climate model but different SRES projections resulted in broadly similar spatial patterns of fire emissions but different magnitudes. Similar findings were reported by Scholze et al. (2006). These diff er-ences in climate projections reflect the range of possible future climate developments and applied in fire models the range of possible climate driven changes in fire emis-10
sions. In light of this variability between climate models, an intercomparison of the sensitivity of fire models to future climate change would require the use of the same cli-mate projection. This could be done, for example by embedding multiple fire emissions models within the same vegetation-carbon model. Our study suggests, in addition, that changes in population and harvest and land use will also have a considerable influ-15
ence on the trajectory of fire emissions during the 21st century. Projections of these factors and their influence of fire emissions vary considerably depending on future sce-nario assumptions of socio-economic development and the implementation of these land use scenarios within Earth System Models.
Although our model captures some of the temporal and spatial variability of contem-20
porary fires (Kloster et al., 2010) there are a number of processes in the model that are based on a rather incomplete understanding of human-fire interactions (Pechony and Shindell, 2010). Human-fire interactions are to a large part socio-economically controlled with varying fire management practices ranging from active fire suppression efforts, typically applied in regions were high property values are at risk, to the use of 25
BGD
8, 9709–9746, 2011Fires during the 21st century
S. Kloster et al.
Title Page
Abstract Introduction
Conclusions References
Tables Figures
◭ ◮
◭ ◮
Back Close
Full Screen / Esc
Printer-friendly Version
Interactive Discussion
Discussion
P
a
per
|
Dis
cussion
P
a
per
|
Discussion
P
a
per
|
Discussio
n
P
a
per
|
information on past fire activity, e.g. reconstructed from charcoal sediments (Power et al., 2010), explored in more detail in conjunction with reconstructed land use change pattern will hopefully allow for improvements in our current understanding of human-fire interactions.
Another parameter we did not consider in the fire model is the impact of climate 5
change on lightning activity and subsequent effects on ignition. Price and Rind (1994) explored the impact of climate change on lightning-caused fires and concluded for North America that the burned area will increase by 78 % as a response to increased lightning activity caused by a doubling of atmospheric CO2concentration. To our
knowl-edge there is no estimate how increased lightning activity affects fire emissions on a 10
global scale. Such an assessment, however, will have to take into account the number of human ignitions and fire management efforts as well.
Due to computational limitations we were only able to apply climate projections from two different climate models, which, however, showed large differences in the simulated future fire emissions. In the future it will be desirable to apply a larger set of future 15
climate model projections. CMIP5 (Taylor et al., 2009) will form here a ideal consistent basis.
The simulation presented here showed that climate also had a substantial indirect control on future fire carbon emission through the alteration of fuel availability. Harvest and land use also impacted fire emissions through changes in fuel load. A coupled 20
vegetation-carbon model as used in this study allowed us to account for this, in con-trast to other studies that were solely based in statistical relationships (Krawchuk et al., 2009) or did have to prescribe biomass density (Pechony and Shindell, 2010). How-ever, fire emissions will be also indirectly controlled through changes in vegetation structure that is in turn partly controlled by fire itself. This feedback can be accounted 25
with dynamic global vegetation models (DGVMs) which should be the preferred tool to study fire-climate interactions.
BGD
8, 9709–9746, 2011Fires during the 21st century
S. Kloster et al.
Title Page
Abstract Introduction
Conclusions References
Tables Figures
◭ ◮
◭ ◮
Back Close
Full Screen / Esc
Printer-friendly Version
Interactive Discussion
Discussion
P
a
per
|
Dis
cussion
P
a
per
|
Discussion
P
a
per
|
Discussio
n
P
a
per
|
feedback we will have to improve our current ability to represent fires as an active climate dependent component of the Earth System. A fire model as presented in this study is a first step towards this direction.
Acknowledgements. This work was supported by the U.S. National Science Foundation (NSF ATM-0628637, NSF AGS-1048890). For computational support the authors acknowledge NSF
5
and the National Center for Atmospheric Research (NCAR). NCAR is sponsered by the NSF.
The service charges for this open access publication have been covered by the Max Planck Society.
References
10
Amiro, B., Cantin, A., Flannigan, M., and de Groot, W.: Future emissions from Canadian boreal forest fires, Can. J. Forest Res., 39, 383–395, doi:10.1139/X08-154, 2009. 9724
Arora, V. K. and Boer, G. J.: Fire as an interactive component of dynamic vegetation models, J. Geophys. Res., 110, G02008, doi:10.1029/2005JG000042, 2005. 9711, 9713
Boden, T., Marland, G., and Andres, B.: Global CO2 Emissions from Fossil-Fuel Burning,
15
Cement Manufacture, and Gas Flaring: 1751–2008, available at: http://cdiac.ornl.gov/ftp/ ndp030/global.1751 2008.ems (last access: July 2011), 2009. 9711
Bowman, D. M. J. S., Balch, J. K., Artaxo, P., Bond, W. J., Carlson, J. M., Cochrane, M. A., D’Antonio, C. M., DeFries, R., Doyle, J. C., Harrison, S. P., Johnston, F. H., Keeley, J. E., Krwchuk, M. A., Kull, C. A., Marston, J. B., Mortiz, M. A., Prentice, I. C., Roos, C. I., Scott,
20
A. C., Swetnam, T. W., van der Werf, G. R., and Pyne, S. J.: Fire in the Earth System, Science, 324, 481, doi:10.1126/science.1163886, 2009. 9711, 9712, 9725, 9726
CIESIN: Country-level Population and Downscaled Projections based on the A1 Scenario, 1990-2100, [digital version]., Center for International Earth Science Information Network, Columbia University, Palisades, NY, available at: http://www.ciesin.columbia.edu/datasets/
25
downscaled (last access: June 2011), 2002. 9715, 9720, 9733, 9735
Euskirchen, E. S., McGuire, a. D., Rupp, T. S., Chapin, F. S., and Walsh, J. E.: Projected changes in atmospheric heating due to changes in fire disturbance and the snow season in the western Arctic, 2003–2100, J. Geophys. Res., 114, 1–15, doi:10.1029/2009JG001095, 2009. 9724
BGD
8, 9709–9746, 2011Fires during the 21st century
S. Kloster et al.
Title Page
Abstract Introduction
Conclusions References
Tables Figures
◭ ◮
◭ ◮
Back Close
Full Screen / Esc
Printer-friendly Version
Interactive Discussion
Discussion
P
a
per
|
Dis
cussion
P
a
per
|
Discussion
P
a
per
|
Discussio
n
P
a
per
|
Flannigan, M., Stocks, B., and Wotton, B.: Climate change and forest fires, Sci. total Environ., 262, 221–9, 2000. 9724
Flannigan, M. D., Krawchuk, M. A., de Groot, W. J., Wotton, B. M., and Gowman, L. M.: Impli-cations of changing climate for global wildland fire, International Journal of Wildland Fire, 18, 483, doi:10.1071/WF08187, 2009. 9711, 9717, 9724, 9725
5
Friedlingstein, P., Cox, P., Betts, R., Bopp, L., von Bloh, W., Brovkin, V., Cadule, P., Doney, S., Eby, M., Fung, I., Bala, G., John, J., Jones, C., Joos, F., Kato, T., Kawamiya, M., Knorr, W., Lindsay, K., Matthews, H. D., Raddatz, T., Rayner, P., Reick, C., Roeckner, E., Schnitzler, K.-G., Schnur, R., Strassmann, K., Weaver, a. J., Yoshikawa, C., and Zeng, N.: ClimateCarbon Cycle Feedback Analysis: Results from the C 4 MIP Model Intercomparison, J. Climate, 19,
10
3337–3353, doi:10.1175/JCLI3800.1, 2006. 9715
Gillett, N. P., Weaver, A. J., Zwiers, F. W., and Flannigan, M. D.: Detecting the ef-fect of climate change on Canadian forest fires, Geophys. Res. Lett., 31, L18211, doi:10.1029/2004GL020876, 2004. 9711
Houghton, R. A., Hobbie, J. E., Melillo, J. M., Morre, B., Peterson, B. J., Shaver, G. R., and
15
Woodwell, G. M.: Changes in the carbon content of terrestial biota and soils between 1860 and 1980 – A net release of CO2 to the atmosphere, Ecol. Monogr., 53, 235–262, 1983. 9714
Hurtt, G.: Harmonisation of global land-use scenarios for the period 1500–2100 for IPCC-AR5, IGBP iLEAPS Newsletter, 7, 6–8, 2009. 9722
20
Hurtt, G. C., Frolking, S., Fearon, M. G., Moore, B., Shevliakova, E., Malyshev, S., Pacala, S. W., and Houghton, R. A.: The underpinnings of land-use history: three centuries of global gridded land-use transitions, wood-harvest activity, and resulting secondary lands, Glob. Change Biol., 12, 1208–1229, doi:10.1111/j.1365-2486.2006.01150.x, 2006. 9714, 9715, 9716, 9733, 9734
25
KleinGoldewijk, K.: Estimating global land use change over the past 300 years: The HYDE Database, Global Biogeochem. Cy., 15, 417–433, 2001. 9715, 9720, 9733
Kloster, S., Mahowald, N. M., Randerson, J. T., Thornton, P. E., Hoffman, F. M., Levis, S., Lawrence, P. J., Feddema, J. J., Oleson, K. W., and Lawrence, D. M.: Fire dynamics during the 20th century simulated by the Community Land Model, Biogeosciences, 7, 1877–1902,
30
doi:10.5194/bg-7-1877-2010, 2010. 9712, 9713, 9714, 9716, 9718, 9720, 9721, 9725 Krawchuk, M., Moritz, M., Parisien, M., Dorn, J. V., and Hayhoe, K.: Global pyrogeography: the
BGD
8, 9709–9746, 2011Fires during the 21st century
S. Kloster et al.
Title Page
Abstract Introduction
Conclusions References
Tables Figures
◭ ◮
◭ ◮
Back Close
Full Screen / Esc
Printer-friendly Version
Interactive Discussion
Discussion
P
a
per
|
Dis
cussion
P
a
per
|
Discussion
P
a
per
|
Discussio
n
P
a
per
|
2009. 9724, 9726
Lamarque, J. F., Kiehl, J., Brasseur, G., Butler, T., Cameron-Smith, P., Collins, W. D., Collins, W. J., Granier, C., Hauglustaine, D., Hess, P., Holland, E., Horowitz, L., Lawrence, M., McKenna, D., Merilees, P., Prather, M., Rasch, P., Rotman, D., Shindell, D., and Thornton, P.: Assessing future nitrogen deposition and carbon cycle feedbacks using a
5
multi-model approach: Analysis of nitrogen deposition, J. Geophys. Res., 110, D19303, doi:10.1029/2005JD005825, 2005. 9715
Lawrence, D. M., Oleson, K. W., Flanner, M. G., Thornton, P. E., Swenson, S. C., Lawrence, P. J., Zeng, X., Yang, Z.-L., Levis, S., Sakaguchi, K., and Bonan, Gordon B. a nd Slater, A. G.: Parameterization improvements and functional and structural advances in Version 4 of the
10
Community Land Model, J. Adv. Model. Earth Syst., 3, 1–27, doi:10.1029/2011MS000045, 2011a. 9713
Lawrence, P., Feddema, J., Bonan, G., Meehl, G., O’Neill, B., Levis, S., Lawrence, D., Oleson, K., Kluzek, E., Lindsay, K., and Thornton, P.: Simulating the Biogeochemical and Biogeo-physical impacts of the transient land cover change and wood harvest in the Community
15
Climate System Model (CCSM4) from 1850 to 2100, J. Climate, submitted, 2011b. 9715, 9722
LIS/OTD: Lightning Imaging Sensor/Optical Transient Detector: NASA LIS/OTD Science Team (Principal Investigator, Dr. Hugh J. Christian, NASA/Marshall Space Flight Center), available from the Global Hydrology Resource Center, available at: http://ghrc.msfc.nasa.gov, 2011.
20
9713
Marlon, J. R., Bartlein, P. J., Walsh, M. K., Harrison, S. P., Brown, K. J., Edwards, M. E., Higuera, P. E., Power, M. J., Anderson, R. S., Briles, C., Brunelle, a., Carcaillet, C., Daniels, M., Hu, F. S., Lav oie, M., Long, C., Minckley, T., Richard, P. J. H., Scott, A. C., Shafer, D. S., Tinner, W., Umbanhowar, C. E., and Whitlock, C.: Wildfire responses to abrupt climate change in
25
North America, P. Natl. Acad. Sci. USA, 106, 2519–24, doi:10.1073/pnas.0808212106, 2009. 9711, 9712
Meehl, G., Washington, W., Santer, B., Collins W. D., Arblaster, J. M., Hu, A., Lawrence, D. M., Teng, H., Buja, L. E., and Strand, W. G.: Climate change projections for the twenty-first
30
century and climate change commitment in the CCSM3, J. Climate, 19, 2597–2616, 2006. 9715, 9733, 9734, 9735, 9736, 9737, 9738
BGD
8, 9709–9746, 2011Fires during the 21st century
S. Kloster et al.
Title Page
Abstract Introduction
Conclusions References
Tables Figures
◭ ◮
◭ ◮
Back Close
Full Screen / Esc
Printer-friendly Version
Interactive Discussion
Discussion
P
a
per
|
Dis
cussion
P
a
per
|
Discussion
P
a
per
|
Discussio
n
P
a
per
|
R., Noda, J. M. A., Raper, S., Watterson, I., Weaver, A., and Zhao, Z.-C.: Global Climate Projections, in: Climate Change 2007: The Physical Science Basis. Contribution of working group I to the fourth Assessment Report on the Intergovernmental Panel on Climate Change, edited by: Solomon, S., Wuin, D., Manning, M., Chen, Z., Marquis, M., Averyt, K., Tignor, M., and Miller, H., Cambridge University Press, Cambrige, United Kingdom and New York, NY,
5
USA, 2007. 9717
Moss, R. H., Edmonds, J. A., Hibbard, K. A., Manning, M R.., Rose, S. K., van Vuuren, D. P., Carter, T. R., Emori, S., Kainuma, M., Kram, T., Meehl, G. A., Mitchell, J. F. B., Nakicenovix, N., Riahi, K., Smith, S. .J., Stouffer, R. J., Thomson, A. M., Weyant, J. P., and Wilbanks, T. J.: The next generation of scenarios for climate change research and assessment, Nature, 463,
10
747–56, doi:10.1038/nature08823, 2010. 9715, 9733, 9734
Nakicenovic, N., Davidson, O., Davis, G., Gruebler, A., Kram, T., La Rovere, E. L., Metz, B., Morita, T., Pepper, W., Pitcher, H., Sankovski, A., Shukla, P., Swart, R., Watson, R., and Dadi, Z.: Special Report on Emissions Scenarios, in: Contribution to the Intergovernmental Panel on Climate Change, Cambridge University Press, Cambridge, UK, 2000. 9715, 9735
15
Oleson, K. W., Bonan, G. B., Feddema, J., Vertenstein, M., and Grimmong, C. S. B.: An urban paramterization for a global climate model. 1. Formulation and evaluation of two cities, J. Appl. Meteorol. Clim., 47, 1038–1060, 2008. 9712
Pechony, O. and Shindell, D. T.: Driving forces of global wildfires over the past millennium and the forthcoming century, P. Natl. Acad. Sci., 107, 19167–19170,
20
doi:10.1073/pnas.1003669107, 2010. 9724, 9725, 9726
Pierce, E. T.: Latitudinal Variation of Lightning Parameters, J. Appl. Meteorol., 9, 164–165, 1969. 9713
Power, M., Marlon, J., Bartlein, P., and Harrison, S.: Fire history and the Global Charcoal Database: A new tool for hypothesis testing and data exploration, Palaeogeogr.
Palaeocli-25
matol., 291, 52–59, doi:10.1016/j.palaeo.2009.09.014, 2010. 9726
Price, C. and Rind, D.: The impact of 2X CO2Climate on Lightning-Caused Flashes, J. Climate, 7, 1484–1494, 1994. 9726
Qian, T., Dai, A., Trenberth, K. E., and Oleson, K. W.: Simulation of Global Land Surface Conditions from 1948 to 2004. Part I: Forcing Data and Evaluations, J. Hydrometeorol., 7,
30
953, doi:10.1175/JHM540.1, 2006. 9714, 9733
BGD
8, 9709–9746, 2011Fires during the 21st century
S. Kloster et al.
Title Page
Abstract Introduction
Conclusions References
Tables Figures
◭ ◮
◭ ◮
Back Close
Full Screen / Esc
Printer-friendly Version
Interactive Discussion
Discussion
P
a
per
|
Dis
cussion
P
a
per
|
Discussion
P
a
per
|
Discussio
n
P
a
per
|
Neff, J. C., Schuur, E. A. G., and Zender, C. S.: The Impact of Boreal Forest Fire on Climate Warming, Science, 314, 1130–1132, doi:10.1126/science.1132075, 2006. 9726
Randerson, J. T., Hoffman, F. M., Thornton, P. E., Mahowald, N. M., Lindsay, K., Lee, Y.-H., Nevison, C. D., Doney, S. C., Bonan, G., Stoeckli, R., Covey, C., Running, S. W., and Fung, I. Y.: Systematic assessment of terrestial biogeochemistry in coupled climate-carbon models,
5
Glob. Change Biol., 15, 2462–2484, doi:10.1111/j.1365-2486.2009.01912.x, 2009. 9712 Roeckner, E., Brasseur, G., Giorgetta, M., Jacob, D., Jungclaus, J., Reick, C., and
Sill-mann, J.: Climate Projections for the 21st Century, in: Internal Report, p. 28, Max Planck Institut fuer Meteorologie, available at: http://www.mpimet.mpg.de/fileadmin/grafik/presse/ ClimateProjections2006.pdf, 2006. 9715, 9733, 9734, 9735, 9736, 9737, 9738
10
Scholze, M., Knorr, W., Arnell, N. W., and Prentice, I. C.: A climate-change
risk analysis for world ecosystems, P. Natl. Acad. Sci. USA, 103, 13116–13120, doi:10.1073/pnas.0601816103, 2006. 9724, 9725
Seiler, W. and Crutzen, J.: Estimates of the gross and net fluxes of carbon between the biosphere and atmosphere from biomass burning, Clim. Change, 2, 207–247,
15
doi:10.1007/BF00137988, 1980. 9713
Soja, A., Tchebakova, N., French, N., Flannigan, M., Shugart, H., Stocks, B., Sukhinin, a., Parfenova, E., Chapiniii, F., and Stackhousejr, P.: Climate-induced boreal forest change: Predictions versus current observations, Global Planet. Change, 56, 274–296, doi:10.1016/j.gloplacha.2006.07.028, 2007. 9711
20
Spracklen, D. V., Mickley, L. J., Logan, J. a., Hudman, R. C., Yevich, R., Flannigan, M. D., and Westerling, A. L.: Impacts of climate change from 2000 to 2050 on wildfire activity and carbonaceous aerosol concentrations in the western United States, J. Geophys. Res., 114, 1–17, doi:10.1029/2008JD010966, 2009. 9717, 9724
Stoeckli, R., Lawrence, D. M., Niu, G.-Y., Oleson, K. W., Thornton, P. E., Yang, Z.-L., Bonan,
25
G. B., Denning, A. S., and Running, S. W.: The use of Fluxnet in the Community Land Model development, J. Geophys. Res., 113, G01025, doi:10.1029/2007JG000562, 2008. 9712 Taylor, K., Stouffer, R., and Meehl, G.: A Summary of the CMIP5 Experiment Design, available
at: http://cmip-pcmdi.llnl.gov/cmip5/docs/Taylor CMIP5 design.pdf (last access: July 2011), 2009. 9722, 9726
30
BGD
8, 9709–9746, 2011Fires during the 21st century
S. Kloster et al.
Title Page
Abstract Introduction
Conclusions References
Tables Figures
◭ ◮
◭ ◮
Back Close
Full Screen / Esc
Printer-friendly Version
Interactive Discussion
Discussion
P
a
per
|
Dis
cussion
P
a
per
|
Discussion
P
a
per
|
Discussio
n
P
a
per
|
Thornton, P. E., Lamarque, J. F., Rosenbloom, N. A., and Mahowald, N. M.: Influence of carbon-nitrogen cycle coupling on land model response to CO2 fertilization and climate variability, Global Biogeochem. Cy., 21, GB4018, doi:1029/2006GB002868, 2007. 9712
Thornton, P. E., Doney, S. C., Lindsay, K., Moore, J. K., Mahowald, N., Randerson, J. T., Fung, I., Lamarque, J.-F., Feddema, J. J., and Lee, Y.-H.: Carbon-nitrogen interactions
reg-5
ulate climate-carbon cycle feedbacks: results from an atmosphere-ocean general circulation model, Biogeosciences, 6, 2099–2120, doi:10.5194/bg-6-2099-2009, 2009. 9712
Turetsky, M. R., Kane, E. S., Harden, J. W., Ottmar, R. D., Manies, K. L., Hoy, E., and Kasischke, E. S.: Recent acceleration of biomass burning and carbon losses in Alaskan forests and peatlands, Nature Geosci., 4, 27–31, doi:10.1038/ngeo1027, 2011. 9711
10
van der Werf, G. R., Randerson, J. T., Giglio, L., Collatz, G. J., Kasibhatla, P. S., and Arellano Jr., A. F.: Interannual variability in global biomass burning emissions from 1997 to 2004, Atmos. Chem. Phys., 6, 3423–3441, doi:10.5194/acp-6-3423-2006, 2006. 9713, 9734 van der Werf, G. R., Randerson, J. T., Giglio, L., Collatz, G. J., Mu, M., Kasibhatla, P. S.,
Morton, D. C., DeFries, R. S., Jin, Y., and van Leeuwen, T. T.: Global fire emissions and
15
the contribution of deforestation, savanna, forest, agricultural, and peat fires (1997–2009), Atmos. Chem. Phys., 10, 11707–11735, doi:10.5194/acp-10-11707-2010, 2010. 9711, 9743 Westerling, A. L., Hidalgo, H. G., Cayan, D. R., and Swetnam, T. W.: Warming and earlier spring increase western U.S. forest wildfire activity., Science (New York, NY), 313, 940–943, doi:10.1126/science.1128834, 2006. 9711
BGD
8, 9709–9746, 2011Fires during the 21st century
S. Kloster et al.
Title Page
Abstract Introduction
Conclusions References
Tables Figures
◭ ◮
◭ ◮
Back Close
Full Screen / Esc
Printer-friendly Version
Interactive Discussion
Discussion
P
a
per
|
Dis
cussion
P
a
per
|
Discussion
P
a
per
|
Discussio
n
P
a
per
|
Table 1. Control and transient model simulations analyzed in the present study.
Simula-tions used different treatment of human ignition potential, and different assumptions about harvest/land cover change as well as climate forcing.
Name Human ignition1 Pop. density2 harvest/land Climate forcing4 cover change3 future
Transient simulations: 1798–2100
AB-26-E1 constant=0.5 − RCP 26 ECHAM 1
AB-45-E1 constant=0.5 − RCP 45 ECHAM 1
AB-45-C1 constant=0.5 − RCP 45 CCSM 1
AB-60-E1 constant=0.5 − RCP 60 ECHAM 1
AB-85-E1 constant=0.5 − RCP 85 ECHAM 1
AB-HI-45-E1 human ignition transient RCP 45 ECHAM 1 AB-HI-FS-45-E1/2/3 human ign. and fire suppr. transient RCP 45 ECHAM 1/2/3 AB-HI-FS-45-C1/2/3 human ign. and fire suppr. transient RCP 45 CCSM 1/2/3
Sensitivity simulations: 1798–2100
AB-LUC-E1 constant=0.5 − − ECHAM/MPI-OM 1
AB-45-CLIM constant=0.5 − RCP 45 NCEP/NCAR
AB-HI-PI-45-E1 human ignition preindustrial RCP 45 ECHAM/MPI-OM 1 AB-HI-FS-PI-45-E1 human ign. and fire suppr. preindustrial RCP 45 ECHAM/MPI-OM 1
1Di
fferent treatment of human ignition: either a constant value of 0.5 (constant), allowing for human ignition as a function of population density (HI), or human ignition and fire suppression (HI-FS).
2Population density was allowed to vary between 1798 and 2100 (for 1798 to 2004 following KleinGoldewijk (2001),
from 2005 onwards scaled with the SRES A1 projections for the SRES world regions (CIESIN, 2002)) or was held constant at a preindustrial value.
3Harvest/land cover change: either no harvest/land cover change (
−) or transient historical harvest/land cover change between 1850–2004 and between 2005–2100 projected harvest/land cover change following the RCP 26, 45, 60, and 85, respectively (Hurtt et al., 2006; Moss et al., 2010).
4Climate forcing: either cycling periodically through NCEP
BGD
8, 9709–9746, 2011Fires during the 21st century
S. Kloster et al.
Title Page
Abstract Introduction
Conclusions References
Tables Figures
◭ ◮
◭ ◮
Back Close
Full Screen / Esc
Printer-friendly Version
Interactive Discussion
Discussion
P
a
per
|
Dis
cussion
P
a
per
|
Discussion
P
a
per
|
Discussio
n
P
a
per
|
Table 2. Changes in global annual mean fire emissions caused by different forcings agents
averaged over the period 2075–2099 in [TgC yr−1]. Number in brackets are changes in per-centage. Simulations with transient varying forcings were compared to a control simulation in which the forcing was kept constant at preindustrial level. The difference in percentage was calculated relative to the control simulation. Regions used in this study were identical to the one defined in van der Werf et al. (2006): BONA: Boreal North America, TENA: Temper-ate North America, CEAM: Central America , NHSA: Northern Hem. South America, SHSA: Southern Hem. South America, EURO: Europe, MIDE: Middle East, NHAF: Northern Hem. Africa, SHAF: Southern Hem. Africa, BOAS: Boreal Asia, CEAS: Central Asia, SEAS: South East Asia, EQAS: Equatorial Asia, AUST: Australia.
Climate1 Climate1 Harvest/LCC2 Harvest/LCC2 Harvest/LCC2 Harvest/LCC2 pop. density3 pop. density3
ECHAM/MPI-OM CCSM RCP30 RCP45 RCP60 RCP85 HI HI FS
BONA 23.0 (256) 27.0 (300) −4.0 (−13) 0.0 (0) −18.0 (−56) −15.0 (−47) 7.0 (39) 2.0 (12)
TENA 55.0 (56) 21.0 (21) −34.0 (−22) −1.0 (−1) −57.0 (−37) −57.0 (−37) 29.0 (24) −22.0 (−19)
CEAM 36.0 (32) 36.0 (32) −41.0 (−27) −3.0 (−2) −45.0 (−29) −77.0 (−50) 54.0 (47) −20.0 (−17)
NHSA 127.0 (61) 47.0 (22) −14.0 (−4) 0.0 (0) −17.0 (−5) −42.0 (−13) 73.0 (35) 47.0 (22)
SHSA 597.0 (84) 237.0 (33) −134.0 (−10) −20.0 (−2) −130.0 (−10) −293.0 (−22) 173.0 (15) 35.0 (3)
EURO 53.0 (166) 33.0 (103) −50.0 (−54) −8.0 (−9) −47.0 (−51) −39.0 (−42) 7.0 (9) −17.0 (−29)
MIDE 2.0 (13) 1.0 (7) −10.0 (−53) −2.0 (−11) −5.0 (−26.3) −7.0 (−37) 3.0 (20) −4.0 (−29)
NHAF 156.0 (72) −35.0 (−16) −40.0 (−33) −51.0 (−12) −63.0 (−15) −152.0 (−36) 62.0 (19) −76.0 (−23)
SHAF 121.0 (35) 10.0 (3) −145.0 (−29) −38.0 (−8) −87.0 (−17) −197.0 (−39) 88.0 (21) −25.0 (−6)
BOAS 39.0 (650) 33.0 (550) −3.0 (−7) −1.0 (−2) −5.0 (−11) −14.0 (−30) 2.0 (6) −1.0 (−3)
CEAS 182.0 (200) 73.0 (85) −91.0 (−28) −47.0 (−15) −165.0 (−52) −190.0 (−59) 33.0 (15) −42.0 (−24)
SEAS 82.0 (36) 15.0 (7) −134.0 (−37) −60.0 (−16) −190.0 (−52) −178.0 (−49) 49.0 (18) −78.0 (−33)
EQAS 50.0 (70) 19.0 (27) −14.0 (−11) −3.0 (−2) −67.0 (−54) −70.0 (−57) 34.0 (44) −4.0 (−5)
AUST 23.0 (30) 6.0 (8) −28.0 (−29) 3.0 (3) −28.0 (−29) −54.0 (−55) 19.0 (26) 10.0 (14)
GLOB 1386.0 (66) 469.0 (22) −769.0 (−21) −199.0 (−5) −822.0 (−22) −1278.0 (−35) 591.0 (20) −177.0 (−6)
1Response to climate change: future climate anomalies simulated by the climate model ECHAM/MPI-OM (Roeckner
et al., 2006) or CCSM (Meehl et al., 2006).
2Response to Harvest/land cover change: projected changes following the RCP 26, 45, 60, and 85, respectively (Hurtt
et al., 2006; Moss et al., 2010).
3Response to changes in population density: allowing for human ignition as a function of population density (HI), or
BGD
8, 9709–9746, 2011Fires during the 21st century
S. Kloster et al.
Title Page
Abstract Introduction
Conclusions References
Tables Figures
◭ ◮
◭ ◮
Back Close
Full Screen / Esc
Printer-friendly Version
Interactive Discussion
Discussion
P
a
per
|
Dis
cussion
P
a
per
|
Discussion
P
a
per
|
Discussio
n
P
a
per
|
2000 2020 2040 2060 2080 year
15 16 17 18 19
global mean temperature [deg C]
ECHAM/MPI-OM
CCSM
2000 2020 2040 2060 2080 2100 year
0 2000 4000 6000 8000
population [millions]
WORLD
OECD90
ASIA
REF
ALM
2000 2020 2040 2060 2080 2100 year
10 12 14 16 18 20 22 24
Area [10^6 km^2]
RCP 2.6
RCP 4.5
RCP 6.0
RCP 8.5
Fig. 1. Forcing factors applied in this study.(a)Climate – global annual mean surface
temper-ature in [deg C] as simulated with ECHAM/MPI-OM (Roeckner et al., 2006) and CCSM (Meehl et al., 2006). Both models applied the IPCC A1B SRES scenario forcing (Nakicenovic et al., 2000). For each model three ensemble simulations are shown;(b)population – total population for the IPCC A1B SRES scenario for the SRES regions and the global total (CIESIN, 2002);(c)
BGD
8, 9709–9746, 2011Fires during the 21st century
S. Kloster et al.
Title Page
Abstract Introduction
Conclusions References
Tables Figures
◭ ◮
◭ ◮
Back Close
Full Screen / Esc
Printer-friendly Version
Interactive Discussion
Discussion
P
a
per
|
Dis
cussion
P
a
per
|
Discussion
P
a
per
|
Discussio
n
P
a
per
|
2000 2020 2040 2060 2080
year 0.8
1.0 1.2 1.4 1.6 1.8
carbon emissions (normalized)
AB-HI-FS-45-E1
AB-HI-FS-45-C1
Fig. 2. Change in future global annual mean fire emissions normalized to the mean state
![Table 2. Changes in global annual mean fire emissions caused by di ff erent forcings agents averaged over the period 2075–2099 in [TgC yr − 1 ]](https://thumb-eu.123doks.com/thumbv2/123dok_br/18419468.360717/26.918.43.689.259.486/table-changes-global-annual-emissions-caused-forcings-averaged.webp)
![Fig. 1. Forcing factors applied in this study. (a) Climate – global annual mean surface temper- temper-ature in [deg C] as simulated with ECHAM/MPI-OM (Roeckner et al., 2006) and CCSM (Meehl et al., 2006)](https://thumb-eu.123doks.com/thumbv2/123dok_br/18419468.360717/27.918.254.451.43.485/forcing-factors-applied-climate-global-surface-simulated-roeckner.webp)
![Fig. 3. Change in global annual mean fire emissions 1900 to 2100 in [%] introduced by di ff er- er-ent forcings: climate: ECHAM/MPI-OM (CLIM ECHAM 1, Roeckner et al., 2006) in black and CCSM (CLIM CCSM 1, Meehl et al., 2006) in green, respectively; harvest](https://thumb-eu.123doks.com/thumbv2/123dok_br/18419468.360717/29.918.101.606.122.386/change-emissions-introduced-forcings-climate-roeckner-respectively-harvest.webp)
![Fig. 4. Change in annual mean fire emissions in [gC (m − 2 yr)] averaged over 2075–2099 in- in-troduced by changes in climate](https://thumb-eu.123doks.com/thumbv2/123dok_br/18419468.360717/30.918.125.595.188.368/fig-change-annual-emissions-averaged-troduced-changes-climate.webp)

![Fig. 8. Change in annual mean fire emissions in [gC (m − 2 yr)] averaged over 2075–2099 in- in-troduced by changes in population density](https://thumb-eu.123doks.com/thumbv2/123dok_br/18419468.360717/34.918.111.598.187.373/change-annual-emissions-averaged-troduced-changes-population-density.webp)
![Fig. 9. Change in annual mean landscape, deforestation, and total (landscape plus deforestation) fire emissions in [TgC yr −1 ] introduced by di ff erent harvest/land cover change projections (RCP 26, 45, 60, 85) for di ff erent major world regions](https://thumb-eu.123doks.com/thumbv2/123dok_br/18419468.360717/35.918.147.558.47.488/change-landscape-deforestation-landscape-deforestation-emissions-introduced-projections.webp)
