• Nenhum resultado encontrado

THE NON-TARIFF COSTS OF INTERNATIONAL TRADE IN BRAZIL

N/A
N/A
Protected

Academic year: 2020

Share "THE NON-TARIFF COSTS OF INTERNATIONAL TRADE IN BRAZIL"

Copied!
22
0
0

Texto

(1)

The non-tariff costs of international

trade in Brazil

Orlando Monteiro Da Silva * Felipe Dias Gomes Moreira **

Abstract

This study evaluated the evolution of non-tariff costs of international trade in Brazil with MERCOSUR and with four other economic blocs whose countries account for more than 80% of the country’s trade. Bilateral non-tariff costs of trade in the agricultural and manu-facturing sectors were obtained through the subtraction of the geometric mean of tar-iffs from the total trade costs of each pair of trade partners in these sectors. The results showed that tariffs and non-tariff costs have both had a continuous decline in trade within all blocks analyzed except MERCOSUR, especially in the period known as the commodity cycle. Geographical proximity and the country’s participation in MERCOSUR were the factors that explained the reduction of non-tariff costs in international trade in Brazil the most, suggesting that priority should be given to the full implementation of the Agreement among the member countries.

Keywords: Trade costs. Non trade barriers. Bilateral trade. Regional trade agreements.

1. Introduction

The reduction of tariffs in international trade underwent an undeniable pro-gress in recent decades. The various rounds of negotiations of the GATT/WTO, the high number of Regional Trade Agreements (ARC) and even the unilateral libe-ralization, contributed to a substantial reduction in the values of average tariffs applied to many products. However, some products from specific sectors such as the agricultural sector, for example, still have very high tariff levels.

The reduction in tariffs, however, stressed the importance of several other non-tariff measures (NTM) as restrictions on trade. According to United Na-tions Statistical Division (2016), the increase in the frequency in which non-tariff

Submissão: 28/07/2019. Aceite: 24/09/2019.

* Graduado em Agronomia (1976) e mestre em Economia Rural (1979) pela Universidade Federal de Viçosa. PhD em Economia pela North Carolina State University (1990). Atualmente é Professor Titular da Universidade Federal de Viçosa. E-mail: odasilva@ufv.br

** Graduado em Ciências Econômicas pela Universidade Federal de Viçosa. E-mail: felipe.moreira@ ufv.br

(2)

measures are employed has emerged as an alternative to the imposition of limits to traditional commercial policy instruments, such as tariffs, by the multilateral trade agreements. Defining non-tariff measures as “policy measures, other than ordinary customs duties, which may have a potential effect on international tra-de in goods, affecting quantities, prices, or both”, a group of international tratra-de experts (MAST – Multi Agency Specialist Team), created a new classification for the NTM. In this classification of NTMs are included sanitary and phytosanitary measures (SPS), technical barriers (TBT), pre-shipment inspection, government procurement, measures to control prices, licenses, quotas, anti-competitive measu-res related to investment and exports, subsidies and intellectual property rights. In addition to this enormous diversity of cases, the group has also created a new classification for “procedure obstacles” that include situations such as: the beha-vior of public officials, excessive document requirements, administrative delays, inadequate information about laws, regulations and records, lack of compliance with copyright and patents, among others, which directly affect costs (UNCTAD, 2010).

All the issues described above affect trade flows and contribute to the costs of international trade being much greater than the costs of domestic trade. This fact was highlighted by McCallum (1995) when he showed that trade costs between Canadian provinces and American states were 2.6 times higher than those e costs of trade between Canadian provinces with each other. McCallum’s article became a classic when it drew attention to the “border effect” in international trade, and sho-wed that domestic trade (between Canadian provinces) was 22 times higher than international trade (between Canadian provinces and American states), justified by border measures and the general increase in costs.

In Brazil’s case, several studies (DAUMAL; ZIGNAGO, 2010; SILVA; AL-MEIDA; OLIVEIRA, 2007; LEUSIN JR.; AZEVEDO, 2009) showed that the border effect is higher than 30, with justifications based on tariff and non-tariff measu-res, the problems of infrastructure and logistics, in the territory’s size and in the distances to trading partners, exactly the main sources of costs for importers and exporters.

These studies showed that there are too many barriers to international tra-de and that the difference between international and domestic tratra-de costs is much higher than that caused by traditional barriers such as tariffs and quotas.

(3)

In 2004, Anderson and van Wincoop (2004) drew attention to the great values international trade costs for high-income countries. They showed that, for these countries, trade costs correspond to an equivalent rate of 170%, and that the tariffs and barriers on the border corresponded to only 44% of this total. Transpor-tation costs amounted to 21%, while distribution costs in wholesale and retail to other 55% (2,7 = 1,44*1,21*1,55). The costs of trade considered by them included all the costs of taking a product from the producer to the final consumer, discoun-ting only the marginal cost of production.

The difference between domestic and international costs has become kno-wn as “cost of international trade” and appeared explicitly in international nego-tiations, when the ministerial meeting of the World Trade Organization (WTO) in Bali, Indonesia, in December 2013, which led to the approval of the “Trade Fa-cilitation Agreement” (TFA). TFA aims to increase flexibility in the processing of border operations, reducing customs costs and promoting the competitiveness of companies and countries. An analysis made by Wilson, Mann and Otsuki (2003) in-dicated that global trade flows have a significant increase (US$ 377 billion) if four trade facilitation indicators (port infrastructure, regulatory environment, customs and environment, e-business) are improved.

However, in addition to border costs, those “behind the border” should also be considered, as they directly affect the relative costs of trade and the ability of countries to conquer new markets for their products.

This study therefore seeks to analyze the total costs of international trade in Brazil, in a time perspective and their integration in MERCOSUR. The values for the total bilateral trade costs are available on the World Bank website (WORLD BANK, 2016), calculated by ARTNET (2016). The same costs are also available for the sectors of agricultural and manufactured goods, allowing a comparison betwe-en them.

In general, these costs have decreased with the growth of global trade (ARVIS et al., 2013) and regional integration agreements (DUVAL; UTOKTHAM, 2011), but little is known about them in Brazil.

How have they evolved in trade with major partners in Brazil and in terms of tariff and non-tariff components? How are they affected by the geographical characteristics of the country and the political measures of trade facilitation? In the search for answers to these questions, this study provides, in section 2, the calculation methodology and a description of costs considered and the model that

(4)

relates geographic and political variables. Section 3 makes a comparison on the development of costs and shows the results obtained with the statistical model proposed, while section 4 presents the main conclusions of the study.

2. Methodology

The concept of total costs of bilateral international trade adopted in this stu-dy is the same as Arvis et al. (2013), which includes all the costs involved in the international trade of goods between two countries, unlike the costs for the same goods sold domestically. Once defined, the total bilateral trade costs can be divided into tariff and non-tariff costs. The non- tariff component of total bilateral costs is obtained by subtracting the total costs, the geometric average of the rates for each pair of trading partners. The values of total bilateral costs and non-tariff costs of trade are calculated ARTNET – Asia-Pacific Research and Training Network on Trade (2016) and available by the World Bank (2016). There are available data calculated for 178 countries since 1995, with the values expressed as a percentage.

The estimator of these total bilateral costs was derived by Novy (2011) from the model of gravity of Anderson and van Wincoop (2004), for domestic and inter-national trade between countries i and j, as shown in equation (1)

where Xij are nominal exports of country i to country j; Yi e Yj are the no-minal incomes of the same countries and YW is the world’s income; represents

the bilateral trade costs, which is a function of the distance between countries and existing barriers;

is the elasticity of substitution between products, while e are price indexes of countries i and j, respectively, known as multilateral resistance variables. can be interpreted as external multilateral resistance variable be-cause it represents an average of trade costs with all trading partners, while is an internal multilateral resistance variable.

The method proposed by Novy (2011) is based on the argument that chan-ges in bilateral barriers affect not only international trade but also domestic trade.

(5)

Therefore, in addition to international trade, domestic trade also depends on the barriers imposed, because a reduction of these barriers would divert part of the internal trade to the international market. For the formalization of this reasoning, equation (1) is solved for the multilateral resistance variables, considering the do-mestic and international trade of country i.

While equation (1) contains a variable of multilateral domestic resistance of a country by a variable of multilateral domestic resistance of another country, ( Pj), equation (2) provides the solution for Pi. The multiplication of the bidirec-tional gravity equation (1) by the same equation with oposite flows (Xji), provides a bidirectional equation with the variables of multilateral external and internal resistance of both countries.

Replacing the result of ( Pi) of the equation (2), and the same product of ( Pj), in equation (3) and rearranging, we obtain:

Since the costs of trade between countries i and j are, usually, asymmetric (

( and the costs of domestic trade are diffent ( ), take the geometric average of the bilateral trade and subtract the unit to obtain the expression for the total cost of the bilateral trade, as shown in equation (5).

Thus, represents a geometric mean of trade costs between countries i and j, and can be obtained from the data on international and domestic trade of each country and the elasticity of substitution between goods. The result of equation (5)

(2)

(3)

(4)

(6)

indicates how much higher the cost of international trade is in relation to the cost of domestic trade.

According to Arvis et al. (2013), when calculated in this way, trade costs are comprehensive, in the sense that they include observable costs such as tariffs and non-tariff measures, transportation costs, measures behind the borders associated with the logistics performance and services facilitation and, non observable, such as barriers related to institutional differences, in procedures, in culture, language and currency.

To find the non-tariff total costs of trade between countries i and j, one should subtract the geometric mean of the tariffs charged by the two countries (tariff i . tariff j)1/2, from the total costs.

The values found for the non-tariff costs in trade between Brazil and its MERCOSUR partners and trade with the other countries belonging to the selected economic blocs are then compared over the period of 1995-2013. Comparing the costs of trade among member countries of the blocs allows you to check whether they have been effective in reducing trade barriers among themselves, which is a basic goal of any integration process. The annual arithmetic mean of the costs of the countries belonging to each block is used, compared to Brazil and between each bloc.

To analyze the effect of some internal measures on non-tariff costs of the Brazilian market, we adopt the same procedure as Duval and Utoktham (2011), who related these costs with some geographic (distance, common border) and po-licy variables (quality logistics, services, the business environment, besides a favo-rable exchange rate), using the following function:

where, CNTitj are the non-tariff costs in trade of products in the manufacture and agricultural sectors, between Brazil (i ) and its trading partner ( j) in year t; Distij is the distance between Brazil and its trading partner; FCij is a dummy va-riable that assumes the value of 1 if Brazil has a common border with the trading partner, and 0 if not; ISCCijt is a geometric mean of the connectivity indexes of the value chains of Brazil and its trading partner; ITijt is the geometric mean of inter-net use in Brazil and in the partner country; CRijt is a geometric mean of the avai-lability of credit to the private sector, as a percentage of the PIB of each country;

(7)

Mij is a dummy variable that assumes the value of 1 if the partner is a member of MERCOSUR and 0 on the contrary; and, At is a dummy variable for each year of the series (fixed effect).

The annual total non-tariff costs, defined above and expressed as a percen-tage, are available on the ARTNET (2016) website. The values found for the non--tariff costs in trade between Brazil and its MERCOSUR partners and with the countries belonging to the other selected economic blocs, are those compared over the period 1995-2013. It uses the annual arithmetic mean of the trade costs of the manufacturing and agricultural products from the countries belonging to each of the selected blocs in comparison to Brazil and from the blocs among themselves. The separation of the traded products followed the United Nations classification (International Standard Industrial Classification - ISIC Rev. 3) (UNITED NA-TIONS STATISTICAL DIVISION, 2016), with the products of the sectors A and B classified as agricultural and those of sector D, as manufactured products.

The blocs and countries selected were: MERCOSUR1 (Argentina, Brazil,

Pa-raguay and Uruguay); Andean Pact2 (Bolivia, Colombia, Peru, Ecuador and

Vene-zuela), currently known as, Andean Community of Nations; NAFTA (Canada, Uni-ted States and Mexico); European Union (26 countries)5 ; ASEAN + 3 (Indonesia,

Malaysia, Philippines, Thailand, Vietnam, Singapore + China, Japan and South Korea)6 . Brazil’s trade with member countries of those blocks accounted for over

80% of the total, over the whole period analyzed.

The period from 1995 to 2013 was divided into three sub-periods with a range of six years (1995-2000; 2001-2006; 2007-2012) plus the year of 2013. The first period (1995-2000) covers the early years of the Real Plan, while the second (2001-2006), the years known as “commodity cycle”. The third sub-period was the most sway in international trade due to the international financial crisis.

The values of the distances were obtained from the CEPII ‘s website (2016) and indicate the distances in kilometers between the capital cities of each selected country.

The International Supply Chain Connectivity Index (ISCC) of each country was obtained from the ARTNET (2016) database. The Economic and Social Com-mission for Asia and the Pacific (ESCAP, 2013) defines a international supply chain as the transfer of goods, from a production unit in one country to a wa-rehouse or distribution center in another country. According to them, considering that 80% of international trade is carried out through seaports, the international

(8)

supply chains performance of a country depends not only on the effectiveness of the movement of goods from production sites to ports (or from ports to the local production or distribution centers), but also on how well that port is connected to other countries. Thus, the ISCC is calculated to capture the overall performance of facilitation of a country’s trade in a supply chain, based on foreign trade indicators of the World Bank (Trade Accross Border) that considers the number of documents, time and costs engaged in imports and exports and, in liner shipping indicators of UNCTAD (Liner Shipping Connectivity Index)5, which considers five components

of shipping.

The IT variable, which refers to the number of internet users per 100 inhabi-tants, and CR variabler, which refers to domestic credit to the private sector as a percentage of the PIB, were obtained from the website of the World Bank (2016).

3. Results and discussion

Before presenting the relation between the performance indicators and the non-tariff costs, an analysis of the evolution of the costs of Brazilian trade with the other countries in MERCOSUR and of these countries with the other selected tra-ding blocs, which involve Brazil’s main commercial partners, was conducted. It is important to notice that the values of the non-tariff costs are calculated as the total bilateral trade costs between each pair of countries minus the geometric mean of the tariffs they charge, that is to say, it includes all costs whether they are obser-vable or not, in excess to trade the same products domestically, minus the tariff.

3.1 Evolution of commerce and bilateral costs

Table 1 shows the average value of exports and imports from Brazil with the members of the selected trading blocs and periods. Imports ans exports are cres-cent in every case. Brazil only showed a deficit with MERCOSUR in the 1995-2000 period. For the year of 2013, the deficits with NAFTA and with the European Union must be assessed carefully, since they were the latest data available in the series, and may not yet reflect the total trade for that year. Exports to MERCO-SUR, NAFTA and the European Union tripled, while to the countries of the Ande-an Community of Nations, increased five-fold Ande-and, for the members of ASEAN +

(9)

3, they were multiplied by ten. There is no doubt of the relevance of China in this case. In terms of imports, the growth was smaller between the first two periods of the series, but between 2001-2006 and 2007-2012 it showed a significant increase, more than doubling. Once again, the growth in China’s imports explains the great leap of imports of ASEAN + 3.

Table 1 – Average values of Brazilian trade in selected periods, US$ Millions

Blocs 1995-2000 2001-2006 2007-2012 2013

Exp Imp Exp Imp Exp Imp Exp Imp

MERCO-SUR 7.366 8.277 8.519 6.782 21.125 15.794 24.199 19.269 Andean Pact 1.723 1.251 4.146 1.747 10.357 5.193 11.065 8.494

NAFTA 12.405 15.344 26.109 13.763 34.901 32.773 34.360 45.076 E.U. 15.491 15.780 25.241 16.017 47.889 37.225 45.070 50.643 ASEAN +3 6.614 5.877 13.768 9.507 54.082 39.754 75.345 58.193 Source: World Integrated Trade Solution Database (2014).

The evolution of the average tariffs charged in the bilateral trade of Brazil and the selected trading partners can be seen in Figure 1. It is important to highlight that in Brasil’s case, the presented values are a geometric mean between the tariffs charged by Brazil and by its trading partners, over all goods traded between them. Tariffs for the other countries are an arithmetic mean of the tariffs charged on tra-de between each pair of countries, calculated in the same way as in the Brazilian case.

It is possible to observe that tariffs are higher in the Brazilian case than that of the other countries throughout the entire period, but that both present a decre-asing trend. The evolution of the values is rather similar, with the most significant fall in the Brazilian tariffs occourring in 2003. They range from an average of 10% in 1996 to 6% in 2012, in Brazil, and from 9% in 1996 to 5% in 2012, to the other countries. These values are relatively small and reinforce the argument that the tariff measures, in fact, are loosing importance as trade restrictive measure.

(10)

Figure 1 – Evolution of tariffs in Brazil and in other countries, 1995-2012 Source: World Bank (2016).

Figures 2 and 3 show the evolution of tariffs in agriculture and manufactu-ring sectors, respectively, for selected trading blocs. What is clear from those figu-res is that the decrease in tariffs of manufactured products has been larger than those of agricultural products and that, in general, agricultural products present higher tariffs.

Certainly, the averages conceal peculiar characteristics of the products of each region or trading bloc, but it seems clear that the tariffs charged on imports of agricultural products are higher in ASEAN + 3 countries than in the ones from the European Union. In the case of the manufactured products, it is in MERCOSUR where the highest tariffs are charged and in the Andean Community of Nations where occurred the greatest decrease in the analyzed period. The lowest average tariffs are those in the European Union, whose recent values are around 3%.

(11)

Source: World Bank (2016).

Figure 3 – Evolution of average tariffs over manufactured products, 1995-2012 Source: World Bank (2016).

Table 2 was created in a form of a matrix since the costs are symmetrical for each pair of countries. Thus, the values above the main diagonal are the costs cal-culated for manufactured products and those below it are the costs for agricultural products.

The values presented refer to an average of costs of all traded products with each trading partner expressed as a percentage of the value of these products, or an “tariff equivalent”. In the first line of Table 2, the value 55.80 indicates that

(12)

the trade of manufactured goods between Brazil and Argentina had an additional average cost, or a tariff equivalent to 55.80% in the period of 1995-2000, when compared to trade of the same products internally. The value of 77.72 of the first column has the same interpretation for agricultural products.

Looking specifically at non-tariff costs on trade of manufactured products it is possible to observe that the smaller values are those of trade with Argentina, and the largest , those of trade with Paraguay. The non-tariff costs, which were de-creasing to most of the countries, suffered great changes over time on the trade of Brazil with its MERCOSUR partners. They presented a decrease between the first two periods in trade with Argentina, grew in the following period (2007-2012), and decreased again in 2013. In trade with Paraguay and Uruguay, the average non--tariff costs grew systematically during the three periods, decreasing in the year of 2013. When compared the initial and the final values of the series it is possible to verify a fall of 21 and 29%, in the trade costs between Brazil and Argentina, and Brazil and Paraguay, respectively, while trade costs between Brazil and Uruguay had a growth of 2%.

Table 2 – Non-tariff costs of intra-MERCOSUR trade, for agricultural and manufactured products in selected periods, percentage values

Country/Period Argentina Brazil Paraguay Uruguay Argentina 1995-2000 - 55,80 88,53 63,85 2001-2006 - 54,34 82,15 68,34 2007-2012 - 58,64 90,86 74,61 2013 - 45,92 84,55 81,05 Brazil 1995-2000 77,72 - 78,29 64,92 2001-2006 85,64 - 82,89 75,45 2007-2012 100,36 - 91,14 83,03 2013 105,41 - 60,46 66,36 Paraguay 1995-2000 98,70 91,65 - 84,38 2001-2006 112,61 96,47 - 62,50 2007-2012 105,60 96,05 - 95,18 2013 126,96 97,15 - 89,75 Uruguay

(13)

1995-2000 116,41 94,44 129,69

-2001-2006 134,07 127,56 100,84

-2007-2012 155,32 122,58 100,95

-2013 176,82 106,42 99,55

-Source: calculations of the authors based in the data from the World Bank (2016).

The values of non-tariff costs for agricultural products are higher than those for manufactured products. This was expected due to their perishability and to the higher regulatory rigor regarding sanitary and phitossanitary measures in the sector. Another fact that must be noted is the growth of bilateral non-tariff costs of agricultural products with Brazil’s trade partners from MERCOSUR. With the lowest-cost partner (Paraguay), there was a 6% increase, while the costs of trade with Uruguay and Argentina had increases around 13% and 35% respectively du-ring the period. In the Argentinean case, this increase of non-tariff costs is very significant. In Argentina’s case, this increase of non-tariff costs is very significant. According to Braziliam Ministry of Agriculture (BRASIL, 2012), Argentina has been adopting restrictive measures and directly hindering the entry of Brazilian products in its territory.

The costs vary greatly among all countries, and specifically in the year of 2013, when they vary 97.15% between Brazil and Paraguay and 176% between Argentina and Uruguay. However, these values are just for one year (2013), while for other periods they are averages for six-year sets.

Table 3 shows the non-tariff costs of inter-MERCOSUR trade with countries from other Regional Trade Agreements (RTAs). In addition to that, it highlights the average non-tariff costs of Brazilian trade with its MERCOSUR and selected RTAs. In the same fashion of Table 2, the data are presented in the shape of a ma-trix, with the values above the main diagonal indicating costs for manufactured products, and those below the main diagonal, the costs for commercializing agri-cultural products. Brazil’s trade with countries that are members of the selected regional free trade agreements make up more than 81% of the country’s total trade in goods during the studied period.

(14)

Table 3 – Non-tariff costs of inter-MERCOSUR trade, for agricultural and manufactured products, in selected periods, percentage value

Country/ BRAZIL MERCOSUR ANDEAN NAFTA EUROPEAN ASEAN

Period PACT UNION + 3

Brazil 1995-2000 - 66,34 110,44 97,60 165,45 135,55 2001-2006 - 70,89 111,81 91,45 156,04 135,86 2007-2012 - 77,60 125,21 90,39 140,57 118,81 2013 - 57,58 112,08 79,56 119,48 114,00 MERCOSUR 1995-2000 87,94 - 141,97 140,75 202,88 186,81 2001-2006 103,22 - 144,30 131,90 217,25 188,68 2007-2012 106,33 - 149,57 126,55 206,90 167,71 2013 103,00 - 145,31 114,54 166,48 170,32 A N D E A N PACT 1995-2000 221,07 218,52 - 125,78 246,93 241,70 2001-2006 222,07 282,39 - 126,15 263,77 243,18 2007-2012 212,74 266,84 - 120,51 247,53 229,97 2013 177,42 215,36 - 122,12 215,07 227,90 NAFTA 1995-2000 139,76 226,31 170,80 - 150,50 106,58 2001-2006 157,41 249,50 176,79 - 146,64 110,29 2007-2012 149,91 226,18 173,49 - 135,98 107,80 2013 166,53 231,66 234,71 - 143,24 137,46 E.U. 1995-2000 203,49 245,16 261,26 229,93 - 159,51 2001-2006 248,14 281,49 312,06 251,89 - 157,66 2007-2012 259,05 271,20 286,23 257,88 - 145,94 2013 247,81 262,06 274,04 322,94 - 137,82 ASEAN + 3 1995-2000 180,68 256,58 347,34 168,51 278,30 -2001-2006 165,44 256,78 356,70 167,70 316,14 -2007-2012 149,88 240,84 342,93 160,85 312,90 -2013 136,95 209,44 288,84 233,67 286,24

(15)

It is possible to observe that, as expected, intra-MERCOSUR costs are lower than inter-MERCOSUR costs due to the geographic proximity between members of the bloc and the consequent cultural and linguistic similarities. Besides, it is also expected that countries that are members of an regional trade agreement, due to the own agreement’s nature, reduce trade barriers among themselves. Thus, the average non-tariff costs of trade between Brazil and the members of MERCOSUR are lower than those with countries in other trade blocs, both for manufactured and agricultural products.

Once more, the average trade costs of manufactured products are lower than those of agricultural products. The non-tariff trade costs of agricultural and manu-factured goods of Brazil and its MERCOSUR partners are lower than the costs of trading with other Regional Trade Agreements. However, the Brazilian bilateral costs with MERCOSUR increased during the three periods considered, decreasing only in 2013, while the costs of trading with the countries of other RTAs decreased during the whole series. The exception was trade with countries from the Andean Community of Nations (Peru, Bolivia, Colombia, Ecuador and Venezuela), which presented the same pattern of trade costs with MERCOSUR countries. In fact, the average trade costs with countries in the Andean Pact are higher than the same average costs of the NAFTA countries (Canada, United States and Mexico). Despite being geographically close to the MERCOSUR, the problems of logistics and infrastructure raise the costs of trading with countries in the Andean Pact. Franzen and Silva (2016) had already observed that the Brazilian bilateral trade with developed countries displayed lower costs due to conveniences caused of the infrastructure and technological advances in those countries in relation to Brazil. It is important to highlight the lower non-tariff costs between RTAs consisting mainly of countries more developed (NAFTA; European Union; and ASEAN + 3), especially for the trade of manufactured goods. In addition, in the case of ASEAN + 3 group, the emphasis in the reduction of costs and policies aimed at exports justify the lower values and the constant decrease of costs.

In the case of trade in agricultural goods, the average bilateral costs present great differences between RTAs and a smaller decrease over time. The explanation can be at the different compositions of exports among them, but, like in the intra--MERCOSUR trade case, reflects the possibility of adopting enabling trade policies for agricultural products.

(16)

3.2 The relation between non-tariff costs and some

performance indicators

The econometric model proposed for the evaluation of the relative importance of several variables in the explanation of non-tariff costs in Brazilian international trade was estimated by ordinary least squares (OLS) with stacked observations (pooled). A panel of Brazilian bilateral trade costs was assembled for manufactured products and another one for agricultural products, with the 47 countries members of the selected blocs, during 6 years (2007-2012). The 2007-2012 period was chosen due to the availability of data for the explanatory variables. Given the inexistence of some trade flows during the selected period, the regression was estimated throu-gh the Poisson Pseudo Maximum Likelihood method (PPML) in order to verify how robust the estimates are. The results obtained can be found in Table 4 and were very similar in both estimation methods. The dummy variable for common border was removed from the proposed model because it displayed a high negative corre-lation to the dummy for MERCOSUR countries. All equations were statistically significant, with R² varying between 29 and 50%. In most cases, the estimated coe-fficients were significant, except for the credit variable in the manufactured goods equation and with the expected signs, except for those of the variable measuring the internet users.. The analysis of the coefficients estimated with OLS shows that the manufactured products’ non-tariff costs are positively influenced by distances between countries, with a higher effect for agricultural products. The non-tariff cost between MERCOSUR members is 48.1% lower than the same costs with the other countries. In the case of agricultural products, this difference is larger, and achieve 77.4%. These values are opposite to the ones encountered by Duval and Feyler (2016) in the analysis performed for members of the ASEAN RTA, reflecting the productive characteristics of each region.

The ISCC variable, which measures the performance of a country’s supply chains, presented the highest coefficients, showing its importance in the explana-tion of non-tariff costs. These coefficients encompass trade facilitaexplana-tion variables (number of documents, time and costs involved in imports and exports) and mariti-me transport indicators and, thus, have a large effect in the reduction of non-tariff costs.

(17)

Table 4 – Results encountered for the equation of non-tariff costs

Variables Manufactured Goods Agricultural Goods

MQO PPML MQO PPML Distance .115*** .128*** .187*** .207*** (.041) (.038) (.040) (.039) ISCC -.924*** -.892*** -1.331*** -1.344*** (.164) (.155) (.191) (.181) ITC .196*** .221*** .989*** 1.114*** (.059) (.062) (.077) (.089) Credit -.005ns -.002ns -.561*** -.579*** (.058) (.069) (.064) (.057) Dummy Mercosur -.481***(.067) -.466***(.064) -.774***(.071) -.828***(.073) Constant 6.250*** 5.921*** 6.732*** 6.106*** (.307) (.308) (.354) (.382) R2 .339 .286 .481 .498 Observations 246 246 247 247

*** e ns indicates significance at the 1% level and absence of statistical significance, respectively. Source: author.

The ITC variable presented positive and significant coefficients, indicating that the increase in the number of internet users would elevate non-tariff costs. The opposite sign to what was expected suggests that this variable may not be the most adequate to be used as a technology indicator in the trade field.

In the case of the credit variable, the significance for the coefficients of agri-cultural products indicate that this sector is more dependent of credit than the manufactured goods sector.

For a comparative analysis of the effects of each explanatory variable, the contribution of each one of them in the variation of total bilateral non-tariff costs was calculated using the following formula:

δ

k =

in which is the coefficient estimated for the Xk variable in the regression equation. The results using coefficients estimated by OLS are presented in Table 5.

(18)

Table 5 – Contribution of regression variables to the variation of non-tariff costs, percentage values Variables Manufactured Goods Agricultural Goods

Distance 4,94 3,81 ISCC 9,17 6,13 ITC 0,74 11, 37 Credit 0,00 11,79 MERCOSUR Dummy 14,98 14,22 Total 29,83 47,29

Source: research data.

It is important to highlight that a large part of the total variation of non-tariff costs is not explained by any of the equation’s variables, especially in the manufac-tured goods case. The distance variable has a larger effect over the costs of manu-factured products. The trade facilitation indicator (ISCC) has a significant effect and in the case of manufactured products, it contributes alone with more than 9% of the variation in total non-tariff costs. The credit variable is also of great impor-tance in the reduction of non-tariff costs of agricultural products. However, the element of interest is the variable that indicates the participation in MERCOSUR, which explains about 15% of the total variation of non-tariff costs for the sectors studied. In addition, it reinforces the argument that a stronger regional integra-tion would bring benefits regarding the costs of trade in general.

4. Conclusions

In this study, an analysis of the evolution of non-tariff costs of international trade between Brazil, its MERCOSUR partners and other Regional Trade Agree-ments that include the country’s main trade partners between the years of 1995 and 2013 was conducted.

A continuous decrease of tariffs during that period evidenced the importance of non-tariff measures in the formation of international trade costs, whose varia-tion between countries is very significant.

The non-tariff trade costs of agricultural and manufactured goods is lower among MERCOSUR countries than in countries of the other analyzed RTA. The trade costs for products in the agriculture sector were always higher than those of

(19)

the manufacture sector and crescent among MERCOSUR countries. Such results indicates that there was little effectiveness in improving the infrastructure and the commercial environment between the MERCOSUR countries and suggests that efforts in facilitating trade in this sector can be particularly productive.

The model estimated for evaluating the effect of some variables over non-tariff costs showed that the geographic distance variable between trade partners has little effect, but that trade facilitation measures such as improvements in trade procedures, infrastructure and logistics services have a great impact in cost re-duction. The credit variable, of domestic control, displayed a great impact in the reduction of trade costs, especially in the agriculture sector. However, the factor that contributed the most for non-tariff cost reduction was the participation of countries in the MERCOSUR, indicating that a priority should be given in the full implementation of that Agreement between members.

(20)

Os custos não tarifários do comércio internacional no Brasil

Resumo

Este estudo avalia a evolução dos custos não tarifários do comércio internacional do Brasil com o MERCOSUL e com outros quatro blocos econômicos cujos países perfazem mais de 80% do comércio do país. Os custos bilaterais não tarifários, para os setores agrícola e de manufaturados, foram obtidos pela subtração da média geométrica das tarifas cobradas por cada par de parceiros comerciais dos custos totais desses setores. Os resultados mostr-aram que, diferente dos demais blocos, em que ocorreu queda contínua nas tarifas e nos custos não tarifários, esses últimos foram crescentes no MERCOSUL. O fator que mais contribuiu para a redução dos custos não tarifários foi a participação dos países no MER-COSUL, indicando que a prioridade deveria ser dada na implementação plena do acordo entre os países membros.

Palavras-chave: Custos do comércio. Barreiras não tarifárias. Comércio bilateral. Acordos

regionais de comercio.

Los costos no arancelarios del comercio internacional en

Brasil

Resumen

Este estudio evalúa la evolución de los costos no arancelarios del comercio internacional de Brasil con el MERCOSUR y con otros cuatro bloques económicos cuyos países totalizan más del 80% del comercio del país. Los costos bilaterales no arancelarios, para los sectores agrícola y de manufacturas, fueron obtenidos por la sustracción de la media geométrica de las tarifas cobradas por cada par de socios comerciales de los costos totales de esos secto-res. Los resultados mostraron que, a diferencia de los demás bloques, donde ocurrió caída continua en las tarifas y en los costos no arancelarios, estos últimos fueron crecientes en el MERCOSUR. El factor que más contribuyó a la reducción de los costos no arancelarios fue la participación de los países en el MERCOSUR, indicando qué prioridad debería darse en la implementación plena del Acuerdo entre los países miembros.

Palabras clave: Costos del comercio. Barreras no arancelarias. Comercio bilateral.

Acuer-dos regionales de comercio.

(21)

Notes

1 Venezuela was not considered as a member of MERCOSUR by its recently accession (2012) to that block.

2 Venezuela remained as a member of Andean Pact, although that country has left the bloc in 2006.

3 Germany, Austria, Belgium, Bulgaria, Cyprus, Czech Republic, Denmark, Spain, Estonia, Slovakia, Slovenia, Finland, France, United Kingdom, Greece, Netherlands, Hungary, Ireland, Italy, Latvia, Lithuania, Luxembourg, Malta, Poland, Portugal, Romania, Sweden.

4 Brunei, Laos and Myanmar were not considered in the ASEAN block by lack of data

5 The Liner Shipping Connectivity Index (LSCI) is based on the following components: (1) Num-ber of ships; (2) Total capacity of containers; (3) NumNum-ber of port services; (4) The maximum size of ships; (5) Number of campanies involved in shipping containers from and to the country.

References

ANDERSON, James; VAN WINCOOP, Eric. Trade costs. Journal of Economic Literature, v. 42, n. 3, p. 691-751, 2004.

ARTNET – Asia Pacific Research and Training Network on Trade. Disponível em: http://artnet. unescap.org/. Acesso em: abr. 2016.

ARVIS, J. F. et al. Trade costs in the developing world: 1995-2010. Policy Research Working

Pa-per 6309, World Bank, 2013.

BRASIL. Ministério da Agricultura, Pecuária e Abastecimento. Intercâmbio Comercial do

Agro-negócio: Principais Mercados de Destino. Edição 2012. Brasília, 2012. 456 p.

CEPII – French Research Center in International Economics. Distance databases. Disponível em: http://www.cepii.fr/anglaisgraph/bdd/distances.htm. Acesso em: mar. 2016.

DAUMAL, M.; ZIGNAGO, S. Measure and determinants of border effects of Brazilian states.

Papers in Regional Science, v. 89, p. 735-758, 2010.

DUVAL, Yann; UTOKTHAM, Chorthip. Trade facilitation in Asia and the Pacific: which policies and measures affect trade costs the most?. Asia- Pacific Research and Training Network on

Tra-de (ARTNet) Working Paper, n. 94, January, 2011. Disponível em: http://www. unescap.org/tid/

artnet/pub/wp9411.pdf. Acesso em: mar. 2016.

DUVAL, Yann; FEYLER, Emilie. Intra- and extraregional trade costs of ASEAN Economies: Im-plications for Asian Regional Integration. In: ASEAN Economic Community: A model for Asia--wide regional integration. Bruno Jetin and Mia Mikic Editors, p. 153-172. 2016.

ESCAP. International Supply Chain Connectivity (ISCC) Database: Explanatory Note for Users. 2013. Disponível em: http://artnet.unescap.org/db/ESCAP-ISCC-usernote.pdf. Acesso em: 15 maio 2016.

(22)

FRANZEN, T. E.; SILVA, O. M. Os custos totais do comércio bilateral brasileiro: Determinantes e evolução recente. Revista Vision Contable, v. 7, n. 14, 2016. No Prelo.

LEUSIN JR., S.; AZEVEDO, A. F. Z. O efeito fronteira das regiões brasileiras: uma aplicaçãoo do modelo gravitacional. Revista de Economia Comtemporânea, v. 13, n. 2, p. 229-258, 2009. MCCALLUM, John. National borders matter: Canada–US regional trade patterns. American

Economic Review, v. 85, n. 3, p. 615-623, 1995.

NOVY, D. Gravitty Redux: Measuring international trade costs with panel data. Economic

In-quiry, v. 51, n. 1, p. 101-121, 2011.

POMFRET, Richard; Patricia Sourdin. Trade facilitation and the measurement of trade costs.

Journal of International Commerce, Economics and Policy, v. 1, n. 1, p. 145-163, 2010.

SILVA, O. M.; ALMEIDA, F. M.; OLIVEIRA, B. M. Comércio internacional x intranacional no Brasil: medindo o efeito fronteira. Nova Economia, v. 17, p. 427-439, 2007.

UNITED NATIONS STATISTICAL DIVISION. International Standard Industrial

Classifica-tion. ISIC - Rev 3. Disponível em: http://www.un.org/depth/unsd. Acesso em: 05 jan. 2016.

WILSON, John; MANN, Catherine; OTSUKI, Tsunehiro. Trade facilitation and economic de-velopment: a new approach to quantifying the impact. World Bank Economic Review, v. 17, p. 367-389, 2003.

WORLD BANK. Indicators. 2016. Disponível em: http://www.worldbank.org. Acesso: 13 out. 2016.

WORLD INTEGRATED TRADE SOLUTION DATABASE. 2014. Disponível em: tp://wits.worl-dbank.org/wits. Acesso em: 01 ago. 2014.

Imagem

Table 1 – Average values of Brazilian trade in selected periods, US$ Millions
Figure 1 – Evolution of tariffs in Brazil and in other countries, 1995-2012   Source: World Bank (2016).
Figure 3 – Evolution of average tariffs over manufactured products, 1995-2012 Source: World Bank (2016).
Table 2 – Non-tariff costs of intra-MERCOSUR trade, for agricultural and manufactured products in  selected periods, percentage values
+5

Referências

Documentos relacionados

São apresentados os resultados referentes ao uso dos diferentes métodos de previsão apresentados a valores de diferentes indicadores económicos e financeiros, assim como resultados

The obtained model allows estimation of the experimental outputs (biomass, glucose, acetate and plasmid) based on the bioreactor starting conditions and the following on-line

Apresentação de um modelo para aplicação da ferramenta Orçamento Base Zero – OBZ utilizado no planejamento e gestão de custos de uma.. cimenteira de

The probability of attending school four our group of interest in this region increased by 6.5 percentage points after the expansion of the Bolsa Família program in 2007 and

No tratamento da dermatite endógena induzida pela ingestão de níquel, a maioria dos autores reco- menda o cumprimento de uma dieta restritiva, em alimentos contendo um alto teor

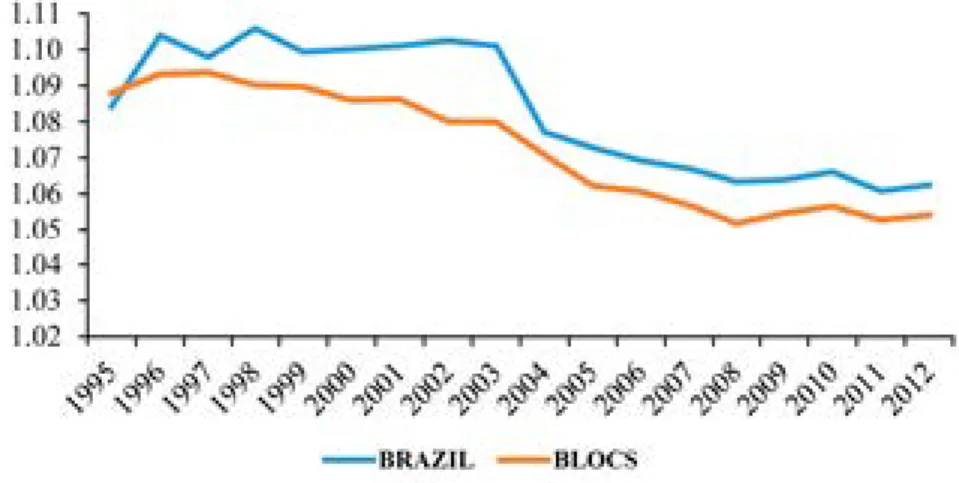
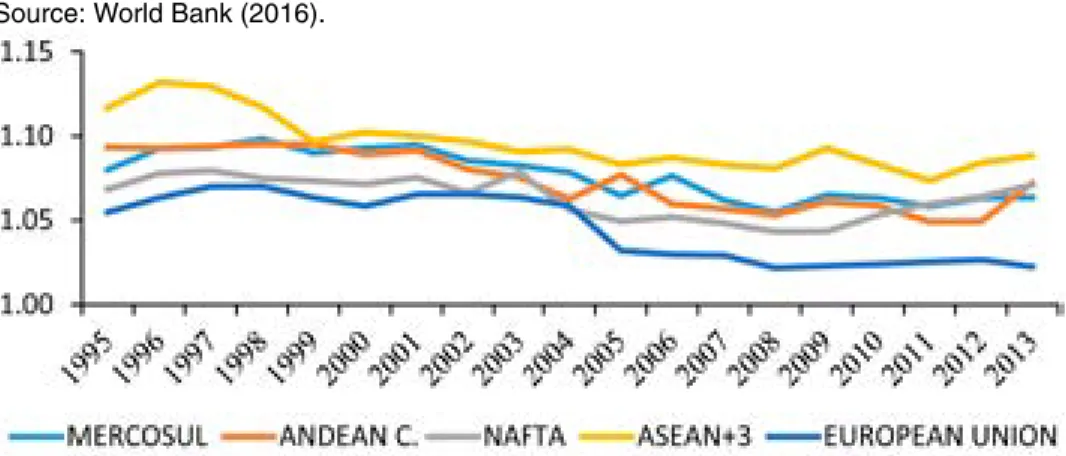
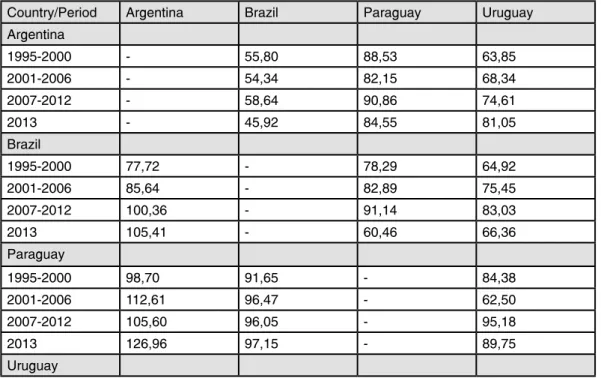
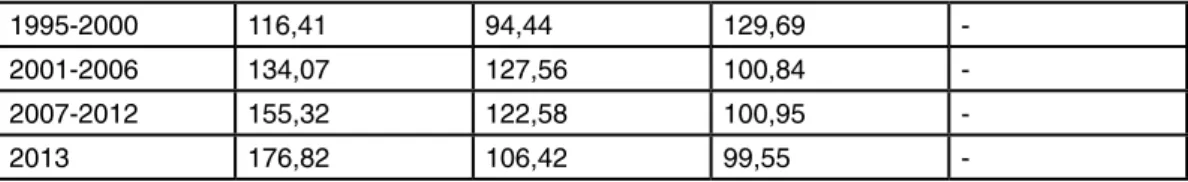
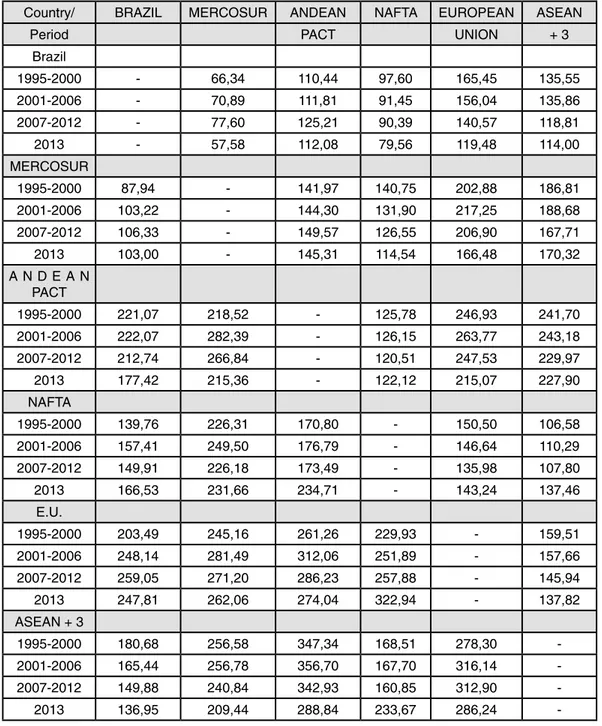
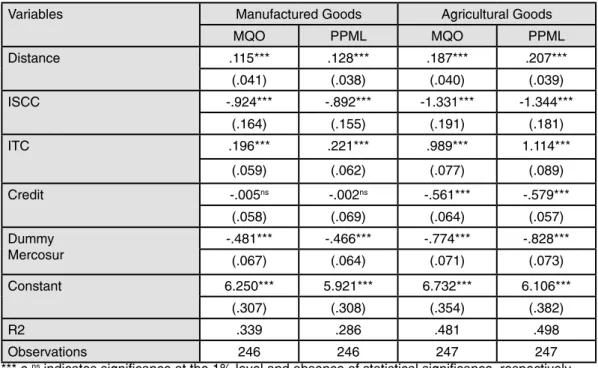
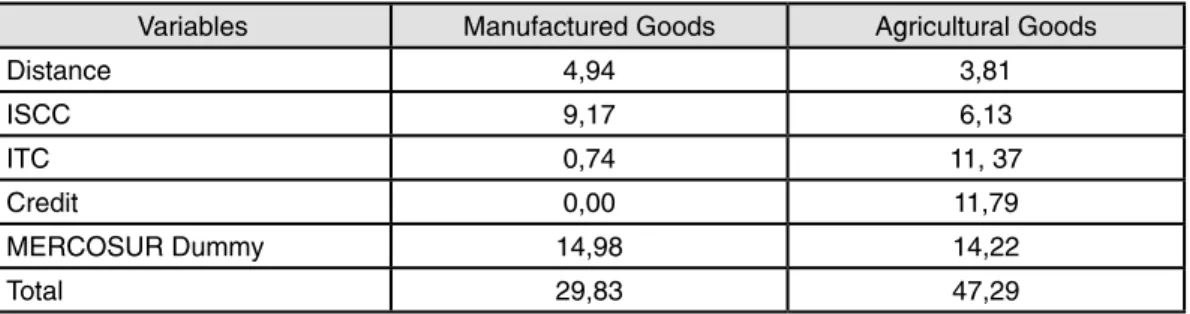
the impact of international trade costs reduction on the internal economic geography.. of the countries makes the role of empirical evaluation of this topic

didático e resolva as ​listas de exercícios (disponíveis no ​Classroom​) referentes às obras de Carlos Drummond de Andrade, João Guimarães Rosa, Machado de Assis,

Ousasse apontar algumas hipóteses para a solução desse problema público a partir do exposto dos autores usados como base para fundamentação teórica, da análise dos dados