Published online 2019 September 24. Research Article
Effect of Hemodynamic Changes in Plasma Propofol Concentrations
Associated with Knee-Chest Position in Spinal Surgery: A Prospective
Study
Daniela Chalo
1, 2, *, Sara Pedrosa
2, Pedro Amorim
3, Aura Silva
4, Paula Guedes de Pinho
4, Rui
Correia
5, Sonia Gouveia
6, 7and Consuelo Sancho
81Institute of Neurosciences of Castilla y Leon, INCyL, IBSAL, University of Salamanca, Salamanca, Spain 2Anesthesiology Department, Centro Hospitalar do Baixo Vouga, Aveiro, Portugal
3Anesthesiology Department, Centro Hospitalar do Porto, Porto, Portugal
4UCIBIO-REQUIMTE, Toxicology Laboratory, Biological Sciences Department, Faculty of Pharmacy of the University of Porto, Porto, Portugal 5Anesthesiology Department, Anesthesiology Centre for Investigation, Centro Hospitalar do Porto, Porto, Portugal
6Institute of Electronics and Informatics Engineering of Aveiro (IEETA), University of Aveiro, Aveiro, Portugal 7Center for R&D in Mathematics and Applications (CIDMA), University of Aveiro, Aveiro, Portugal 8Physiology and Pharmacology Department, INCyL, IBSAL, University of Salamanca, Salamanca, Spain
*Corresponding author: Physiology and Pharmacology Department, Faculty of Medicine, IBSAL, Calle Alfonso X el Sabio, University of Salamanca, Salamanca, Spain. Email: [email protected]
Received 2019 August 01; Accepted 2019 September 07.
Abstract
Background: Anesthesia induction and maintenance with propofol can be guided by target-controlled infusion (TCI) systems using pharmacokinetic (Pk) models. Physiological variables, such as changes in cardiac output (CO), can influence propofol pharmacoki-netics. Knee-chest (KC) surgical positioning can result in CO changes.
Objectives: This study aimed to evaluate the relationship between propofol plasma concentration prediction and CO changes after induction and KC positioning.
Methods: This two-phase prospective cohort study included 20 patients scheduled for spinal surgery. Two different TCI anesthesia protocols were administered after induction. In phase I (n = 9), the loss of consciousness (LOC) concentration was set as the propofol target concentration and CO changes following induction and KC positioning were quantified. In phase II (n = 11), based on data from phase I, two reductions in the propofol target concentration on the pump were applied after LOC and before KC positioning. Propofol plasma concentrations were measured at different moments in both phases: after induction and after KC positioning. Results: Schnider Pk model showed a good performance in predicting propofol concentration after induction; however, after KC positioning, when a significant drop in CO occurred, the measured propofol concentrations were markedly underestimated. In-tended reductions in the propofol target concentration did not attenuate HD changes. In the KC position, there was no correlation between the propofol concentration estimated by the Pk model and the measured concentration in plasma, as the latter was much higher (P = 0.013) while CO and BIS decreased significantly (P < 0.001 and P = 0.004, respectively).
Conclusions: Our study showed that the measured propofol plasma concentrations during the KC position were significantly un-derestimated by the Schnider Pk model and were associated with significant CO decrease. When placing patients in the KC position, anesthesiologists must be aware of pharmacokinetic changes and, in addition to standard monitoring, the use of depth of anesthe-sia and cardiac output monitors may be considered in high-risk patients.
Keywords:Hemodynamics, Knee-Chest Position, Propofol Pharmacokinetics, Anesthesia, Infusion Pumps
1. Background
Anesthesia induction and maintenance with propo-fol can be guided by target-controlled infusion (TCI) sys-tems that incorporate a pharmacokinetic (Pk) model into a computer-controlled pump, allowing for intravenous anesthetics titration and targeting plasma and effect-site drug concentrations (1,2). However, propofol
pharmacoki-netics can be influenced by changes in physiological vari-ables, such as cardiac output (CO), as propofol is a high-clearance drug. In addition, an increase in the propofol plasma concentration could also result in hemodynamic (HD) changes (3-7). These HD variations can modify the TCI modeling ability to predict propofol concentrations (8) such that up to a 60% precision error can occur as the
est bias after induction in the early maintenance phase (9). Patients’ positioning in the knee-chest (KC) position (Figure 1) following anesthesia induction further reduces venous return and CO (10,11). Physiological changes and complications associated with surgical positions, such as the prone and KC positions, have been studied extensively (12,13).
Researchers previously observed that patients in the prone position required less propofol than those in the supine position. In the present study, it was hypothe-sized that predicted propofol effect-site (Ce) and predicted plasma concentrations (Cp) would not be accurate when these HD changes occur, especially after KC positioning (4,
5,14). It was also hypothesized that applying two different TCI anesthesia protocol reductions in propofol infusion, one performed after induction and the other one before positioning, would reduce the prediction error and atten-uate the CO changes.
2. Objectives
The aim of this study was to quantify the variations in propofol plasma concentrations (Cm), both after induc-tion and after KC posiinduc-tioning, and correlate them with Cp by the Schnider Pk model. CO was continuously measured with a minimally invasive CO monitor, LiDCO rapid®(15-17) (LiDCO Ltd., Cambridge, UK).
3. Methods
After obtaining the REB approval and written informed consent, we recruited consecutive neurosurgical patients scheduled for lumbar spinal surgery in the KC position. A two-phase prospective observational study was conducted.
Figure 1. KC surgical position, a variant from the prone position
In the first set of patients (phase I), propofol plasma con-centrations were measured and compared with concentra-tions predicted by the Schnider Pk model and the changes in CO following induction and KC positioning were quan-tified. In the second set of patients (phase II), based on the data from the first set of patients, two propofol target concentration reductions were planned immediately after anesthesia induction and before positioning.
Propofol plasma concentrations were also measured and compared with predicted and the changes in CO fol-lowing induction and KC positioning were also quantified, as done in phase I. The exclusion criteria included patients with severe ischemic heart disease, congestive heart fail-ure, atrial fibrillation or flutter, body mass index (BMI) > 35 kg.m-2, dementia, history of drug abuse or addiction, and preoperative midazolam. A careful physical examination was performed on each patient to exclude potentially diffi-cult airway and ischemic peripheral arterial disease.
3.1. Anesthesia Protocol
A crystalloid intravenous infusion at 400 mL.h-1 was initiated once patients arrived in the operating room, which continued until the end of anesthesia induction and maintained at 200 mL.h-1throughout the surgery. Pa-tients received American Society of Anesthesiologists (ASA) standard monitoring, including depth of anesthesia mon-itoring with bispectral indexTM(BISTMbrain monitoring, Medtronic, USA) and neuromuscular block monitoring with the train of four stimulations on the right hand. Be-fore induction, a left radial artery catheter was placed with local anesthesia to measure invasive blood pressure and LiDCO rapid®was connected to collect CO and other hemo-dynamic parameters every second. This device used the same algorithm as the LIDCO plus®system, but it required neither lithium dilution nor calibration, as it used nomo-grams based on patients biometric parameters to estimate cardiac output and stroke volume. In a separate com-puter, RugLoopII©software (DEMED website, Temse, Bel-gium) was used to drive remifentanil and propofol pumps (AlarisTMAsena, BD, UK) and to collect data every five sec-onds while connected to the patient monitor (Aisys®, GE Healthcare, USA). At this moment, the first blood sam-ple, called “Baseline”, which was free of drugs, was col-lected and all pharmacological and HD parameters were recorded. Anesthesia induction commenced with remifen-tanil (20µg.mL-1) by the TCI mode to achieve a predicted effect-site target concentration (Ce) of 2.5 ng.mL-1(Minto pharmacokinetic model). Propofol (1%) was then started at 200 mL.h-1in the TCI view until the loss of consciousness (LOC). The LOC was considered when the patient failed to open the eyes following name-calling and tapping on the forehead. At the moment of LOC, propofol predicted effect-site concentration (Ce) was noted from RugLoopII©
soft-ware. The propofol protocol in patients from P1 and P2 was different, as explained in detail in the following.
3.2. Experimental Protocol 3.2.1. Phase I (P1)
After LOC, the propofol concentration was switched from the TCI view to the TCI mode with Schnider Pk model at a target concentration equal to the Ce at LOC. Tracheal intubation was accomplished following neuromuscular blocking drug administration (rocuronium 0.6 mg.kg-1) and patients’ lungs were mechanically ventilated with O2 and air mixture to achieve SpO2of > 98%, tidal volume of 8 mL.kg-1, and the respiratory rate adjusted to normocapnia. Remifentanil Ce was reduced to 1 ng.mL-1until surgical in-cision. Anesthesia maintenance was guided by BISTM (40-60) and HD parameters by the anesthesiologist. The sec-ond blood sample was collected 10 min after LOC and then patients were positioned in the KC position carefully and using a ProneView®platform for the head. The third blood sample was collected and parameters were registered 10 minutes after performing the KC position before incision (Figure 2). At this point, phase I of the study was completed.
3.2.2. Phase II (P2)
After LOC, the propofol concentration was switched from the TCI view to the TCI mode at a Ce target lower than Ce at LOC, calculated using a formula described in detail in supplementary file Appendix 1, which relates the Ce of LOC with the Ce that results in maintaining BIS between 40 and 60.
Tracheal intubation and ventilation settings were sim-ilar to phase I. Remifentanil Ce was changed to 1 ng.mL-1 until surgical incision. The second blood sample was col-lected 10 minutes after LOC. A second reduction of propofol Ce was performed with the same magnitude as the CO vari-ation observed in phase I patients and 2 minutes later, the third blood sample was collected. Afterward, patients were placed in the KC position as described in phase I. Ten min-utes after KC positioning and before incision, the fourth blood sample was collected (Figure 3). At this point, phase II of the study was completed.
3.3. Plasma Propofol Sampling
During the study period, 3 mL arterial blood sam-ples were collected from the left radial artery into hep-arin containing tubes for propofol and propofol metabo-lites quantification in the plasma according to the pro-tocol. The propofol plasma concentration and its free metabolites were determined by gas chromatography mass-spectrometry with some adjustments (18,19).
The accuracy and bias of model predictions were cal-culated from differences between propofol Cm and Cp for
each individual patient expressed as the prediction error (PE) (3), median prediction error (MDPE), and median ab-solute performance error (MDAPE). An acceptable perfor-mance was characterized by MDPE of less than 20% (-20 to 20%) and MDAPE of 20% - 40%. A model is most accurate when the values of MDPE and MDAPE are close to zero. In TCI, the typical accepted values are 10% to 20% for bias and around 30% for accuracy (20).
3.4. Data Analysis
Data were collected using LiDCO rapid® and RugLoopII© software that gathered data independently and with different sampling frequencies; therefore, syn-chronization between data was mandatory for this study. Dedicated software was developed in Matlab® for the interface. For data analysis, one-minute duration windows were considered around each of the above-defined study moments and the average of the observed values was computed for each window. The statistical analysis was considered as a full factorial model in a two-way mixed ANOVA analysis used to compare the mean differences of the measured variables, considering the main effect “Moment” (within-subjects: same individual at different moments), the main effect “Phase” (between-subjects: different individuals, a group compared to another) and their interactions “Moment×Phase”. A P value of < 0.05 was considered statistically significant. Further post hoc testing (ANOVA and t-test with Bonferroni correction) was conducted to compare “Moments” and “Phases”. The results were expressed as mean±standard deviation (SD). All statistical analyses were conducted in SPSS®software V. 25 (IBM, New York, USA).
4. Results
Twenty patients (9 in phase I and 11 in phase II) were in-cluded in this study. Patients’ demographic data are pre-sented inTable 1.
Data concerning the drugs used, HD parameters, and BIS values are reported inTable 2. In phase I, there were no protocolled propofol target reductions; thus, propofol Ce target concentrations were manually modified by the anesthesiologist, guided by BIS and HD parameters (Figure 2). Propofol Ce and Cp were statistically different between all moments (P < 0.001) but measured propofol did not show any differences (Table 2).
There were significant HD changes after anesthesia in-duction and after KC positioning with respect to the base-line in both phases (Figure 4). In phase I, CO fell by 25.6% after induction and 38.4% after KC position, compared to the baseline.
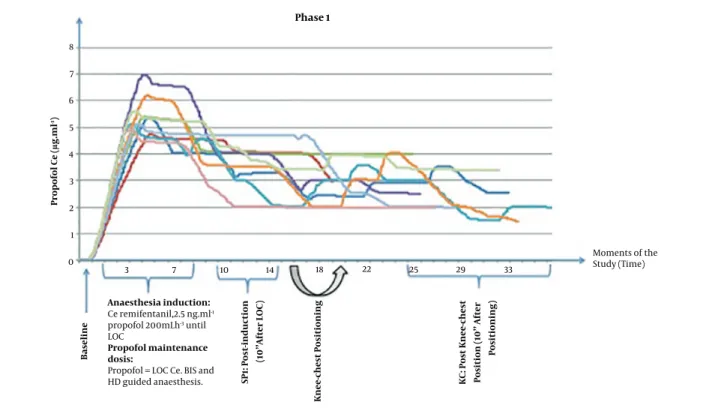
Anaesthesia induction: Ce remifentanil,2.5 ng.ml-1 propofol 200mLh-3 until LOC Propofol maintenance dosis:
Propofol = LOC Ce. BIS and HD guided anaesthesis. 3 7 10 14 18 22 25 29 33 Moments of the Study (Time) Phase 1 Propofol Ce ( µ g.ml -1) 8 7 6 5 4 3 2 1 0 Bas eli ne KC: Post Knee -che st P osi tion (10 ’’ Aft er Positio ning ) SP 1: Post-in d u ct ion (10’’ Afte r L OC) Knee -ch est Positi oning
Figure 2. Relationship between propofol effect-site concentration (Ce) (µg.mL-1) and moments of the study (time) in phase I (baseline, SP1, and KC). HD, hemodynamic; LOC, loss of consciousness; KC, knee-chest; SP1, supine.
Table 1. Demographics and Baseline Values of the Subjects in Phase I and Phase IIa
Characteristics Phase I Phase II
Age, y 49.3±8.7 59.7±13.5
Sex (f/m) 6/3 6/5
Height, cm 161.6±9.0 167.8±12.4
Weight, kg 70.9±13.9 77.3±11.6
Body Mass Index, kg.m-2 27.0±3.5 27.4±3.0
ASA classification I/II 3/6 2/9
Cardiac output (baseline), L.min-1 7.4±1.8 7.2±2.3 Propofol Ce at LOC,µg.mL-1 5.03±0.75 4.34±1.52 Time to LOC, min 3.76±0.80 3.05±1.22 Abbreviations: ASA, American Society of Anesthesiologists; LOC, loss of con-sciousness; Propofol Ce, propofol effect-site concentration.
aValues are expressed as No. or mean±SD.
In phase II, after induction, propofol target Ce was set at a value below the Ce at LOC, based on the formula pre-sented earlier in methods. The average decrease in propo-fol Ce propo-following LOC was 27.5%, with a maximum of 43% (prop Ce LOC = 7.0µg.mL-1) and a minimum of 19% (prop Ce LOC = 2.7µg.mL-1). The second reduction in propofol was performed in all patients that was equal to the CO
reduc-tion measured in patients from the phase I following KC positioning (17.2%) (Figure 3). Propofol Ce and Cp were sta-tistically different between all moments, except between SP2 and KC moment (Table 2). Measured propofol showed a statistical difference between SP2 and KC moment (P = 0.013).
In phase II, despite propofol Ce reductions, CO reduced significantly from baseline 46.9%, after induction 19.8% and after KC position 31% (Figure 4). From moment SP1 to moment SP2, HD parameters did not vary.
In both phases, there was no statistical association be-tween CO changes and age, weight, gender, baseline CO, and propofol Ce at LOC (P > 0.05). A correlation was found between baseline CO and propofol requirements for LOC (propofol infused volume until LOC), with statis-tical significance in phase II (r = 0.76; P = 0.006). Be-tween phases, there were significant differences in propo-fol Ce (P = 0.005) and propopropo-fol Cp (P = 0.015) at the SP1 mo-ment. Propofol infused volume was statistically different between all moments and between phases, except for LOC. A total of 71 arterial blood samples were obtained, propofol concentrations were measured, and the pre-dicted error was calculated for each patient, as shown in
Table 3.
Moments of the Study (Time) Phase 2 Propofol Ce ( µ g.ml -1) 8 7 6 5 4 3 2 1 0 Baseline KC: Post Kne e-che st Position (10’’ Af ter Positi on ing) SP1: Post-induc ti on (1 0 ’’Aft er LOC) SP2:2’’ Aft er 2 nd Re d u ct ion of Pr op ofol Knee-ch est Positioning Anaesthesia Induction: Ce Remifentanil 2.5 ng.ml-2
Propofol 200 ml.h-1 Until LOC
Propofol Maintenance Dosis:
% of LOC Ce. Calculated by a Formula
1% Reduction of Propofol
2 7 10 12 17 20 23 27 30 33
Figure 3. Relationship between propofol effect-site concentrations (Ce) (µg.mL-1) and moments of the study (time) in phase II (baseline, SP1, SP2 and KC). HD, hemodynamic; LOC, loss of consciousness; KC, knee-chest; SP1, supine; SP2, supine after the second reduction in propofol infusion.
Table 2. Drug Data, Cardiac Output, and BIS Values for Each Moment and Each Phasea, b Drugs Data and
Variables (Units)
Phase I (N = 9) Phase II (N = 11) Two-Way ANOVA (P Value) Baseline SP1 KC Baseline SP1 SP2 KC Moment Phase Moment×Phase Propofol (µg.mL-1)
Ce 5.03±0.75 (LOC) 3.84±0.63c 2.53±0.79e 4.34±1.52 (LOC) 2.92±0.64c 2.47±0.57 2.20±0.51e < 0.001* 0.054 0.352
Cp - 3.83±0.74 2.48±0.86e - 2.97±0.68 2.46±0.58 2.24±0.58e < 0.001* 0.06 0.083
Cm - 3.61±1.14 3.31±2.11 - 2.96±0.81 2.68±0.72 3.90±1.90f 0.455 0.961 0.162
Remifentanil (ng.mL-1)
Ce - 2.36±0.42 1.11±0.35e - 1.85±0.66 1.12±0.20 1.15±0.48e < 0.001* 0.132 0.107
Propofol Inf. volume (mL)
12.46±2.44 (LOC) 22.53±4.09c 37.09±8.07d,e 9.63±4.09 (LOC) 15.86±6.10c 19.36±6.71 27.15±8.63d, e, f < 0.001* 0.014* 0.034*
BIS 94.0±2.2 61.8±15.2c 42.3±15.1e 95.3±2.6 49.9±9.8c 46.5±7.5 37.7±8.7d, e < 0.001* 0.056 0.165
Cardiac output (L.min-1)
7.4±1.8 5.4±1.3c 4.4±1.2d 7.2±2.3 5.6±1.6c 5.6±1.7 3.9±1.9d, e < 0.001* 0.867 0.514
Abbreviations: Ce, effect-site concentration; Cm, measured plasmatic concentration; Cp, predicted plasmatic concentration; Inf., Infused; LOC, loss of consciousness; KC, knee-chest; SP1, supine; SP2, supine after the second reduction in propofol infusion.
aValues are expressed as mean±SD.
bThe superscripts c, d, e, and f indicate significant differences (5% level) on repeated measures ANOVA post hoc pairwise testing with Bonferroni correction (*). cSignificant differences between Baseline and SP1.
dSignificant differences between Baseline and KC; eSignificant differences between SP1 and KC; f Significant differences between SP2 and KC.
Cp and Cm (P = 0.559) and there was a statistical correlation between them (r = 0.640; P = 0.002). At the KC moment, there was an underestimation of propofol plasma concen-trations from the Pk model in both phases (34% in phase I and 74% in phase II) (Figure 5). Cp and Cm were
statisti-cally different (P = 0.005) and there was no statistical corre-lation between them (r = 0.374; P = 0.104). In both phases, BIS values did not differ between phases (P = 0.165) (Table 2). There were no cases of patient awareness. Linear regres-sion analysis revealed no statistically significant
relation-Phase 1 Phase 2 7,5 7,0 6,5 6,0 5,5 5,0 4,5 4,0 3,5 120 110 100 90 80 70 60 50 110 100 90 80 70 60 50 40 1600 1400 1200 1000 800 Baseline SP1 SP2 KC CARDIAC OUTPUT (L/min)
MEAN ARTERIAL PRESSURE
(mmHg) STRO KE VOLUME (mL/B eat) SY STEMIC VASCULAR R ESIS T A N CE (Dy ne s.sec/ cm -5)
Figure 4. HD changes (cardiac output, mean arterial pressure, stroke volume, and systemic vascular resistance variation) in phase I and phase II.
ship between BIS values and propofol Cm or BIS values and cardiac output at any moment.
5. Discussion
In the present study, a propofol TCI system with Schnider Pk model was used to drive a propofol pump that showed a marked underestimation of plasma propofol lev-els in patients placed in the KC position. The study also showed that the KC position was associated with signif-icant hemodynamic changes, as a reduction in CO from baseline was observed (Figure 4). After induction, the Schnider Pk model showed a good performance in Cp pre-diction (Table 3). Also, there was a statistical correlation be-tween Cp and Cm. In the KC position, when the greatest
Table 3. Performance Analysis of the Propofol Schnider Pk Model Expressed in Me-dian Prediction Error (MDPE) and MeMe-dian Absolute Performance Error (MDAPE) for Each Moment and Phase (%)
Moments Propofol Pk Model Performance (%)
MDPE MDAPE Phase I SP1 -6% (-49 to 20) 15% (1 to 49) KC 28% (-35 to 114) 35% (6 to 114) Phase II SP1 13% (-43 to 45) 20% (4 to 45) SP2 18% (-45 to 56) 32% (0 to 56) KC 48% (-44 to 270) 48% (6 to 270) Abbreviations: KC, knee-chest; SP1, supine; SP2, supine after the second reduc-tion in propofol infusion.
CO reduction occurred, Schnider Pk model performance was not accurate, as propofol Cp was not correlated with Cm and it was markedly underestimated by 34% in phase I and 74% in phase II. Also, in the KC position, the MDPE and MDAPE values calculated at this moment did not show a good performance.
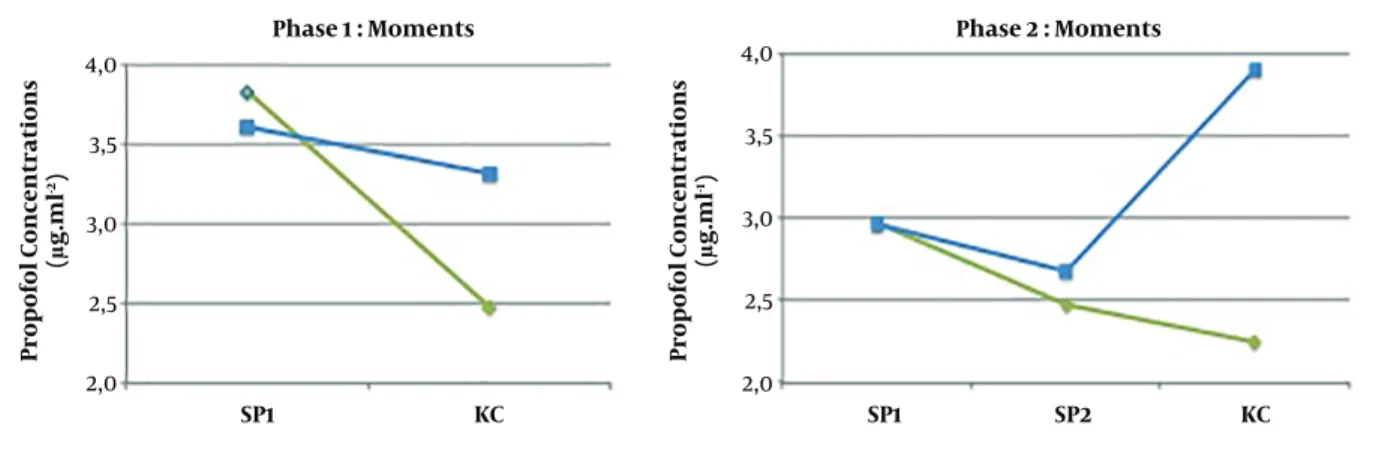
In phase II, between moment SP2 and moment KC, when propofol Cp and propofol Ce concentrations were unchanged and the only intervention performed on pa-tients was KC positioning, it was observed an increase in the measured propofol concentrations (P = 0.013) and a de-crease in BIS values (P = 0.004) (Figure 5).
The influence of CO on the pharmacokinetic models to predict propofol plasma concentrations during TCI had al-ready been discussed by some authors (6). It can be spec-ulated that the difference between the predicted and mea-sured propofol concentrations in patients with lower CO is most likely related to a decrease in total propofol clear-ance, but further data are still needed to correlate CO or liver blood flow and plasma clearance of propofol. Upton et al. (14) reported an inverse relationship between CO and propofol concentrations after a short propofol infusion in an ovine model. Myburgh et al. (8) observed the same re-lationship during longer propofol infusions in a high-CO state induced by catecholamine infusion in the ovine. Ku-rita et al. (5) confirmed, in a swine model, that Cp was versely correlated with changes in CO during constant in-fusion. We also plotted the relationship between measured Cp and the inverse of CO, but we did not observe any sta-tistical association. It must be highlighted that most of the published studies were performed in animal models, with no studies in humans. Recently, Keyl et al. (4) found that Schnider Pk model markedly underestimated Cp in patients with impaired left ventricular function.
correla-Phase 1 : Moments Phase 2 : Moments SP1 KC SP1 SP2 KC 4,0 3,5 3,0 2,5 2,0 4,0 3,5 3,0 2,5 2,0 Pro pofol Concentrations (µg.ml -2) Pro pofol Concentrations (µg.ml -1)
Figure 5. Predicted (green line) and measured (blue line) propofol concentrations (µg.mL-1) at SP1, SP2 (phase II), and KC moment in both phases. KC, knee-chest; SP1, supine; SP2, supine after the second reduction in propofol infusion.
tion between propofol infused volume until LOC and base-line CO, showing that CO is a determinant to infer the ini-tial concentrations of propofol for anesthesia induction (14).
In the present study, we expected a correlation be-tween propofol infused volume and CO fall. Comparing both phases, propofol consumption (propofol infused vol-ume) was much lower in phase II than in phase I (P = 0.034) (Table 2). Also, patients in both phases did not show differ-ences in BIS values and other parameters; thus we can con-clude that patients in the KC position need lower propo-fol concentrations. Nevertheless, propopropo-fol targeted reduc-tions did not attenuate the CO fall when placing patients in the KC position, as the authors previously hypothesized. The results suggest that planned decrements in propofol target Ce did not correspond to a decrease in Cm (Figure 5), as in phase II, after two reductions, the underestimation increased at the KC moment.
Furthermore, hemodynamic changes should be avoided in high-risk patients, even for short periods, as they are associated with poor outcomes (21-23). The present study also showed an important finding that even in ASA 1 and 2 patients, significant HD changes may occur after the KC position.
5.1. Limitations
The present study has several limitations. ANOVA was quite comprehensive, with three measures compared in each individual and between the two groups. However, re-garding propofol concentrations, the sample size may be considered small. The definition of the moments of data analysis was a challenge. We defined a 10-minute period stabilization following induction and KC positioning ac-cording to the literature (10, 24). The fact that this was a non-randomized study may be considered a limitation.
However, we needed data from the first phase to determine the intervention in the second phase.
5.2. Conclusions
Our study showed that the measured propofol con-centrations, after hemodynamic changes associated with the KC position, were much higher than the values pre-dicted by Schnider Pk model. Planned propofol reduc-tions did not attenuate the underestimation error from the Pk model. When placing patients in the KC position, BIS values decreased and the measured propofol concentra-tions increased. Our results suggest that the CO variation was responsible for the pharmacokinetic phenomenon de-scribed above. In high-risk patients placed in the KC po-sition, anesthesiologists must be aware of these pharma-cokinetic changes and, in addition to standard monitor-ing, the use of depth of anesthesia and cardiac output monitors may be considered. Further work is planned in an educational area with a simulation program to prepare surgical teams to a structured and careful approach for these patients.
Footnotes
Authors’ Contribution: Daniela Chalo, Sara Pedrosa, and Pedro Amorim designed the study. Daniela Chalo, Sara Pe-drosa, and Aura Silva collected the data. Daniela Chalo, Aura Silva, and Paula Guedes de Pinho helped in propofol analysis. Sonia Gouveia and Rui Correia conducted the sta-tistical analysis. Daniela Chalo and Sara Pedrosa wrote the manuscript. Pedro Amorim, Rui Correia, Paula Guedes de Pinho, and Consuelo Sancho helped to write and revise the manuscript.
Clinical Trial Registration Code: ClinicalTrials.gov, ID: NCT03961958 registered 22 May 2019.
Conflict of Interests: Authors declare that there is no con-flict of interest in this study.
Ethical Approval: This prospective cohort study was ap-proved by the local Research Ethics Board of the Centro Hospitalar do Porto in Oporto, Portugal on the 3rd of July 2009, chaired by Luisa Bernardo: ref. 061/09 (041-DEFI/057-CES).
Funding/Support: This work was partially funded
by the Foundation for Science and Technology, FCT, through national (MEC) and European structural (FEDER) funds, in the scope of the research projects UID/MAT/04106/2019 (CIDMA/UA), UID/CEC/00127/2019 (IEETA/UA) and UID/MAT/00144/2019 (CMUP/UP). This work was also partially suported by Portugal 2020 under the Competitiveness and Internationalization Operational Program, and by the European Regional Development Fund through project SOCA-Smart Open Campus (CENTRO-01-0145-FEDER-000010), acknowledgements from Sonia Gouveia. Aura Silva also acknowledges the postdoctoral grant by FCT (ref. SFRH/BPD/75697/2011).
Patient Consent: Written and informed consent was re-quested to all patients.
References
1. Sepulveda PO, Carrasco E, Tapia LF, Ramos M, Cruz F, Conget P, et al. Evidence of hysteresis in propofol pharmacodynamics. Anaesthesia. 2018;73(1):40–8. doi:10.1111/anae.14009. [PubMed:28872658]. 2. Servin FS. TCI compared with manually controlled infusion of
propo-fol: A multicentre study. Anaesthesia. 1998;53 Suppl 1:82–6. doi:
10.1111/j.1365-2044.1998.53s107.x. [PubMed:9640123].
3. Masui K, Upton RN, Doufas AG, Coetzee JF, Kazama T, Mortier EP, et al. The performance of compartmental and physiologically based recirculatory pharmacokinetic models for propofol: A compari-son using bolus, continuous, and target-controlled infusion data. Anesth Analg. 2010;111(2):368–79. doi: 10.1213/ANE.0b013e3181bdcf5b. [PubMed:19861357].
4. Keyl C, Trenk D, Laule S, Schuppe C, Staier K, Wiesenack C, et al. Pre-dicted and measured plasma propofol concentration and bispec-tral index during deep sedation in patients with impaired left ven-tricular function. J Cardiothorac Vasc Anesth. 2009;23(2):182–7. doi:
10.1053/j.jvca.2008.08.016. [PubMed:19026568].
5. Kurita T, Morita K, Kazama T, Sato S. Influence of cardiac output on plasma propofol concentrations during constant infusion in swine. Anesthesiology. 2002;96(6):1498–503. doi: 10.1097/00000542-200206000-00033. [PubMed:12170066].
6. Minto CF, Schnider TW. Contributions of PK/PD modeling to in-travenous anesthesia. Clin Pharmacol Ther. 2008;84(1):27–38. doi:
10.1038/clpt.2008.100. [PubMed:18463625].
7. Ludbrook GL, Upton RN. A physiological model of induction of anaesthesia with propofol in sheep. 2. Model analysis and impli-cations for dose requirements. Br J Anaesth. 1997;79(4):505–13. doi:
10.1093/bja/79.4.505. [PubMed:9389271].
8. Myburgh JA, Upton RN, Grant C, Martinez A. Epinephrine, nore-pinephrine and dopamine infusions decrease propofol concentra-tions during continuous propofol infusion in an ovine model. Intensive Care Med. 2001;27(1):276–82. doi: 10.1007/s001340000793. [PubMed:11280648].
9. Cowley NJ, Hutton P, Clutton-Brock TH. Assessment of the perfor-mance of the Marsh model in effect site mode for target controlled
infusion of propofol during the maintenance phase of general anaes-thesia in an unselected population of neurosurgical patients. Eur J Anaesthesiol. 2013;30(10):627–32. doi:10.1097/EJA.0b013e328363157a. [PubMed:23962821].
10. Bennarosh L, Peuch C, Cohen J, Dauzac C, Guigui P, Mantz J, et al. Ef-fects of the knee-chest position on cardiac index and propofol re-quirements during bispectral index (BIS)-guided spine surgery. Ann Fr Anesth Reanim. 2008;27(2):158 e1–5. doi:10.1016/j.annfar.2007.10.037. [PubMed:18164579].
11. Poon KS, Wu KC, Chen CC, Fung ST, Lau AW, Huang CC, et al. Hemodynamic changes during spinal surgery in the prone posi-tion. Acta Anaesthesiol Taiwan. 2008;46(2):57–60. doi: 10.1016/S1875-4597(08)60026-0. [PubMed:18593649].
12. Edgcombe H, Carter K, Yarrow S. Anaesthesia in the prone position. Br J Anaesth. 2008;100(2):165–83. doi: 10.1093/bja/aem380. [PubMed:
18211991].
13. Chui J, Craen RA. An update on the prone position: Continu-ing professional development. Can J Anaesth. 2016;63(6):737–67. doi:
10.1007/s12630-016-0634-x. [PubMed:27072147].
14. Upton RN, Ludbrook GL, Grant C, Martinez AM. Cardiac output is a determinant of the initial concentrations of propofol after short-infusion administration. Anesth Analg. 1999;89(3):545–52. doi:
10.1097/00000539-199909000-00002. [PubMed:10475279]. 15. Willars C, Dada A, Hughes T, Green D. Functional haemodynamic
monitoring: The value of SVV as measured by the LiDCORapid in pre-dicting fluid responsiveness in high risk vascular surgical patients. Int J Surg. 2012;10(3):148–52. doi:10.1016/j.ijsu.2012.02.003. [PubMed:
22330275].
16. Hadian M, Kim HK, Severyn DA, Pinsky MR. Cross-comparison of car-diac output trending accuracy of LiDCO, PiCCO, FloTrac and pul-monary artery catheters. Crit Care. 2010;14(6):R212. doi:10.1186/cc9335. [PubMed:21092290]. [PubMed Central:PMC3220011].
17. Vincent JL, Pelosi P, Pearse R, Payen D, Perel A, Hoeft A, et al. Periop-erative cardiovascular monitoring of high-risk patients: A consensus of 12. Crit Care. 2015;19:224. doi:10.1186/s13054-015-0932-7. [PubMed:
25953531]. [PubMed Central:PMC4424585].
18. Guitton J, Desage M, Lepape A, Degoute CS, Manchon M, Brazier JL. Quantitation of propofol in whole blood by gas chromatography -mass spectrometry. J Chromatogr B Biomed Sci Appl. 1995;669(2):358– 65. doi:10.1016/0378-4347(95)00105-r.
19. Silva A, Campos S, Monteiro J, Venancio C, Costa B, Guedes de Pinho P, et al. Performance of anesthetic depth indexes in rab-bits under propofol anesthesia: Prediction probabilities and concentration-effect relations. Anesthesiology. 2011;115(2):303–14. doi:
10.1097/ALN.0b013e318222ac02. [PubMed:21705870].
20. Glen JB, Servin F. Evaluation of the predictive performance of four pharmacokinetic models for propofol. Br J Anaesth. 2009;102(5):626– 32. doi:10.1093/bja/aep043. [PubMed:19297371].
21. Mascha EJ, Yang D, Weiss S, Sessler DI. Intraoperative mean ar-terial pressure variability and 30-day mortality in patients hav-ing noncardiac surgery. Anesthesiology. 2015;123(1):79–91. doi:
10.1097/ALN.0000000000000686. [PubMed:25929547].
22. Monk TG, Bronsert MR, Henderson WG, Mangione MP, Sum-Ping ST, Bentt DR, et al. Association between intraoperative hypotension and hypertension and 30-day postoperative mor-tality in noncardiac surgery. Anesthesiology. 2015;123(2):307–19. doi:
10.1097/ALN.0000000000000756. [PubMed:26083768].
23. Walsh M, Devereaux PJ, Garg AX, Kurz A, Turan A, Rodseth RN, et al. Relationship between intraoperative mean arterial pressure and clinical outcomes after noncardiac surgery: Toward an empiri-cal definition of hypotension. Anesthesiology. 2013;119(3):507–15. doi:
10.1097/ALN.0b013e3182a10e26. [PubMed:23835589].
24. Reich DL, Hossain S, Krol M, Baez B, Patel P, Bernstein A, et al. Predictors of hypotension after induction of general anes-thesia. Anesth Analg. 2005;101(3):622–8. table of contents. doi: