Article
J. Braz. Chem. Soc., Vol. 24, No. 7, 1123-1134, 2013. Printed in Brazil - ©2013 Sociedade Brasileira de Química 0103 - 5053 $6.00+0.00
A
*e-mail: [email protected]
Characterization and Corrosion Resistance of Anodic Electrodeposited
Titanium Oxide/Phosphate Films on Ti-20Nb-10Zr-5Ta Bioalloy
Monica Popa, Cora Vasilescu, Silviu I. Drob, Petre Osiceanu, Mihai Anastasescu and Jose M. Calderon-Moreno*
Institute of Physical Chemistry “Ilie Murgulescu” of the Romanian Academy, Spl. Independentei 202, PO Box 12-194, 060021 Bucharest, Romania
Neste trabalho, a eletrodeposição galvanostática anódica de um filme de oxidação contendo fosfatos em liga de Ti-20Nb-10Zr-5Ta de uma solução de ácido ortofosfórico é apresentada. Sua composição foi determinada por difratometria de raios X (XRD), espectroscopia no infravermelho por transformada de Fourier (FTIR) e micro-espectroscopia Raman, e a topografia por microscopia de força atômica (AFM). A resistência à corrosão da liga recoberta em fluido humano simulado (por método de polarização linear, monitoramento de potenciais de circuito aberto e gradientes do potencial de circuito aberto correspondentes) assim como a caracterização do recobrimento (por espectroscopia Raman e perfil de profundidade por espectroscopia fotoeletrônica de raios X (XPS)) depositado por um período de imersão de 300 h em fluido humano simulado foram estudadas. O filme eletrodepositado era composto de dióxido de titânio amorfo e grupos fosfato. A resistência à corrosão da liga Ti-20Nb-10Zr-5Ta recoberta em soluções de Ringer neutra e alcalina foi maior que a da liga pura devido as propriedades protetoras do filme eletrodepositado. Os parâmetros de corrosão foram aprimorados com passar do tempo como resultado do espessamento do filme da superfície por deposição da solução fisiológica. O recobrimento depositado apresentou uma composição variável em profundidade, na camada mais profunda hidroxiapatita nanocristalina nucleada e na camada exterior fosfato de cálcio amorfo.
In this work, the anodic galvanostatic electrodeposition of an oxidation film containing phosphates on Ti-20Nb-10Zr-5Ta alloy from orthophosphoric acid solution is presented. Its composition was determined by X-ray diffractometry (XRD), Fourier transform infrared spectroscopy (FTIR) and Raman micro-spectroscopy, and its topography by atomic force microscopy (AFM). The corrosion resistance of the coated alloy in simulated human fluid (by linear polarization method and monitoring of open circuit potentials, corresponding open circuit potential gradients) as well as the characterization of the coating (by Raman spectroscopy and depth profile X-ray photoelectron spectroscopy (XPS)) deposited in a period of 300 h soaking in simulated human body fluid were studied. The electrodeposited film was composed of amorphous titanium dioxide and contained phosphate groups. The corrosion resistance of the coated Ti-20Nb-10Zr-5Ta alloy in neutral and alkaline Ringer’s solutions was higher than that of the bare alloy due to the protective properties of the electrodeposited film. The corrosion parameters improved over time as result of the thickening of the surface film by the deposition from the physiological solution. The deposited coating presented a variable composition in depth: at the deeper layer nucleated nanocrystalline hydroxyapatite and at the outer layer amorphous calcium phosphate.
Keywords: surface functionalization, galvanostatic deposition, deposition from simulated human fluids, depth profile XPS, corrosion
Introduction
Materials used as bone substitutes must bind to living bones. The most known implant materials, titanium and its
contain calcium and phosphate ions and that can supply increased amounts of Ca2+ and PO
43− ions in short term, assuring the bone fixation and osseointegration.8,9 Calcium phosphates (i.e., apatite) are very similar to mineral bone in composition and structure1,10 and can bind to living bone due to their bioactivity and bone forming ability. Also, hydroxyapatite ceramics demonstrated very good bioactivity and capability to form a direct chemical bond with natural bone.11 But these apatite coatings delaminated very easily and it was necessary to obtain oxidation films with high adherence to the alloy surface. The most rapid and cheap techniques to obtain oxidation films are chemical and electrochemical deposition.
Electrodeposition can be applied by potentiostatic and galvanostatic methods. Potentiostatic polarization at a constant voltage with metallic substrate as cathode and using different solutions, mainly containing phosphorus ions, conducted to the formation of titanium dioxide films with high adhesion strength;12 also, potentiostatic anodic oxidation in acid solutions at high voltage8,13 produced titania nanotubes. Galvanostatic method consisted on the application of a high constant current density on the metal surface serving as cathode10,11 or anode;3,14-16 the obtained oxide films offered high protection to the titanium alloys when they were immersed in simulated body fluids.
In this work, our group presents the anodic galvanostatic electrodeposition of a titanium oxide/phosphate film on the new Ti-20Nb-10Zr-5Ta alloy surface. Its composition was determined by X-ray diffractometry (XRD), Fourier transform infrared spectroscopy (FTIR) and Raman micro-spectroscopy, and its topography by atomic force microscopy (AFM); also, the corrosion resistance of the coated alloy in simulated human body fluids (by cyclic potentiodynamic and linear polarization methods and monitoring of open circuit potentials and corresponding open circuit potential gradients) as well as the characterization of the coating (by Raman and X-ray photoelectron spectroscopy (XPS)) deposited in a period of 300 h soaking in physiological Ringer’s solutions were studied.
Experimental
Preparation of Ti-20Nb-10Zr-5Ta alloy samples
The new Ti-20Nb-10Zr-5Ta alloy (containing only non-toxic elements) was obtained by double vacuum melting in a semi-levitation furnace. The raw materials had high purity: Ti - in accordance with ASTM F 67; Nb - 99.81% purity; Zr - 99.6% purity; Ta - 99.59% purity.
The alloy had the following composition: 0.011% H2; 0.06% C; 0.02% N2; 0.12% O2; 0.166% Mg; 0.135% Al; 0.192% Si; 0.078% V; 0.025% Cr; 0.0001% Fe; 0.0098% Ni; 0.0001% Mo; 0.026% W; 9.54% Zr; 20.11% Nb; 4.68% Ta; balance Ti. Ingots in as-cast state were used to cut the cylindrical electrodes, which were polished with emery paper of different granulations, until 2000 mesh and then with alumina paste until mirror surface finish; then, the electrodes were ultrasonically degreased in acetone and bi-distilled water for 15 min, dried in air and mounted in a Stern-Makrides hold system.
Anodic galvanostatic polarization of Ti-20Nb-10Zr-5Ta alloy
The anodic galvanostatic polarization (AGP) was applied by a high power current source (MATRIX, China) that can supply a maximum current of 3 A and a voltage of 160 V. The electrochemical glass cell contained Ti-20Nb-10Zr-5Ta alloy working electrode (area of 1.76 cm2) and platinum auxiliary electrode (foil with area of 4 cm2); the current density of 5 or 10 mA cm-2 was maintained for different time periods of 15, 35, 45 and 60 min. The anodization solutions consisted of orthophosphoric acid (H3PO4, p.a. Lach-Ner, Czech Republic) with concentrations of 0.3 and 1 mol L-1 obtained by dilution of the concentrated 85% H3PO4 with bi-distilled water. Varying the solution concentration, current density and electrodeposition time, different films were obtained. The film with the most favorable structural and topographical properties was selected, and corrosion resistance of the Ti-20Nb-10Zr-5Ta alloy protected with this film in different simulated physiological solutions was studied.
Composition, microstructure and topography of the films
The compositions of the initial electrodeposited film and of the coating grown after immersion in Ringer’s solutions were verified by XRD, FTIR, Raman micro-spectroscopy and XPS.
X-ray diffraction patterns were recorded with a Rigaku Ultima IV (Rigaku Corporation, Tokyo, Japan) diffractometer θ-2θ using Cu Kα (λ = 1.5406 Å) radiation
over the range 10 < 2θ/degree < 70 at 40 kV and 30 mA.
Raman spectra were measured at room temperature with with a LabRAM Jobin Yvon equipment (Horiba Jobin Yvon, Tokyo, Japan). Acquisition time was about 40 s. The green line (λ = 514.5 nm) of an Ar+ laser was used to excite the Raman spectra at a power of ca. 20 mW. Measurements were carried out under the microscope having a 90 × objective; the laser spot size was around 1-2 µm. Raman measurements covered the range between 100 and 1100 cm-1.
The film and coating topography and roughness were determined by AFM. AFM measurements were carried out in the non-contact mode with a XE-100 apparatus (Park Systems, South Korea) equipped with flexure-guided, cross-talked eliminated scanners, using sharp tips (tip radius < 7 nm; PPP-NCLR type from NanosensorsTM) of about 225 µm length, 38 µm width and 48 N m-1 spring constant, ca. 190 kHz resonance frequency. The topographical 2D and 3D AFM images were taken over the area of 2 × 2 µm2, and were used for the calculation of the root mean square (RMS) roughness and average surface roughness (Rav). Phase contrast images, giving qualitative information about chemical homogeneity, are presented as measured (raw data, no filtering) on the same area, as the topographic ones.
The composition of the coating formed on the Ti-20Nb-10Zr-5Ta alloy surface was analyzed by XPS using a Quantera SXM equipment (Physical Electronics, Inc., Chanhassen, MN, USA), with a base pressure in the analysis chamber of 1.33 10-7 Pa. The X-ray source was Al Kα radiation (1486.6 eV, monochromatized) and the overall
energy resolution is estimated at 0.65 eV by the full width at half maximum (FWHM) of the Au 4f7/2 line. In order to take into account the charging effect on the measured binding energies (BEs), the spectra were calibrated using the C 1s line (BE = 284.8 eV, C−C (CH)n bindings) of
the adsorbed hydrocarbon on the sample surface. All the calculations were performed assuming that the samples were homogeneous within the XPS detected volume. The errors in the quantitative analysis (relative concentrations) were estimated in the range of ± 10 %, and the accuracy for BE assignments was ± 0.2 eV.
Corrosion resistance of coated Ti-20Nb-10Zr-5Ta alloy in simulated human body fluids
The behavior of the coated Ti-20Nb-10Zr-5Ta alloy was studied in Ringer’s solution17,18 with the following composition: 6.8 g L-1 NaCl, 0.4 g L-1 KCl, 0.2 g L-1 CaCl2, 0.2048 g L-1 MgSO4.7H2O, 0.1438 g L-1 NaH2PO4. H2O, 1.1 g L-1 NaHCO3 and 1 g L-1 glucose, pH 7.58 and 8.91 obtained by KOH addition. Ringer’s solutions were prepared by the dissolution of p.a. substances (Sigma Aldrich, Germany) in bi-distilled water under stirring.
The corrosion resistance of the coated alloy was appreciated by cyclic potentiodynamic and linear polarization methods and the monitoring of open circuit potentials (Eoc) and corresponding open circuit potential gradients (∆E
oc).
The cyclic potentiodynamic polarization was started at about −0.7 V (vs. SCE) and the potential was increased
with a rate of 1 mV s-1 until +2 V (vs. SCE). VoltaLab 80 equipment (Radiometer, France) was used. The cyclic curves for coated alloy were compared with those for bare one.
The linear polarization-Tafel representation was performed for ± 100 mV around the open circuit potential
at a scan rate of 1 mV s-1 using the same VoltaLab 80 equipment. VoltaMaster 4 program adjusted the Tafel curves on a narrow potential range of about 20-40 mV, positively and negatively, and then, directly supplies the polarization resistance (Rp) values that characterize the protective degree of the film on the alloy surface, namely, the anticorrosive resistance.
Open circuit potentials (Eoc) were monitored for 300 h of immersion in Ringer’s solutions using Hewlett-Packard 34401A multimeter (HP, USA).
In the human body, important local changes of the pH values (from 7.4 to 8-9) in the surrounding tissues can appear in the case of infections, inflammations or in the distress periods of the body.19,20 Thus, the open circuit potentials will have various values on different zones of an long implant, producing potential differences, namely, potential gradients.21-23 These potential gradients can generate galvanic and local corrosion. Taking into account this fact, this severe functional condition of an implant varying the Ringer’s solution pH values was simulated. The open circuit potential gradient (∆Eoc(pH)) due to the pH non-uniformity in the tissues from the neighborhood of the implant surface was calculated as: 21-23
(1)
A saturated calomel electrode (SCE) was used as reference electrode. All experiments were performed in triplicate and the reproducibility was very good.
Results and Discussions
Electrodeposited film microstructure and topography
Changes in the alloy surface after AGP become apparent due to color changes from grey in the initial alloy surface to green after AGP treatment in the 0.3 mol L-1 H
surface named AGP0.3, and to blue after AGP treatment in the 1 mol L-1 H
3PO4 solution (at a current density 10 mA cm-2 for 15 min), surface named AGP1, all surfaces keeping the bright metallic luster. The color variations are indicative of gradual surface changes in a layer of depth similar to that of the wavelength of visible light. The low resolution optical micrographs do not reveal appreciable morphological changes.
X-ray diffraction measurements (not shown) of AGP0.3 and AGP1 films gave featureless spectra, indicating the amorphous nature of the electrodeposited film.
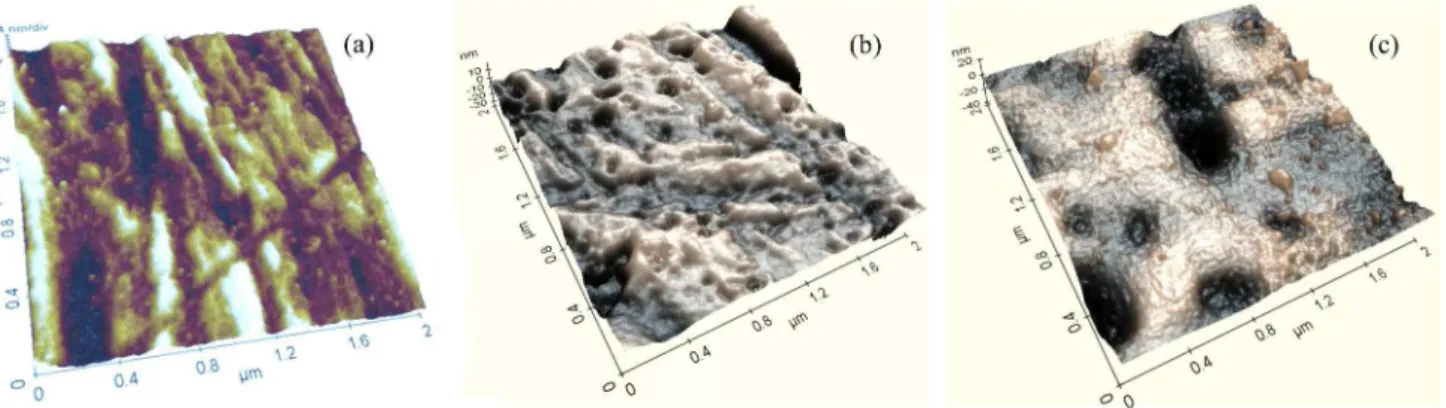
AFM micrographs and tri-dimensional images show the surface topography and surface roughness of the electrodeposited films in the AGP0.3 and AGP1 samples (Figure 1). The micrographs revealed submicron size pores in the AGP0.3 surface, as well as submicron size isolated particles, in AGP1 surface. The RMS and Rav values obtained from AFM measurements were summarized in Table 1 and showed a good roughness. This porous topography is very favorable for the diffusion and for the adherence of the ions and species from the human biofluid on the alloy surface, promoting the deposition of new layers.
Electrodeposited film composition
The composition of the electrodeposited films was studied using micro-Raman and FTIR spectroscopies.
Raman micro-spectroscopy is a technique especially suitable for the analysis of amorphous materials or
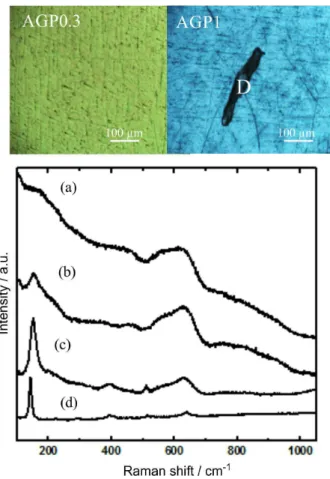
glasses, and can help to reveal the presence of the amorphous phases, in the absence of the long distance order of a crystalline lattice.24 Images (Figure 2) obtained using the optical microscope of the micro-Raman spectrometer show their distinctive colors, green for the AGP0.3 film, blue for the AGP1 film, as well as the presence of deposited microparticles lying on the continuous coating on the AGP1 film. The AGP0.3 film presents a characteristic Raman spectrum (Figure 2a) with a broad band centered at ca. 600 cm-1, a weaker band at ca. 200 cm-1 with a shoulder at ca. 240 cm-1 and a small bump at ca. 450 cm-1. All these bands correspond, respectively, to the B1g, multi-photon process, Eg and A1g characteristic bands of titanium oxide with rutile type binding. The poorly defined bands and the fact that the spectral features of rutile were observed (the high-temperature titanium oxide phase), instead of the bands of the stable anatase structure, confirm the poor crystallinity and a structure of the film close to amorphous titanium dioxide in the AGP0.3 film. It is worth mentioning that Masui et al.25 reported a spectrum very similar to that of AGP0.3 and attributed it to amorphous niobium doped titanium phosphate (Ti(P0.6Nb0.4)O7). McConnell et al.26 identified that the phosphate group can be bound to surface metal oxides, for instance as NbOPO4 compound.
Raman measurements for the AGP1 sample (Figures 2b and 2c) show different spectra explained by the partial ordering of the amorphous titanium dioxide into anatase. The evolution from the AGP0.3 features to those in AGP1 spectrum is clear in Figures 2b and 2c, taken from different areas of AGP1 film: in addition to the wide bands in AGP0.3 film, the main Egvibrational mode of anatase can be observed at 140 cm-1, additional B
1g and Eg bands of anatase
appear at ca. 400 and 630 cm-1. Raman measurements on the microparticles and inclusions existing on the AGP1 sample clearly identify them as anatase (Figure 2d), supporting our explanation for the origin of the Raman features.
The sensitivity of the Raman method for the Ti−O bond
present in AGP samples is significantly higher than that for
Figure 1. AFM micrographs for: (a) bare Ti-20Nb-10Zr-5Ta alloy, (b) AGP0.3 film and (c) AGP1 film.
Table 1. Average surface roughness (Rav) determined by AFM
measurements
Sample RMS / nm Rav / nm
Bare alloy 3.13 2.38
AGP0.3 5.99 3.90
AGP1 6.87 5.10
phosphate bonds. So, the FTIR vibrational spectroscopy was used to investigate the presence of phosphate group in order to complete the compositional analysis of the electrodeposited films.
FTIR spectra for the AGP1 and AGP 0.3 films (Figure 3) reveal the bending and stretching vibrational
modes of phosphate group (PO43
−) at ca. 560-600 cm-1 and 900-1200 cm-1, HPO
42− group at ca. 875 cm-1, carbonate group (CO32
−) on PO
43
− lattice sites at 1420-1460 cm-1, anatase type Ti−O binding at ca. 465 cm-1 and ca. 790 cm-1, adsorbed water (bending mode of H2O) at ca. 1650 cm-1 and hydroxyl group (OH−) at 2800-3700 cm-1.27-30 The bands are much less pronounced in the case of the AGP0.3 film, indicating the formation of a thicker film for the AGP1 film, and the Ti−O groups can be hardly remarked, in
agreement with the observed presence of anatase inclusions only in the AGP1 film.
The AGP1 film presents a wide band in the region of 900-1200 cm-1 (Figure 3) attributed to the ν
1 vibrational mode of the phosphate ion (PO43−). Theoretically, the phosphate ion shows four vibrational modes (ν
1, ν2, ν3 and ν4), all of them being IR active. The phosphate band ν4 is present in the
region 520-660 cm-1 and is well defined in the AGP1 film, with two distinct peaks at 523 and 607 cm-1. The phosphate band ν
2, of weaker intensity, not strong as ν1 and ν4, is found at 465 cm-1 (in hydroxyapatite, it is present at 472 cm-1) superimposed with characteristic bands of anatase type Ti−O
binding which are not visible in AGP0.3 film.
The FTIR results indicate the deposition of an oxide film containing phosphate ions in the AGP1 sample. The phosphate ion is bound to the oxides existing on the alloy surface: TiO2, Nb2O5, ZrO2 and Ta2O5, identified by XPS analysis;31 phosphate ion can form different compounds with these oxides, as reported by Masui et al.25 and McConnell et al.26 It is possible to conclude from the above described results that the AGP0.3 method offers very mild condition for the formation of the oxide film with phosphate group bound to surface oxides.26 By the AGP1 method, the best film was obtained. The corrosion resistance in different simulated physiological solutions of the Ti-20Nb-10Zr-5Ta
Figure 2. Optical micrographs of AGP0.3 and AGP1 samples and Raman
measurements from: (a) AGP0.3, (b) and (c) AGP1 and (d) black particle marked as D on AGP1 image.
alloy protected with AGP1 film will be reported below (as coated alloy).
Behavior of the coated Ti-20Nb-10Zr-5Ta alloy in simulated physiological solutions
Topography of the coated Ti-20Nb-10Zr-5Ta alloy after immersion in physiological solutions
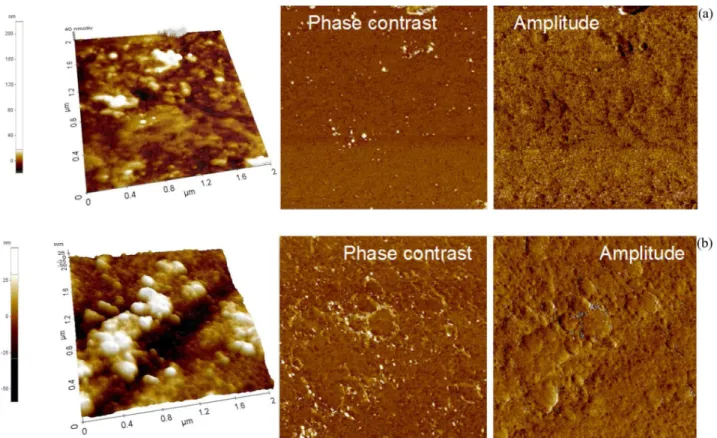
AFM analysis of the microstructural changes of the coated alloy surface after immersion in neutral and alkaline Ringer’s solutions (Figure 4) in phase contrast and amplitude images confirmed the formation of continuous and chemically homogeneous layers. The topographic AFM images give the RMS and Rav values summarized in Table 2. The evolution of the surface roughness indicates the growth of a thicker coating during the immersion in Ringer’s solutions: RMS from 6.87 to 9.32 nm in neutral and to 14.86 nm in alkaline Ringer’s solutions; Rav from 5.10 to 6.21 nm in neutral and to 11.32 nm in alkaline Ringer’s solutions. The increase of the roughness demonstrates the existence of new layers deposited from Ringer’s solutions, namely the formation of a coating. These new depositions can enhance the anticorrosive resistance of the initial coating; indeed, the polarization resistance (Rp) values of the coated alloy (Table 6) increased over time, indicating an improvement of the coating protective properties. For the
bare alloy, the Rp values decreased over time, proving a less protective passive film and no depositions.
Composition of the coating formed after immersion in physiological solutions
XRD measurements (not shown) of the coating deposited after 300 h immersion in neutral and alkaline Ringer’s solutions did not reveal any diffractogram feature, showing that the deposited coating has an amorphous nature.
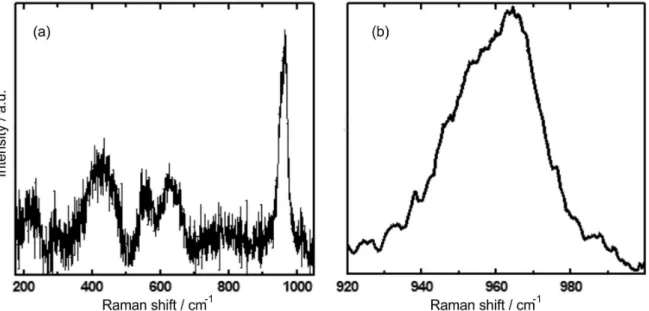
Micro-Raman measurements can identify the presence of even disordered calcium phosphate. Every calcium phosphate phase exhibits distinctive Raman vibrational mode, and therefore, Raman spectroscopy may allow the identification of the type of XRD-amorphous calcium phosphate present in the coating.27,31-36 The main feature in the Raman spectrum is a peak at 960 cm-1 (Figure 5a), this peak corresponds to the intense ν1 mode of the PO43−
ion and its position is characteristic of the PO43
− ion in Figure 4 AFM micrographs in topographical, phase contrast and amplitude modes of coated Ti-20Nb-10Zr-5Ta alloy surface immersed for 300 h in
Ringer’s solutions of: (a) pH 7.58 and (b) pH 8.91.
Table 2. Average surface roughness (Rav) of coated Ti-20Nb-10Zr-5Ta alloy determined after 300 h immersion in Ringer’s solutions
Solution RMS / nm Rav / nm
Ringer’s pH 7.58 9.32 6.21
Ringer’s pH 8.91 14.86 11.32
hydroxyapatite, a crystalline form of calcium phosphate. The wide bands at ca. 450 and ca. 600 cm-1 match to the two other vibrational modes of the PO43
− ion (ν
2 and ν4, respectively) observed in hydroxyapatite.32,33 While the spectrum is similar to that of hydroxyapatite,the relatively low intensity of the main peak when compared with that of the secondary wide bands at ca. 450 and ca. 600 cm-1, the width of the bands and the lack of additional bands due to the splitting of the fundamental vibrational modes of the PO43− ion in the ν2 and ν4 bands indicate the poor ordering of the coating after 300 h immersion in Ringer’s solution at pH 7.58, as confirmed by the XRD measurements for the coating. It is not observed in the Raman spectrum any feature of other forms of crystalline calcium phosphate, such as the double ν
1 peak at 950 and 970 cm-1 of tricalcium phosphate.27 Also, the distinctive secondary features of brushite (880 cm-1 band),32,34 and octocalcium phosphate (OCP) (weak ν3 mode at ca. 1050 cm-1)35 are not recorded. Tsuji et al.36 studied the transformation of amorphous calcium phosphate into hydroxyapatite. They reported very similar spectra for the amorphous calcium phosphate (ACP) precursor of hydroxyapatite and for the nanocrystalline hydroxyapatite (n-HA), and identified the transformation from ACP into n-HA observing the displacement in the main Raman peak, from 950 cm-1 (ACP) to 960 cm-1 (n-HA), accompanied by a reduction of the peak width, full width at half peak (FWHP) of ca. 30 cm-1 in ACP to ca. 15 cm-1 in n-HA. ACP is a precursor in the direct creation of crystalline calcium phosphate in the tooth enamel, dentine and bones in living organisms.36 The Raman spectra of our coating is explained as being composed of both the ACP and n-HA contributions, the main peak
position (Figure 5b) centered at 960 cm-1 (typical of n-HA) shows a wide shoulder centered at ca. 950 cm-1 indicating the presence of ACP. The n-HA detected by Raman data lacks the long range order necessary to be identified in the XRD measurements. Consequently, Raman and XRD results indicated that the immersion in Ringer’s solutions induces the formation of ACP, precursor of n-HA, and its transformation to n-HA, also in agreement with depth profile XPS analysis, discussed below.
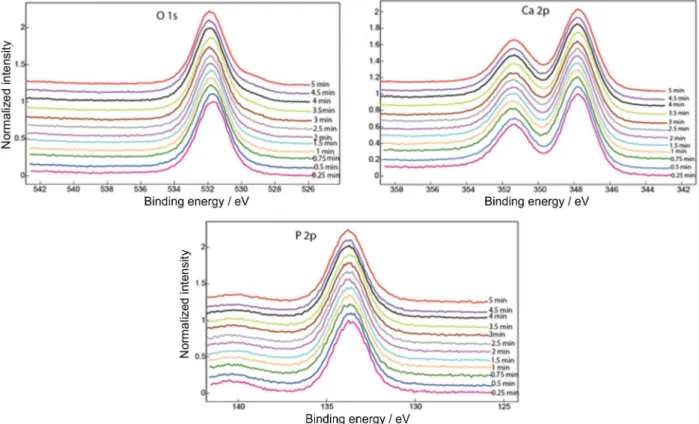
Depth profile XPS analysis of the coating formed after immersion in physiological solutions
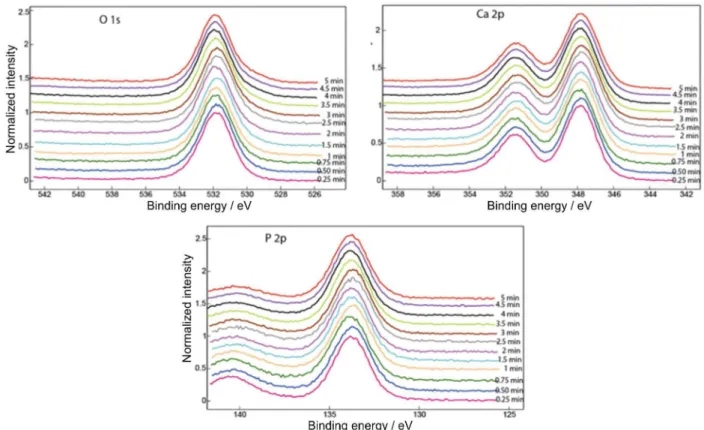
XPS was used to ascertain the Ca/P ratio of the phosphate coating in depth by gradual sputtering and depth profile analysis. Figures 6 and 7 show the superimposed XPS spectra of O 1s, Ca 2p and P 2p obtained after different Ar ion sputtering times between 15 and 300 s for the samples immersed for 300 h in Ringer’s solutions at pH 7.58 and 8.91, respectively. The binding energies37,38 (Table 3) did not change significantly in the depth profile XPS analysis from those observed in the outer surface layer (Figures 6 and 7). Cation relative concentrations for different sputtering times are summarized in Tables 4 and 5, as well as the Ca/P ratio. The Ca/P ratio at the outer layer of the coating increased from about 1.0 to 1.2 (for 15-90 s sputtering time), values between those of brushite, CaHPO4.2H2O (Ca/P ratio = 1.0) and octocalcium phosphate, Ca8H2(PO4)6.5H2O (Ca/P ratio = 1.33), to about 1.4-1.5 close to tricalcium phosphate, Ca3(PO4)2 (Ca/P ratio = 1.5) at higher sputtering times, between 120-240 s. The amorphous calcium phosphate coating tends towards a Ca/P ratio of about 1.65 that corresponds to Ca-deficient
apatite (hydroxyapatite has a Ca/P ratio of 1.67) after about 300 s sputtering. It is clear that the immersion in Ringer’s solution firstly induces the incorporation of Ca to form Ca-rich phosphates and subsequently a slow transformation of ACP into n-HA takes place. Immersion of titanium alloys in Ringer’s solution usually results in the deposition of calcium phosphate.23
It is possible to conclude that amorphous calcium phosphate with a compositional gradient of Ca/P ratio was formed during immersion in Ringer’s solutions. Raman and XRD results indicate the formation of ACP with a structure that is similar to octocalcium phosphate or nanocrystalline hydroxyapatite, while depth profile XPS shows a compositional gradient of the coating, from Ca/P ratios of 1.0-1.2 in the outer layer to about 1.5-1.6 at higher
depth, an indication that different calcium phosphates can form at the outer layer, while n-HA tends to nucleate at the inner layer, directly near the alloy surface.
The duplex ACP/n-HA coating formed after 300 h immersion in physiological solutions would transform into hydroxyapatite after implantation of the coated Ti-20Nb-10Zr-5Ta alloy.
Corrosion resistance of coated Ti-20Nb-10Zr-5Ta alloy after immersion in physiological solutions
Corrosion resistance of the coated Ti-20Nb-10Zr-5Ta alloy was obtained from cyclic potentiodynamic and linear polarization measurements39,40 and from the monitoring of Eoc39,40 and corresponding ∆Eoc.21-2319-21
Table 3. Binding energies for O 1s, Ca 2p and P 2p obtained after immersion of coated Ti-20Nb-10Zr-5Ta alloyin physiological solutions, in comparison
with those of the phosphate compounds
Solution O 1s / eV Ca 2p / eV P 2p / eV
Ringer’s pH 7.58 531.8 347.8 133.7
Ringer’s pH 8.91 531.7 347.8 133.8
Octacalcium phosphate Ca8H2(PO4)6.5H2O 531.8 347.2 133.0; 132.2; 133.8 Tricalcium phosphate Ca3(PO4)2 530.3; 531.4 347.7; 347.2 133.4; 133.8
Brushite CaHPO4.2H2O 531.5 347.2 133.7
Hydroxyapatite Ca5(PO4)3(OH) 531.9 347.2; 347.6 133.2; 133.5
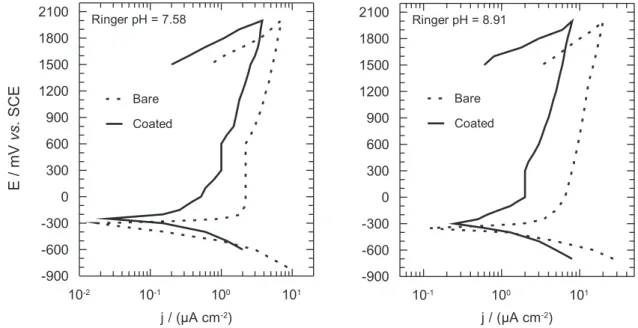
Cyclic potentiodynamic polarization curves (Figure 8) showed that both the bare and coated alloy directly translated from the Tafel region to stable passive state without active-passive transition region, namely, both materials exhibit self-passivation.41,42 The passive potential range (of the constant current density) is very large, over 2000 mV (the maximum limit in our experiments), denoting a very stable, passive and protective state. The current
density in the passive potential range is lower for the coated alloy that indicates a more protective layer than that of the bare alloy. Corrosion potential has nobler values for the coated alloy due to the beneficial influence of the applied coating that acts as a barrier against the dissolution of the substrate. At low potentials (up to ca. −100 mV), it is
under activation control and then, at more electropositive potentials, a passive behavior is observed.41,42 The coated
Figure 7. Superimposed XPS spectra of coated Ti-20Nb-10Zr-5Ta alloy surface after different Ar ion sputtering times (15-300 s) and after 300 h of immersion in Ringer’s solution at pH 8.91.
Table 4. Cation relative concentrations of coating on Ti-20Nb-10Zr-5Ta alloy surface after different Ar ion sputtering times and after 300 h of immersion in Ringer’s solution at pH 7.58
Sputtering time / s
Cation relative concentration / %
C O P Ca Ca/P
15 16.94 62.48 9.65 10.93 1.1326
30 8.32 62.38 13.38 15.92 1.1898
45 8.71 65.00 11.87 14.42 1.2148
60 5.36 65.01 13.52 16.11 1.1916
90 5.77 68.40 10.97 14.86 1.3546
120 4.70 64.48 12.00 18.82 1.5683
150 3.93 68.10 10.24 17.73 1.7314
180 3.03 63.13 12.96 20.88 1.6111
210 3.31 65.52 12.79 18.38 1.4371
240 3.57 65.21 12.17 19.05 1.5653
270 3.12 66.09 11.98 18.81 1.5701
300 2.60 67.47 11.27 18.66 1.6557
Table 5. Cation relative concentrations of coating on Ti-20Nb-10Zr-5Ta alloy surface after different Ar ion sputtering times and after 300 h of immersion in Ringer’s solution at pH 8.91
Sputtering time / s
Cation relative concentration / %
C O P Ca Ca/P
15 11.35 64.25 12.85 11.55 0.8988
30 5.82 64.49 14.16 13.53 1.0929
45 2.59 71.79 12.38 13.24 1.0695
60 1.83 64.23 19.01 14.93 0.7854
90 1.91 70.56 12.43 15.10 1.2148
120 1.63 68.29 13.29 16.79 1.2634
150 1.03 69.99 12.40 15.58 1.3371
180 1.61 69.27 15.11 14.01 0.9272
210 1.46 67.23 13.34 17.97 1.3471
240 1.44 68.42 12.99 17.33 1.3341
270 1.13 67.26 12.42 19.19 1.5451
alloy revealed a nobler electrochemical behavior than that for the bare one due to the protective effect of the electrodeposited coating.
The Rp values (Table 6) were higher for the coated alloy than for the bare one, revealing more resistant and protective films. For the coated alloy, the Rp values increased in time indicating the thickening of the oxide layer as result of the depositions from the solutions.43-49 On the contrary, the Rp value for the bare alloy decreased in time, showing the lower corrosion resistance due to the less protective character of its passive film.43-47
Open circuit potentials for the coated Ti-20Nb-10Zr-5Ta alloy had more electropositive values than those for the
bare one as a result of the protective influence of the electrodeposited film. Open circuit potentials tended to more electropositive values in time (Figure 9) due to the new depositions from the physiological fluids.49 The most electropositive values were registered in neutral Ringer’s solution, the usual functional conditions of the implants. In alkaline Ringer’s solution, these potentials had slowly more electronegative values because of the slightly higher aggressiveness of this solution. However, all open circuit potentials remained around −100 ÷ −150 mV, values placed
on the Pourbaix diagrams50 in the passive potential range both for Ti, Nb, Zr and Ta, attesting that the treated alloy presented a stable passive state51 on the whole studied pH range because the beneficial influence of the electrodeposited film and of the new depositions from the Ringer’s solutions.
∆E
oc(pH) showed very low values (between 5 and 170 mV, in absolute value) (Table 7) due to the non-uniformity of the physiological solution pH values, unable to cause galvanic or local corrosion. This is because only differences of 600-700 mV can generate these types of local corrosion.52-54
Figure 8. Potentiodynamic polarization curvesfor coated Ti-20Nb-10Zr-5Ta alloy in physiological solutions at different pH values at 37 oC.
Table 6. Polarization resistances (Rp) for bare and coated Ti-20Nb-10Zr-5Ta alloy in physiological solutions at different pH values at 37 oC
Solution pH Alloy time / h Rp / (kΩ cm2)
7.58 bare 24 24.1
100 23.5
300 22.5
coated 24 190.2
100 290.4
300 310.1
8.91 bare 24 19.2
100 16.3
300 17.3
coated 24 170.2
100 257.3
300 270.6
Table 7. Open circuit potential gradients (∆Eoc) for bare and coated Ti-20Nb-10Zr-5Ta alloy
Alloy time / h ∆Eoc / mV
Bare 24 −170.0
100 −13.0
300 +5.0
Coated 24 +81.0
100 +26.5
Conclusions
The anodic galvanostatic electrodeposition method (in 1 mol L-1 orthophosphoric acid) was applied on the new Ti-20Nb-10Zr-5Ta alloy surface and a film containing amorphous titanium dioxide and phosphate ions was obtained, confirmed by Raman and FTIR analyses. AFM micrographs showed that the electrodeposited film had a porous microstructure and good roughness. The coated Ti-20Nb-10Zr-5Ta alloy revealed a nobler electrochemical behavior and higher corrosion resistance in neutral and alkaline Ringer’s solutions than those of the bare alloy. This is due to the better protective properties of the electrodeposited film. For the coated alloy, the Rp values increased in time, indicating the thickening of the surface film due to the depositions from the solutions. Open circuit potentials tended to more electropositive values over time as result of the deposition of new layers from the physiological fluids. Raman and depth profile XPS spectra indicated that the coating deposited over time had a variable composition: at the inner layer nucleated nanocrystalline hydroxyapatite (n-HA) and at the outer layer amorphous calcium phosphate (ACP) was deposited. This duplex ACP/n-HA coating would transform in HA after implantation of the coated Ti-20Nb-10Zr-5Ta alloy.
Acknowledgments
T h i s w o r k w a s s u p p o r t e d b y R o m a n i a n CNCSIS-UEFISCDI, project number PN II-IDEI code 248/2010. Also, support of the EU (ERDF) and Romanian Government infrastructure POS-CCE O 2.2.1 project INFRANANOCHEM No. 19/2009 is gratefully acknowledged.
References
1. Kokubo, T.; Matsushita, T.; Takadama, H.; Kizuki, T.; J. Eur. Ceram. Soc.2009, 29, 1267.
2. Pelaez-Abellan, E.; Rocha-Sousa, L.; Muller, W. D.; Guastaldi, A. C. X.; Corros. Sci.2007, 49, 1645.
3. Narayanan, R.; Seshadri, S. K.; Corros. Sci.2007, 49, 542. 4. Shibata, Y.; Suzuki, D.; Omori, S.; Tanaka, R.; Murakami, A.;
Kataoka, Y.; Baba, K.; Kamijo, R.; Biomaterials2010, 31, 8546. 5. Saji, V. S.; Choe, H. C.; Corros. Sci.2009, 51, 1658. 6. Oliva, F. Y.; Avalle, L. B.; Camara, O. R.; J. Electroanal. Chem.
2002, 534, 19.
7. Park, H. H.; Park, I. S.; Kim, K. S.; Jeon, W. Y.; Park, B. K.; Kim, H. S.; Bae, T. S.; Lee, M. H.; Electrochim. Acta2010, 55, 6109. 8. Fahim, N. F.; Morks, M. F.; Sekino, T.; Electrochim. Acta2009,
54, 3255.
9. Li, D. H.; Lin, J.; Lin, D. Y.; Wang, X. X.; J. Mater. Sci.: Mater. Med. 2011, 22, 1205.
10. Kokubo, T.; Ito, S.; Huang, Z. T.; Hayashi, T.; Sakka, S.; Kitsugi, T.; Yamamuro, T.; J. Biomed. Mater. Res.1990, 24, 331. 11. Drevet, R.; Velard, F.; Potiron, S.; Laurent-Maquin, D.;
Benhayoune, H.; J. Mater. Sci.: Mater. Med.2011, 22, 753. 12. Vasilescu, C.; Drob, P.; Vasilescu, E.; Demetrescu, I.; Ionita, D.;
Prodana, M.; Drob, S. I.; Corros. Sci.2011, 53, 992.
13. Hassan, F. M. B.; Nanjo, H.; Venkatachalam, S.; Kanakubo, M.; Ebina, T.; Electrochim. Acta2010, 55, 3130.
14. Mirza Rosca, J. C.; Popa, M. V.; Vasilescu, E.; Drob, P.; Vasilescu, C.; Drob, S. I.; Rev. Roum. Chim.2010, 55, 639. 15. Habazaki, H.; Teraoka, M.; Aoki, Y.; Skeldon, P.; Thompson,
G. E.; Electrochim. Acta2010, 55, 3939.
16. Dey, T.; Roy, P.; Fabry, B.; Schmuki, P.; Acta Biomater.2011, 7, 1873.
17. Trudnowski, R. J.; J. Am. Med. Assoc.1966, 195, 545. 18. Roth, E.; Lax, L. C.; Maloney, J. V.; Ann. Surg.1969, 169, 149. 19. Cai, Z.; Nakajima, H.; Woldu, M.; Berglund, A.; Bergman, M.;
Okabe, T.; Biomaterials1999, 20, 183. 20. Van Noort, R.; J. Mater. Sci.1987, 22, 3801.
21. Popa, M. V.; Demetrescu, I.; Vasilescu, E.; Drob, P.; Lopez, A. S.; Mirza-Rosca, J.; Vasilescu, C.; Ionita, D.; Electrochim. Acta2004, 49, 2113.
22. Vasilescu, E.; Drob, P.; Raducanu, D.; Cojocaru, V. D.; Cinca, I.; Iordachescu, D.; Ion, R.; Popa, M.; Vasilescu, C.; J. Mater. Sci.: Mater. Med.2010,21, 1959.
23. Vasilescu, E.; Drob, P.; Raducanu, D.; Cinca, I.; Mareci, D.; Calderon Moreno, J. M.; Popa, M.; Vasilescu, C.; Rosca, J. C. M.; Corros. Sci.2009,51, 2885.
24. Nelis, D.; Calderon-Moreno, J. M.; Popa, M.; van Bael, M. K.; Mullens, J.; van Poucke, L. C.; J. Eur. Ceram. Soc.2006,26, 409.
25. Masui, T.; Hirai, H.; Imanaka, N.; Adachi, G.; J. Alloys Compd.
2006,408-412, 1141.
26. McConnell, A. A.; Aderson, J. S.; Rao, C. N. R.; Spectrochim. Acta, Part A1976, 1067.
27. De Aza, P. N.; Santos, C.; Paza, A.; De Aza, S.; Cusco, L.; Artus, R.; Chem. Mater.1997,9, 912.
28. Rehman, I.; Bonfield, W.; J. Mater. Sci.: Mater. Med.1997,8, 1. 29. Nelson, D. G. A.; Featherstone, J. D. B.; Calcif. Tissue Int.1982,
34, S69.
30. Feki, H. E.; Rey, C.; Vignoles, M.; Calcif. Tissue Int. 1991,49, 269.
31. Vasilescu, C.; Drob, S. I.; Neacsu, E. I.; Mirza Rosca, J. C.; Corros. Sci. 2012,65, 431.
32. Frost, R. L.; Xi, Y.; Pogson, R. E.; Millar, G. J.; Tan, K.; Palmer, S. J.; J. Raman Spectrosc.2012,43, 571.
34. Popa, M. V.; Calderon-Moreno, J. M; Popa, M.; Vasilescu, E.; Drob, P.; Vasilescu, C.; Drob, S. I.; Surf. Coat. Technol.2011,
205, 4776.
35. Fowler, B. O.; Markovic, M.; Brown, W. E.; Chem. Mater.1993,
5, 1417.
36. Tsuji, T.; Onuma, K.; Yamamoto, A.; Iijima, M.; Shiba, K.; PNAS2008, 105, 16866.
37. Moulder, J. F.; Stickle, W. F.; Sobol, P. E.; Bomben, K. D.; Handbook of X-ray Photoelectron Spectroscopy; Physical Electronics, Inc.: Chamhassen, USA, 1995.
38. Naumkin, A. V.; Kraut-Vass, A.; Gaarenstroom, S. W.; Powell, C. J.; NIST X-ray Photoelectron Spectroscopy Database. NIST Standard Reference Database 20, version 4.1.;U. S. Secretary of Commerce on behalf of the United States of America: USA, 2012.
39. Melo, R. L.; Casciano, P. N. S.; Correia, A. N.; de Lima-Neto, P.; J. Braz. Chem. Soc. 2012, 23, 328.
40. Serra, G. C.; Benedetti, A. V.; Noce, R. D.; J. Braz. Chem. Soc.
2010, 21, 1530.
41. Mareci, D.; Chelariu, R.; Gordin, D. M.; Ungureanu, G.; Gloriant, T.; Acta Biomater.2009, 5, 3625.
42. Branzoi, V.; Iordoc, M.; Branzoi, F.; Sbarcea, G.; Marinescu, V.; Rev. Roum. Chim.2010, 55, 585.
43. Martins, J. I.; Diblikova, L.; Bazzaoui, M.; Nunes, M. C.; J. Braz. Chem. Soc. 2012, 23, 377.
44. Shukla, A. K.; Balasubramaniam, R.; Corros. Sci.2006, 48, 1696.
45. Hodgson, A. W. E.; Mueller, Y.; Forster, D.; Virtanen, S.; Electrochim. Acta2002, 47, 1913.
46. Camara, O. R.; Avalle, L. B.; Oliva, F. Y.; Electrochim. Acta
2010, 55, 4519.
47. Duarte, L. T.; Biaggio, S. R.; Rocha-Filho, R. C.; Bocchi, N.; J. Mater. Sci.: Mater. Med.2011, 22, 1663.
48. Black, J.; Biological Performance of Materials: Fundamentals of Biocompatibility; M. Decker Inc. New York, USA, 1992. 49. Blackwood, D. J.; Chua, A. W. C.; Seah, K. H. W.; Thampuran,
R.; Teoh, S. H.; Corros. Sci.2000, 42, 481.
50. Pourbaix, M.; Atlas of Electrochemical Equilibria in Aqueous Solutions; NACE: Houston, USA, 1974.
51. Mohsen, Q.; Fadl-Allah, S. A.; Mater. Corros.2011, 62, 310. 52. Blasco-Tamarit E.; Igual-Munoz, A.; Garcia Anton, J.;
Garcia-Garcia, D. M.; Corros. Sci.2009, 51, 1095.
53. Sheela, G.; Ramasamy, M.; Rao, C. R. K.; Pushpavanam, M.; Bull. Electrochem. 2011, 17, 347.
54. Sola, C.; Amorim, A.; Espias, A.; Capelo, S.; Fernandes, J.; Proenca, L.; Sanchez L.; Fonseca, I.; Int. J. Electrochem. Sci.
2013, 8, 406.
Submitted: February 6, 2013