Full paper published online: August 31, 2006 ISSN 1678-9199.
ECONOMIC EVALUATION OF SNAKE ANTIVENOM PRODUCTION IN THE
PUBLIC SYSTEM
MORAISV. (1), MASSALDIH. (1)
(1) Departamento de Desarrollo Biotecnológico y Producción, Instituto de Higiene, Facultad de Medicina, Universidad de la República, Montevideo, Uruguay.
ABSTRACT: Snake antivenom, an expensive animal product, is presently the only effective treatment for the consequences of snakebite. In Latin America, antivenoms are mainly produced by public institutions with frequent shortages of the necessary supply. Here, we present an economical analysis of the factors affecting production cost, assuming a basic processing batch of 100 L hyperimmune plasma. Three annual production volumes were considered for two typical production technologies. The components of cost were classified as fixed, variable and semi-variable. We found that in all stages of production, fixed cost represents the major contribution to total cost, and is given essentially by manpower cost, particularly for low production volumes. Our estimation shows that antivenom cost can vary from US$ 2.4 to US$ 25 per 10 mL vial, depending on the production volume, the plasma processing technology used and the titer achieved during the immunization stage. We conclude that interested laboratories and authorities of countries with population at risk should consider the possibility of a joint production to improve the process efficiency, lower the product unitary cost and obtain the necessary supply for their own demand or that of other countries in need.
KEY WORDS: antivenom, economical cost, immunoglobulins, equine plasma, serum production.
CORRESPONDENCE TO:
HUGO MASSALDI, Av. A. Navarro 3051, 11600 Montevideo, Uruguay. Phone: (598-2) 487-1288 int 1122. Fax: (598-(598-2) 487-3073.
INTRODUCTION
Snake antivenom is a kind of therapeutic serum which at present constitutes the only effective product to treat the consequences of snakebite, a serious public health problem in many tropical and subtropical countries. Antivenom production is a biotechnological process that involves the use of animal blood as raw material, which is processed and purified before obtaining the final product. Few companies are interested in producing snake antivenoms (20, 21). In Latin America, production is carried out essentially by nonprofit, public institutions (3, 8, 17), whose capacity is generally limited to the country requirements, with little or no surplus (10, 22). This situation has left several non-producing countries deprived of the possibility of acquiring the product (2, 5, 12). In addition, with the incorporation of new quality requirements and new technologies, the cost per dose of snake antivenom has increased considerably in the last years (5, 9).
For the above reasons we considered interesting to gain insight into the components of the production cost in order to achieve better economic control and optimization of public resources and, therefore, to evaluate the possibility of increasing production within reasonable economic limits. In this paper we make an economical analysis of snake antivenom production, focusing on the individual components and their contribution to the overall cost. We applied this analysis to model production cases that can be assimilated to different demands and productive capacities of countries from the Latin American region, but it could be readily extrapolated to other developing countries as well.
MATERIALS AND METHODS
Snake Antivenom Production
stage, the plasma is transported to the processing plant where it is treated to extract and purify the antibody fraction to obtain the final product. Quality control actions according to recommendations of the World Health Organization [WHO] (23) or different pharmacopoeias (6, 1) are included in this stage. Also, for the whole system, availability of mice and guinea pigs is needed to carry out the activities of quality control (11) and snake feeding.
Theory and Calculation
1. Economic parameters of antivenom production
We restrict our analysis to nonprofit, public institutions, so the cost analysis is the main tool for determination of the product price. The unitary cost of snake antivenom is the cost per ampoule or vial: CA = $/vial; so the annual cost, CT,can be written as:
CT = CA * vials produced/year (I).
However, for a given processing volume of plasma, the effective number of vials obtained depends on the overall yield and on the final immunization titer. So, it is convenient to express equation (I) in terms of the number of batches per year, where a batch is defined as the maximum plasma volume treated in one processing cycle. The batch depends only on the equipment processing capacity and not on the plasma characteristics or the purification process efficiency. Thus, from equation (I), by substituting:
No. vials produced/year = No. vials produced/batch * No. batches/year = NVB * NB
It results:
CA = CT / (NVB * NB) (II);
NVB = VB / VV * Tfi / Tmi * Ra (III);
where VB is the batch processing volume and VV is the volume of each vial. Equations (II) and (III) show that NVB is higher, and therefore CA is lower, when Tfi and/or Ra are higher.
2. Components of costs for each production stage
Conventionally, two types of costs are considered in any economic analysis of production: fixed costs (CF) and variable costs (CV). CV varies directly in proportion to the volume of production in a given period of time. CF is independent of fluctuations in the production volume and should remain constant within a wide range of production values. However, it should be taken into account that the fixed costs cannot remain constant if the production volume increases above the production system capacity. This may happen because of having reached either the maximum capacity of the available equipment or the maximum frequency of processing cycles. In addition to these types, there are costs that have a fixed root and a variable component. These may be called semi-variable costs and we denoted them as CSV. The total production annual cost, CT, is equal to the sum of all of them:
CT = CF +CV + CSV (IV).
The cost components for each production stage are shown in Table 1 on an annual basis. The calculation indexes and the economic values derived from them, presented in the subsequent Tables, are assumed to be representative, with expected local variations of the prevailing conditions in Latin American countries. We assume that, in all cases, the equipment, processes and installations comply with the requirements of good manufacturing practices.
explained earlier, the variable costs were expressed in terms of number of batches per year, NB. Also, installation and equipment maintenance, considered as a semi-variable cost, was expressed as partly dependent on NB.
We compared the costs involved in two widely accepted methods of antivenom production: peptic digestion of whole plasma plus ammonium sulphate purification, with F(ab’)2 fragment as product (7, 14), and caprylic acid extraction together with purification of whole immunoglobulins (18). In both cases, the final product is in liquid form. These processes differed essentially in the percent recovery of active antibodies, which is in the order of 30% for the F(ab’)2 product (15) and about 60% for whole purified immunoglobulins (18). We also applied the analysis for two possible final immunization titers of hyperimmune plasma and three qualitatively different batch-processing volumes. For modeling purposes, we assumed 100 L as the maximum processing volume of plasma per campaign (basic plasma processing batch). For processing volumes above 100 L per year, the production demand is fulfilled by repeating the plasma treating process with the basic batch as many times as needed or possible within the period (e.g. for 1,000 L / year, 10 cycles).
RESULTS
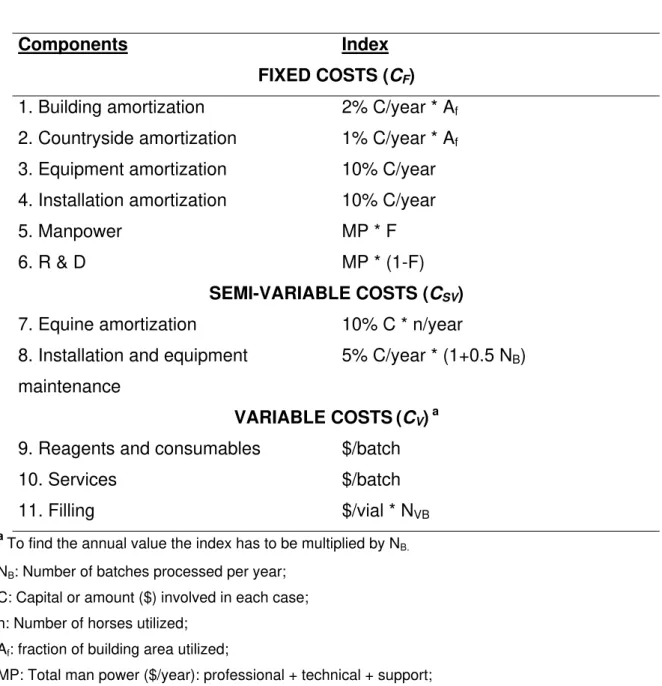
Table 1: Cost components of snake antivenom production.
Components Index
FIXED COSTS (CF)
1. Building amortization 2% C/year * Af
2. Countryside amortization 1% C/year * Af
3. Equipment amortization 10% C/year
4. Installation amortization 10% C/year
5. Manpower MP * F
6. R & D MP * (1-F)
SEMI-VARIABLE COSTS (CSV)
7. Equine amortization 10% C * n/year
8. Installation and equipment maintenance
5% C/year * (1+0.5 NB)
VARIABLE COSTS(CV) a
9. Reagents and consumables $/batch
10. Services $/batch
11. Filling $/vial * NVB
a To find the annual value the index has to be multiplied by N
B.
NB: Number of batches processed per year; B C: Capital or amount ($) involved in each case; n: Number of horses utilized;
Af: fraction of building area utilized;
MP: Total man power ($/year): professional + technical + support; F: fraction of time devoted to production;
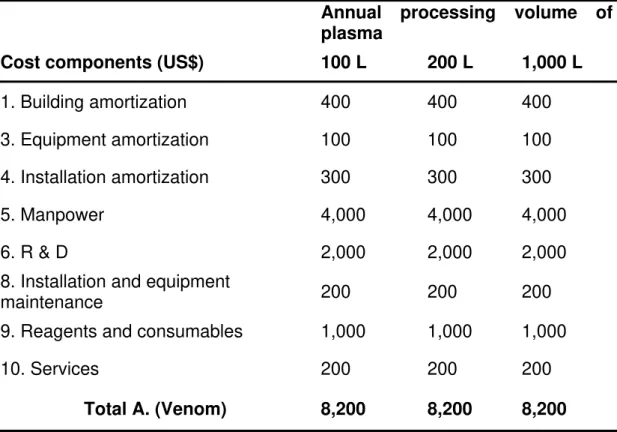
Table 2: Costs associated to the first stage of antivenom production: A. Venom preparation.
Annual processing volume of plasma
Cost components (US$) 100 L 200 L 1,000 L
1. Building amortization 400 400 400
3. Equipment amortization 100 100 100
4. Installation amortization 300 300 300
5. Manpower 4,000 4,000 4,000
6. R & D 2,000 2,000 2,000
8. Installation and equipment
maintenance 200 200 200
9. Reagents and consumables 1,000 1,000 1,000
10. Services 200 200 200
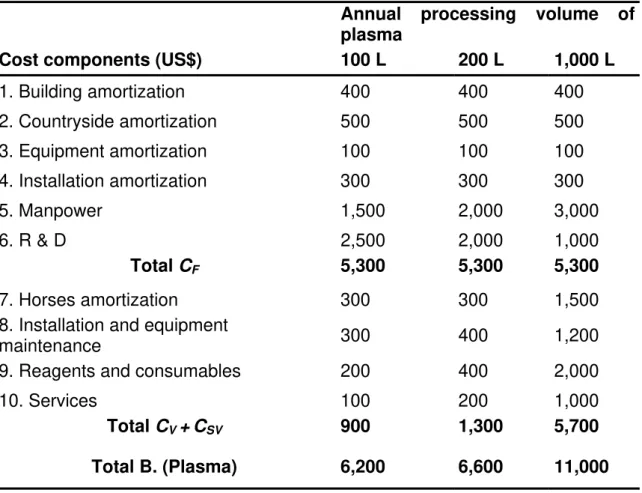
Table 3:Costs associated to the second stage of antivenom production: B. Hyperimmune plasma obtainment.
Annual processing volume of plasma
Cost components (US$) 100 L 200 L 1,000 L
1. Building amortization 400 400 400
2. Countryside amortization 500 500 500
3. Equipment amortization 100 100 100
4. Installation amortization 300 300 300
5. Manpower 1,500 2,000 3,000
6. R & D 2,500 2,000 1,000
Total CF 5,300 5,300 5,300
7. Horses amortization 300 300 1,500
8. Installation and equipment
maintenance 300 400 1,200
9. Reagents and consumables 200 400 2,000
10. Services 100 200 1,000
Total CV + CSV 900 1,300 5,700
Table 4: Costs associated to the third stage of snake antivenom production:
C. Antivenom production; total cost and unitary cost. Overall process activity yield as F(ab’)2: 30%.
Annual processing volume of plasma
Cost components (US$) 100 L 200 L 1,000 L
I - Final immunization titer: 0.5 x Tmi
1. Building amortization 400 400 400
3. Equipment amortization 3,000 3,000 3,000
4. Installation amortization 3,000 3,000 3,000
5. Manpower 500 1,000 4,000
6. R & D 5,500 5,000 2,000
Total CF 12,400 12,400 12,400
8. Installation and equipment
maintenance 4,500 6,000 12,000
9. Reagents and consumables 3,000 6,000 30,000
10. Services 1,000 2,000 10,000
11. Filling 1,500 3,000 15,000
Total CV + CSV 10,000 17,000 67,000
Total C. (Antivenom) 22,400 29,400 79,400
Total A. (Venom) a 8,200 8,200 8,200
Total B. (Plasma)b 6,200 6,600 11,000
Overall Total (A.+B.+C.) 36,800 44,200 98,600
No. vials 10 mL 1,500 3,000 15,000
Cost per vial 24.5 14.7 6.6
II - Final immunization Titer: 1.0 x Tmi
11. Filling 3,000 6,000 30,000
Total CV + CSV 11,500 20,000 82,000
Total C. (Antivenom) 23,900 32,400 94,400
Total A. (Venom) a 8,200 8,200 8,200
Total B. (Plasma)b 6,200 6,600 11,000
Overall Total (A.+B.+C.) 38,300 47,200 113,600
No. vials 10 mL 3,000 6,000 30,000
Cost per vial 12.8 7.9 3.8
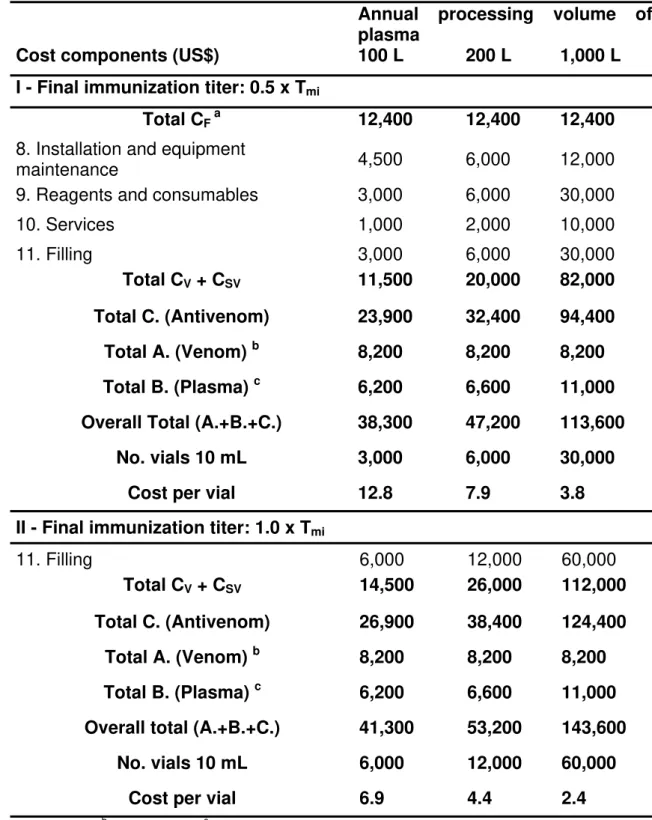
Table 5: Costs associated to the third stage of snake antivenom production:
C. Antivenom production; total cost and unitary cost. Overall process activity yield as IgG: 60%.
Annual processing volume of plasma
Cost components (US$) 100 L 200 L 1,000 L
I - Final immunization titer: 0.5 x Tmi
Total CF a 12,400 12,400 12,400
8. Installation and equipment
maintenance 4,500 6,000 12,000
9. Reagents and consumables 3,000 6,000 30,000
10. Services 1,000 2,000 10,000
11. Filling 3,000 6,000 30,000
Total CV + CSV 11,500 20,000 82,000
Total C. (Antivenom) 23,900 32,400 94,400
Total A. (Venom) b 8,200 8,200 8,200
Total B. (Plasma) c 6,200 6,600 11,000
Overall Total (A.+B.+C.) 38,300 47,200 113,600
No. vials 10 mL 3,000 6,000 30,000
Cost per vial 12.8 7.9 3.8
II - Final immunization titer: 1.0 x Tmi
11. Filling 6,000 12,000 60,000
Total CV + CSV 14,500 26,000 112,000
Total C. (Antivenom) 26,900 38,400 124,400
Total A. (Venom) b 8,200 8,200 8,200
Total B. (Plasma) c 6,200 6,600 11,000
Overall total (A.+B.+C.) 41,300 53,200 143,600
No. vials 10 mL 6,000 12,000 60,000
Cost per vial 6.9 4.4 2.4
DISCUSSION
According to Table 2 (A. Venom preparation), there is no discrimination between costs in terms of fixed or variable, and the components are independent of the production volume. This happens because the snake population is high enough to support the annual provision of venom for large production volumes; therefore, stage A. behaves as a fixed cost for the whole production process.
Table 3 (B. Hyperimmune plasma) shows that the cost increases only slightly for production volumes between 100 and 200 L, but it becomes much higher at 1,000 L. This reflects the possibility of using the same group of horses to obtain 100 or 200 L plasma per year by performing two annual immunizations in the 200 L case. However, to obtain 1,000 L plasma with two annual immunizations it is necessary to increase the number of horses by about five. Similarly, maintenance cost increases with the production volume but not in direct proportion. This is due to the formula indicated in Table 1, which reflects the existence of a maintenance cost, even without production (NB = 0), plus a term that depends on the annual usage of the equipment and installations. It is also noticeable the strong contribution of maintenance (frequently neglected or underestimated in institutional budgets) to the total cost. The costs of consumables, services and filling are clearly variable. We assumed that filling is carried out in installations outside the producing institution, which is more convenient for laboratories of relatively low production volumes. The single annual batch of 100 L approaches the situation prevailing in Uruguay, where the health system demand due to snakebite accidents is very limited. For Uruguay, a typical dose is made of 4-8 vials, with each vial neutralizing 25 mg of Bothrops alternatus venom, similar to that used by other countries of the region like Argentina and Brazil (16). In some countries, the dose administered to the patient is only one 10-mL vial (5), which is a consequence of the scarcity and high cost of the antivenom rather than a therapeutic rationale.
increased by the repeated use of the same equipment in different cycles, thereby increasing the number of processed batches per year. A possible alternative analysis to cover a large increase in production would consider the use of large-scale equipment and technology, in which the corresponding fixed costs would increase accordingly, particularly in stage C. Of course, this is unavoidable if the situation requires processing batches of 1,000 L to fulfill an annual demand 10 times higher, as would be the case of some tropical countries with high incidence of snakebite accidents. In this situation, it would be possible to carry out a cost analysis similar to that presented here, which at least qualitatively should provide similar relationships between cost components. In any case, from a technological point of view, a quantitative aspect to be emphasized is the direct increase of the effective number of vials produced and, concomitantly, the reduction of the cost per vial – see equation (II) – which can be determined by using a highly efficient plasma process and/or a good final immunization titer.
We conclude that for snake antivenom production, the large contribution of the fixed costs to the total cost makes it convenient, whenever possible, to increase the number of vials (doses) produced per year within the same facility and technology. Since many producing countries only yield the necessary number of doses to cover the country requirements, their production systems are idle during more or less extensive periods, which causes an augment of the unitary cost. One alternative to overcome this problem is that interested laboratories consider the possibility of establishing a joint production facility to serve the necessities of the group and, eventually, those of other countries in need of antivenom and outside the region.
ACKNOWLEDGEMENTS
The financial support of CSIC, Uruguay, is gratefully acknowledged.
H. A. Massaldi is a member of the research career of CONICET, Argentina.
REFERENCES
1 BIOLOGICS. In: THE UNITED STATE PHARMACOPEIA. 24.ed. Rockville: USP, 1999. p. 2011.
3 CHIPPAUX JP., GOYFFON M. Venoms, antivenoms and inmunotherapy. Toxicon, 1998, 36, 823-46.
4 CHIPPAUX JP., WILLIAMS V., WHITE J. Snake venom variability: methods of study, results and interpretation. Toxicon, 1998, 29, 1279-1303.
5 EINTERNZ EM., BATES ME. Snakebite in northern Cameroon: 134 victims of bites by the saw-scaled or carpet viper, Echis ocellatus. Trans. Rev. Soc.
Trop. Med. Hyg., 2003, 97, 693-6.
6 EUROPEAN VIPER VENOM ANTISERUM. In: EUROPEAN PHARMACOPEIA.
1997. p. 1712-13.
7 HARMS AJ. The purification of antitoxic plasmas by enzyme treatment and heat denaturation. Biochem. J., 1948, 42, 390-7.
8 JADHAV SS., KAPRE SV. Antivenom production in India. Handbook of natural
toxins, 5, Reptil and anphibian venoms. New York: Marcel Dekker, 1991: 584-608.
9 KRIFI MN., EL AYEB M., DELLAGI K. The improvement and standardization of antivenom production in developing countries; comparing antivenom quality, therapeutical efficiency, and cost. J. Venom. Anim. Toxins, 1999, 5, 128-41. 10 LAING GD., RENJIFO JM., RUIZ F., HARRISON RA., NASIDI A., GUTIERREZ
JM., ROWLEY PD., WARRELL DA., THEAKSTON RGD. A new Pan African polyspecific antivenom developed in response to the antivenom crisis in Africa. Toxicon, 2003, 42, 35-41.
11 LAING GD., YARLEQUE A., MARCELO A., RODRIGUEZ E., WARRELL DA., THEAKSTON RDG. Preclinical testing of three South American antivenoms against the venoms of five medically-important Peruvian snake venoms.
Toxicon, 2004, 44, 103-6.
12 MCNAMEE D. Tackling venomous snake bites worldwide. Lancet, 2001, 357, 680.
14 MORAIS JF., DE FREITAS MCW., YAMAGUCHI IK., DOS SANTOS MC., DA SILVA WD. Snake antivenoms from hyperimmunized horses: comparison of the antivenom activity and biological properties of their whole IgG and F(ab’)2 fragments. Toxicon, 1994, 32, 725-34.
15 MORAIS VM., MASSALDI HA. Effect of pepsin digestion on the activity of equine immunoglobulins. Toxicon, 2005, 46, 876-82.
16 PINHO FMO., PEREIRA ID. Ofidismo. Rev. Bras. Ass. Med., 2001, 47, 24-9. 17 RAW I., GUIDOLIN R., HIGASHI H., KELEN E. Antivenins in Brazil: Preparation.
Handbook of natural toxins, 5, Reptil and anphibian venoms. New York:
Marcel Dekker, 1991: 557–83.
18 ROJAS G., JIMENEZ JM., GUTIERREZ JM. Caprylic acid fractionation of hyperimmune horse plasma: description of a simple procedure for antivenom production. Toxicon, 1994, 32, 351-63.
19 SJOSTROM L., AL-ABDULLA I., RAWAT S., SMITH D., LANDON J. A comparison of ovine and equine antivenoms. Toxicon, 1994, 32, 427-33.
20 THEAKSTON RDG., WARRELL DA., GRIFFITHS E. Report of a WHO workshop on the standardization and control of antivenoms. Toxicon, 2003, 41, 541-57. 21 VISSER LE., KYEI-FARIED S., BELCHER DW. Protocol and monitoring to
improve snake bite outcomes in rural Ghana. Trans. R. Soc. Trop. Med. Hyg., 2004, 98, 278-83.
22 WILDE H., THIPKONG P., SITPRIJA V., CHAIYABUTR N. Heterologous antisera and antivenins are essential biologicals. Ann. Intern. Med., 1996, 125, 233-6. 23 WORLD HEALTH ORGANIZATION. Progress in the characterization and