THE COMBINED USE OF REFLECTANCE, EMISSIVITY
AND ELEVATION ASTER/TERRA DATA FOR TROPICAL
SOIL STUDIES
(1)Fábio Marcelo Breunig(2), Lênio Soares Galvão(3), Antonio Roberto Formaggio(3) & Eduardo Guimarães Couto(4)
SUMMARY
Reflectance, emissivity and elevation data of the sensor ASTER (Advanced Spaceborne Thermal Emission and Reflection Radiometer)/Terra were used to characterize soil composition variations according to the toposequence position. Normalized data of SWIR (shortwave infrared) reflectance and TIR (thermal infrared) emissivity, coupled to a soil-fraction image from a spectral mixture model, were evaluated to separate bare soils from nonphotosynthetic vegetation. Regression relationships of some soil properties with reflectance and emissivity data were then applied on the exposed soil pixels. The resulting estimated values were plotted on the ASTER-derived digital elevation model. Results showed that the SWIR bands 5 and 6 and the TIR bands 10 and 14 measured the clay mineral absorption band and the quartz emissivity feature, respectively. These bands improved also the discrimination between nonphotosynthetic vegetation and soils. Despite the differences in pixel size and field sampling size, some soil properties were correlated with reflectance (R2 of 0.65 for Al
2O3 in band 6; 0.61 for Fe2O3 in
band 3) and emissivity (R2 of 0.65 for total sand fraction in the 10/14 band ratio).
The combined use of reflectance, emissivity and elevation data revealed variations in soil composition with topography in specific parts of the landscape. From higher to lower slope positions, a general decrease in Al2O3 and increase in total sand
fraction was observed, due to the prevalence of Rhodic Acrustox at the top and its gradual transition to Typic Acrustox at the bottom.
Index terms: digital elevation model, soil constituents, remote sensing, topography.
(1) Recebido para publicação em maio de 2008 e aprovado em setembro de 2009.
(2) Doutorando do Instituto Nacional de Pesquisas Espaciais – INPE. Divisão de Sensoriamento Remoto, Av. dos Astronau-tas 1758, Caixa Postal 515, CEP 12201-970 São José dos Campos (SP). E-mail: [email protected]
(3) Professor, Instituto Nacional de Pesquisas Espaciais, INPE. E-mails: [email protected]; [email protected]
RESUMO: USO COMBINADO DE DADOS DE REFLECTÂNCIA, EMISSIVIDADE E ELEVAÇÃO DO ASTER/TERRA PARA ESTUDO DE SOLOS TROPICAIS
Dados de reflectância, emissividade e elevação do sensor ASTER (Advanced Spaceborne Thermal Emission and Reflection Radiometer)/Terra foram usados para caracterizar variações na composição dos solos com a posição em topossequências. Dados normalizados de reflectância do SWIR (shortwave infrared) e de emissividade do TIR (thermal infrared), integrados com a imagem fração-solo de um modelo de mistura espectral, foram avaliados para separar solos expostos de vegetação não fotossinteticamente ativa. Relações de regressão de alguns atributos dos solos com dados de reflectância e emissividade foram aplicadas sobre os pixels de solos expostos. Os valores estimados resultantes foram projetados sobre um modelo digital de elevação gerado a partir dos dados ASTER. Os resultados mostraram que as bandas 5 e 6 do SWIR e 10 e 14 do TIR mediram a feição de absorção das argilas e a de emissividade do quartzo, respectivamente. Essas bandas melhoraram também a discriminação entre vegetação não fotossinteticamente ativa e solos. Apesar das diferenças no tamanho dos pixels e dos locais de amostragem de campo, alguns atributos dos solos foram correlacionados com a reflectância (R2 de 0,65 para Al
2O3 na banda 6 e de 0,61 para Fe2O3 na banda 3) e a
emissividade (R2 de 0,65 para fração total de areia com a razão das bandas 10/14). O uso
combinado dos dados de reflectância, emissividade e elevação revelou variações na composição dos solos com a topografia em porções específicas da cena. Das maiores para as menores elevações, um decréscimo no conteúdo de Al2O3 e aumento na fração total de areia foram
geralmente observados. Isso ocorreu em razão do predomínio de Latossolo Vermelho-Escuro no topo e de sua gradual transição para Latossolo Vermelho-Amarelo na base.
Termos de indexação: modelo digital de elevação, constituintes dos solos, sensoriamento remoto, topografia.
INTRODUCTION
Remote sensing instruments with improved spectral resolution have opened new perspectives for several applications, including for the study of soils. In spite of not being able to capture information from the diagnostic subsurface horizon, remote sensors may provide useful data from the soil surface to optimize fieldwork and mapping. ASTER (Advanced Spaceborne Thermal Emission and Reflection Radiometer), onboard the Terra Platform, launched in December 1999, has three bands in the VNIR (visible and near infrared), six bands in the SWIR (shortwave infrared) and five bands in the TIR (thermal infrared) with 15, 30 and 90 m of spatial resolution, respectively (Yamaguchi et al., 2001). The SWIR reflectance bands can detect hydroxyl absorption bands associated with clay minerals, whereas the TIR emissivity bands can identify reststrahlen features (Vaugham et al., 2005; Ducart et al., 2006). Reststrahlen features comprise minimum emissivity values associated with silica content or quartz (Salisbury & D’Aria, 1992). ASTER data may also be useful to discriminate bare soils from soils with senescent vegetation on the surface (French et al., 2000).
The toposequence position influences chemical and physical properties of tropical soils (Curi & Franzmeier, 1984; Uhlmann et al., 1997; Cunha et
al., 2005; Souza Júnior et al., 2008). Thus, ASTER can be used to generate a Digital Elevation Model (DEM) due to its along-track stereoscopic viewing capability (3N and 3B bands). The resulting elevation values may be associated with ASTER reflectance and emissivity data to characterize soil composition variations with topography.
Despite these advantages, the number of soil investigations using this sensor is still very small when compared with Landsat or VNIR-SWIR laboratory sensor studies to describe the effects of soil constituents (e.g., organic matter, Fe oxides and clay minerals) on reflectance (Stoner & Baumgardner, 1981; Formaggio et al., 1996; Galvão & Vitorello, 1998; Demattê et al., 2004; Dalmolin et al., 2005 and references therein). On the other hand, the relationships between soil granulometric-chemical properties and emissivity data are not completely characterized, even in laboratory studies in the TIR spectral region. Furthermore, the capacity of the combined use of the ASTER reflectance, emissivity and elevation data in soil studies has not yet been reported in the literature.
data for the discrimination between exposed soils and nonphotosynthetic vegetation; (2) to evaluate the possibilities of remotely estimating some soil properties; and (3) to relate these properties with the soil position in toposequences.
MATERIAL AND METHODS
ASTER data of the study area
The study area (40 x 50 km) is located in the state of Mato Grosso, central Brazil, between S 15.28 o W 55.34 o and S15.79 o W 55.04o. The
climate is tropical with a mean temperature of 21 °C. The annual rainfall may reach 1,500 mm with a well-defined rainy season between December and May. The topography is gently undulating and the mean elevation is 654 m asl. Land covers are predominantly crops, especially soybean, corn and cotton, which have rapidly replaced the natural vegetation (Cerrado) in the last few decades. Five major soil classes occur in the study area (Table 1) (Embrapa, 2006; USDA, 2006; FAO, 2006). Henceforth, only the Soil Taxonomy designation will be used to facilitate reading.
ASTER images were acquired on September 7, 2006 on three VNIR bands (spatial resolution of 15 m), six SWIR bands (30 m) and five TIR bands (90 m). During the image acquisition (regional dry season), most exposed soil areas were ploughed fields ready for soybean planting. Other areas included mixtures of soil and different types of nonphotosynthetic vegetation (residual dry leaves or litter from harvested soybean, corn and cotton) left on the ground to prevent erosion, increase soil fertility and to diminish soil moisture evaporation.
The Fast Line-of-Sight Atmospheric Analysis of Spectral Hypercubes (FLAASH) algorithm (ITT VIS, 2008), based on MODTRAN4 radiative transfer code, was applied to the VNIR and SWIR ASTER data (AST_L1B) to convert at-sensor radiance into surface reflectance values. Model parameters included a Tropical Atmosphere and Rural aerosol model with visibility set to 50 km. SWIR data were corrected for the crosstalk effect (Iwasaki & Tonooka, 2005) before
using FLAASH. The surface emissivity images were obtained from the standard product AST_05, derived from the Temperature Emissivity Separation (TES) algorithm (Gillespie et al., 1998). Atmospheric correction of TIR data was also based on the MODTRAN4 code (Palluconi et al., 1999).
To produce a 90 m spatial resolution DEM from geometrically corrected data, the nadir- and backward-looking ASTER images of the bands 3N and 3B and the ASTER_DTM algorithm (Sulsoft, 2004) were used. This algorithm converts these two bands into a pair of quasi-epipolar images, which have a pixel (smallest nondivisible element of a digital image) displacement in the satellite flight direction. This displacement is proportional to the pixel elevation. With a cross-correlation method to determine this displacement, elevation values are calculated.
Fieldwork and soil analyses
Fieldwork was performed two months after image acquisition and 112 sites were visited for soil class and nonphotosynthetic vegetation characterization. Because of the interest to relate soil properties to remote sensing data, 27 soil samples from the surface horizon (0–20 cm) were collected on well-delimited fields of the ASTER TIR images (90 m of spatial resolution) for different soil classes and granulometric-chemical analyses were performed. Total sand, silt and clay content were determined by the densimeter method (Camargo et al., 1986). By the method of Embrapa (1997), the following constituents were determined: organic carbon (potassium dichromate oxidation and colorimetric analyses), SiO2 (clay
fraction), Fe2O3, Al2O3, TiO2, MnO and P2O5 (sulfuric
acid and colorimetric analysis), exchangeable Ca2+,
Mg2+ (atomic absorption spectrophotometry) and Al3+
(titration with NaOH), and K2O (flame photometry).
Water pH was determined with glass electrodes using a soil/water mixture ratio of 1/2.5.
Data analysis
In general, spectral discrimination between nonphotosynthetic vegetation and exposed soil is important because bright soils and crop litter are not easily differentiated from each other in the scene. In
order to discriminate nonphotosynthetic vegetation from exposed soils, data analysis was performed in two steps. First, a four-endmember linear spectral mixture model (Adams et al., 1986) was applied to the VNIR-SWIR reflectance data. Endmembers are the spectrally purest pixels of the selected scene components. For their selection (green vegetation, soil, nonphotosynthetic vegetation and water, in the absence of shadow), a semi-automated procedure based on the sequential use of the Minimum Noise Fraction (MNF) and Pixel Purity Index (PPI) techniques and on the inspection of n-dimensional scatterplots was used (Green et al., 1988; Boardman & Kruse, 1994; Galvão et al., 2005). A threshold of 0.65 (pixels with more than 65 % of soil abundance) was applied to the soil-fraction image to identify pixels of exposed soils, but this procedure was not completely efficient for such a differentiation. Due to the prevalence of some confusion to separate nonphotosynthetic vegetation from bright soils in the soil-fraction image, an additional criterion (second step) was chosen using the combination of SWIR (band 5 = 2,145–2,185 nm; band 6 = 2,185–2,225 nm) and TIR (band 10 = 8,125– 8,475 nm; band 14 = 10,950–11,650 nm) normalized data in order to minimize this problem (Eq. (1) and (2)):
(1)
(2)
If reflectance increases, the emissivity must decrease, and vice-versa. However, soil constituents such as clay minerals and quartz produce spectral features in the SWIR and TIR at specific wavelengths. Equation (1) is an indirect measurement of the 2,200 nm clay mineral absorption band in pixel spectra, whereas Equation (2) measures the 8,300 nm quartz emissivity feature. Thus, the most exposed clayey and sandy soils will have large values in equations 1 and 2, respectively. Threshold values of 0.07 (Eq. 1) and 3 (Eq. 2) were used to improve discrimination between exposed soils and nonphotosynthetic vegetation in the soil fraction image.
Furthermore, the granulometric-chemical soil properties determined in laboratory for the 27 samples were correlated and regressed against ASTER reflectance and emissivity data. Data normality was evaluated by the Kolmogorov-Smirnov test (Netter & Wasserman, 1974). The best regression relationships computed in the statistical analyses were applied to the soil exposed image resulting from the spectral mixture model and from the subsequent use of equations 1 and 2. Because of the small number of samples and the need to establish the robustness of the regression relationships between soil constituents and spectral response, the bootstrappingtechnique was used. According to Efron (1981), bootstrapping
performs better than cross-validation in many cases, especially when the number of samples is small. It consisted of the random collection of a number of samples from a population at n times (10,000), yielding n correlations, with the objective of evaluating the error associated with the presence of a non-representative sample. Bootstrapping results were evaluated through histograms showing the frequency of correlations after resampling.
Soil properties estimates from the regression relationships were then plotted on the DEM and variations in estimated soil properties were analyzed as a function of elevation data in selected portions of the scene.
RESULTS AND DISCUSSION
Discrimination between exposed soils and nonphotosynthetic vegetation
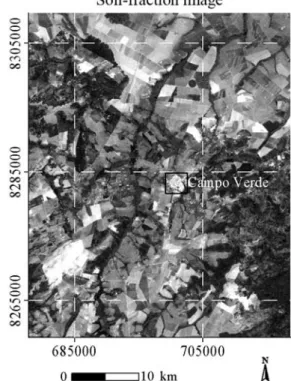
In the soil-fraction image (Figure 1) derived from the four-endmember spectral mixture model, areas of exposed soils were represented by bright pixels (large soil-fraction values). However, inspection of the pixel spectra and fieldwork showed that several areas of bright sandy soils were expressed as nonphotosynthetic vegetation (crop litter) in the model, which required an additional criterion to discriminate between these two classes. The degree of confusion depends on the type and amount of nonphotosynthetic vegetation on the soil.
The combined use of the SWIR and TIR normalized data (Equations 1 and 2) improved this discrimination in the soil-fraction image of the 112 field sites (Figure 2). As mentioned before, ASTER bands 5 and 6 were used to measure the SWIR clay mineral absorption bands whereas bands 10 and 14 were used to characterize the TIR quartz emissivity feature. Normalized SWIR values higher than 0.07, which mean deep 2,200 nm clay mineral absorption bands, separated exposed clayey soils from nonphotosynthetic vegetation (Figure 2). Normalized TIR values over 3, which mean well-defined quartz emissivity features, discriminated exposed bright soils from nonphotosynthetic vegetation. Nonphotosynthetic vegetation does not produce both features. Its presence on the soil surfaces replaces the SWIR clay mineral absorption bands by lignin-cellulose spectral features at 2,100 nm and 2,300 nm in pixel spectra (Galvão et al., 2005). Nonphotosynthetic vegetation also has lower normalized emissivity values than sandy soils. By using the soil fraction (0.65) and SWIR and TIR threshold values (0.07 and 3, respectively), an image of exposed soils was produced, which served as a basis for the subsequent analysis of the soil property estimates using reflectance and emissivity data.
ASTER spectra representative of the major soil classes of the study area showed spectral differences between each other at both intervals. The general shape of the reflectance curves (Figure 3a) was consistent with soil spectra reported by Souza Júnior et al. (2008) using ASTER and its simulated response from laboratory data. Emissivity differences between the soil classes were greater between 8,000 and 9,000 nm (Figure 3b), in agreement with observations
of French et al. (2000). The Rhodic Acrustox (RA) had the lowest reflectance, the highest emissivity and the largest values of organic carbon (1.41 ± 0.55 %), SiO2 (18.48 ± 6.58 %), Fe2O3 (9.99 ± 1.17 %), Al2O3
(21.66 ± 7.00 %) and TiO2 (1.38 ± 0.33 %). On the other hand, Ustic Quartzipsamments (UQ) showed the highest reflectance (Figure 3a), the lowest emissivity (Figure 3b) and the lowest values of these constituents (1.13 ± 0.27 %, 4.62 ± 1.91 %, 1.86 ± 1.96 %, 3.12 ± 3.68 % and 0.16 ± 0.18 %, respectively). RA (22.07 ± 14.03 % of total sand) and UQ (85.46 ± 7.09 % of total sand) are typically clayey and sandy soils, respectively. Typic Acrustox (TA) has intermediate values of reflectance, emissivity and sand fraction (52.4 ± 24.34 %). In spite of being a sandy soil, the absorption bands of UQ were well-defined 2,200 nm due to clay minerals. Kaolinite and gibbsite features, observed in soil pixel spectra of the study area by Galvão et al. (2008) by an airborne imaging spectrometer, were not differentiated by ASTER, due to its comparatively greater SWIR bandwidth.
Figure 3. Average ASTER (a) reflectance and (b) emissivity spectra of the three major soil classes of the study area (n = 100 pixels for each soil class). The symbols indicate the centre of the ASTER bands.
Possibilities of estimating soil constituents using ASTER reflectance data
Variations in Pearson’s correlation coefficients (r) for the relationships between ASTER reflectance and some soil constituents showed that an increase in the content of these constituents produced a reflectance decrease (Figure 4). The negative r values were consistent with the soil spectral properties described in the literature (Stoner & Baumgardner, 1981; Formaggio et al., 1996; Galvão & Vitorello, 1998; Demattê et al., 2004; Dalmolin et al., 2005). The highest correlations were observed for Al2O3 in the
SWIR(r of -0.66) and for Fe2O3 in the VNIR (r of -0.79).
For organic matter the r values in the VNIR-SWIR were low (e.g., r of -0.35 in the red ASTER band 2). An inspection of the scatter plots of Al2O3 and Fe2O3
with reflectance indicated that the relationships were not linear (Figures 5ab). They produced coefficients of determination (R2) of 0.65 (Al
2O3) and 0.61 (Fe2O3).
The validation of these relationships by bootstrapping histogram analysis confirmed their robustness. For Al2O3 (Figure 6a), minimum, maximum and average
r values of -0.43, -0.77 and -0.63 were obtained at a confidence interval of 95 %, respectively. For Fe2O3
(Figure 6b), the values were -0.51, -0.86 and -0.73. Regression relationships were applied to the exposed soil image resulting from the use of the spectral mixture model and of the normalized SWIR and TIR approach to show variations in soil constituents (e.g., Al2O3) on a per-pixel basis
(Figure 7). Pixels in white represent other scene components (e.g., green vegetation, nonphotosynthetic vegetation, water). According to field inspection, the highest values of Al2O3, indicated by increasing
reddish shades (Figure 7), were mainly associated with RA and TA soil classes. Precise field validation of
these estimates requires the use of a great number of samples to generate and test the regression relationships versus the differences in pixel size (m) and soil sampling size (cm), and variations in soil composition.
Possibilities of estimating sand fraction using ASTER emissivity data
Despite the small number of samples and the differences between pixel size (90 m in the TIR) and soil sampling size (60 cm in the field), correlations between soil properties and emissivity data were also observed in the TIR. Because of the sensitivity of the TIR data to detect quartz, the most interesting relationship was observed between the ASTER emissivity ratio (band10/14) and the measured total sand fraction (Figure 8). For an increase in sand fraction, there was a decrease in the 10/14 band ratio with a R2 value of 0.65. Results from bootstrapping
analysis (Figure 9) showed minimum, maximum and
Figure 4. Variations in Pearson’s correlation coefficients, as a function of the wavelength, for the relationships between soil constituents and ASTER reflectance. The symbols indicate the center of the ASTER bands.
When applied to the exposed soil image, the highest estimated sand fraction values in the scene (red color in the upper portion of figure 10) were coincident with land degradation resulting from the removal of the savanna vegetation (Cerrado) and from the difficulty of vegetation regrowth on the sandy soil (Breunig et al., 2008).
Variations in soil atributes with elevation
Soil atributes varied according to the toposequence position in several parts of the study area, as shown by the property estimates plotted on the ASTER-derived DEM. For example, estimated Al2O3 and sand
fraction values varied according to the altitude along the transect (A-B) (Figure 11; see location in Figure 10). From higher to lower slope positions, average r values of -0.58, -0.86 and -0.77 at a
confidence interval of 95 %, respectively. This relationship was in agreement with that observed by Salisbury & D’Aria (1992) who pointed out an equivalent ratio to characterize the particle size of quartz-rich soils, based on the reststrahlen feature.
Figure 9. Frequency of the correlation coefficients from bootstrap analysis for the relationships between total sand fraction and ASTER emissivity ratio (bands 10/14). The mean value is indicated by the shaded column.
Figure 8. Relationships between total sand fraction and ASTER emissivity ratio (bands 10/14).
Figure 6. Frequency of the correlation coefficients from bootstrap analysis for the relationships between (a) reflectance (ASTER Band 6; 2,209 nm) and Al2O3; and (b) reflectance (band 3; 807 nm) and Fe2O3. Mean values are indicated by the shaded columns.
there was a decrease in Al2O3 content associated with clay mineralogy (Figure 11a) and an increase in the sand fraction values (Figure 11b). At some places, soil composition changed gradually from Rhodich Acrustox at higher to Typic Acrustox and Xanthic Acrustox at lower altitudes, as also observed by Galvão et al. (2008) in the vicinity of Campo Verde (MT). Variations in soil composition with elevation data were also described by Souza Júnior et al. (2008) using ASTER-simulated data from laboratory reflectance spectra.
Changes in soil composition with toposequence position have been commonly reported in the literature (Curi & Franzmeier, 1984; Uhlmann et al., 1997; Cunha et al., 2005). From a pedological point of view, such variations with altitude are usually produced by textural toposequences that most commonly occur on valley slopes of rivers that cut into uniform, deeply weathered sediments. Raindrop impact disrupts the aggregates in the topsoil and separates clay particles from coarser sand grains. Running water picks up the finest particles and transports clay in suspension downslope into the rivers. When the rivers flow freely out of the watersheds into streams, this sorting process leaves the nonclay particles and the resistant aggregates behind as colluviums in the lower parts of the topography. This mechanism creates sequences of soils that become sandier downslope. In many cases it also explains the occurrence of lighter textured surface layers in soils of sloping land. The decrease in clay content in the soils or in the horizons usually coincides with color changes from reddish to yellow in the sandier materials (Wambeke, 1992).
CONCLUSIONS
1. When coupled to a linear spectral mixture model, normalized ASTER SWIR reflectance and TIR emissivity data improved the discrimination of exposed soils from nonphotosynthetic vegetation (crop litter). The ASTER SWIR bands 5 and 6 were appropriate to measure the 2200 nm clay mineral absorption band (nonphotosynthetic vegetation discrimination from clayey soils), whereas the TIR bands 10 and 14 were adequate to measure the quartz emissivity feature (nonphotosynthetic vegetation discrimination from sandy soils).
2. Despite the differences in pixel size (tens of m) and field sampling size (some cm), some soil properties were correlated with ASTER reflectance (e.g., R2 of
0.65 for Al2O3 in band 6; 0.61 for Fe2O3 in band 3) and emissivity (e.g., R2 of 0.65 for total sand fraction
in the 10/14 band ratio) data. Results demonstrated the possibility of estimating some soil constituents in the study area on a per-pixel basis (bare soil image) using ASTER data. Further research is necessary to evaluate the effect of shadows and strong variations in organic matter on these estimates. Precise field
Figure 11. Variations in estimated (a) Al2O3 and (b) total sand fraction values, as a function of ASTER-derived elevation for the transect (A-B) indicated in Figure 10.
validation of the observed regression relationships also requires a greater number of samples.
3. The combined use of ASTER-derived reflectance, emissivity and elevation data showed soil composition variations according to the toposequence positions in particular sections of the study area. Some of them were confirmed in fieldwork. From higher to lower slope positions, a decrease in Al2O3 and an increase in total sand fraction was generally observed, sometimes corresponding to changes in soil classes from Rhodich Acrustox at higher to Typic Acrustox at lower altitudes.
ACKNOWLEDGEMENTS
The authors are grateful to FAPESP (Fundação de Amparo à Pesquisa do Estado de São Paulo) (05/ 01737-0), CNPq (Conselho Nacional de Desenvolvimento Científico e Tecnológico) and CAPES (Coordenação de Aperfeiçoamento de Pessoal de Nível Superior).
LITERATURE CITED
ADAMS, J.B.; SMITH, M.O. & JOHNSON, P.E. Spectral mixture modeling: A new analysis of rock and soil types at the Viking Lander I site. J. Geophys. Res., 91:8098-8112, 1986.
BOARDMAN, J.W. & KRUSE, F.A. Automated spectral analysis: A geological example using AVIRIS data, northern Grapevine Mountains, Nevada. In: THEMATIC CONFERENCE, GEOLOGIC REMOTE SENSING, 10., San Antonio, 1994. Proceedings. San Antonio, 1994. p.I-407-I-418, 1994.
BREUNIG, F.M.; GALVÃO, L.S. & FORMAGGIO, A.R. Detection of sandy soil surfaces using ASTER-derived reflectance, emissivity and elevation data: Potential for the identification of land degradation. Inter. J. Remote Sens., 29:1833-1840, 2008.
CAMARGO, O.A.; MONIZ, A.C.; JORGE, J.A. & VALADARES, J.M. Métodos de análise química, mineralógica e física de solos do IAC. Campinas, Instituto Agronômico de Campinas, 1986. 94p.
CUNHA, P.; MARQUES, J.; CURI, N.; PEREIRA, G.T. & LEPSCH, I.F. Geomorphic surfaces and Latosol (Oxisol) characteristics on a sandstone/basalt sequence from the Jaboticabal region, São Paulo State, Brazil. R. Bras. Ci. Solo, 29:81-90, 2005.
CURI, N. & FRANZMEIER, D.P. Toposequence of Oxisols from the Central Plateau of Brazil. Soil Sci. Soc. Am. J., 48:341-346, 1984.
DALMOLIN, R.S.D.; GONÇALVES, C.N. & DICK, E.K.D.P. Relações entre os constituintes do solo e seu comportamento espectral. Ci. Rural, 35:481-489, 2005.
DEMATTÊ, J.A.M.; GAMA, M.A.P.; COOPER, M.; ARAÚJO, J.C.; NANNI, M.R. & FIORIO, P.R. Effect of fermentation residue on the spectral reflectance properties of soils. Geoderma, 120:187-200, 2004.
DUCART, D.F.; CROSTA, A.P.; FILHO, C.R.S. & CONIGLIO, J. Alteration mineralogy at the Cerro La Mina Epithermal Prospect, Patagonia, Argentina: Field mapping, short-wave infrared spectroscopy, and ASTER images. Econ. Geol., 101:981-996, 2006.
EFRON, B. Nonparametric estimates of standard error: The jackknife, the bootstrap and other methods. Biometrika, 68:589-599, 1981.
EMPRESA BRASILEIRA DE PESQUISA AGROPECUÁRIA -EMBRAPA. Centro Nacional de Pesquisas dos Solos. Manual de métodos de análise de solos. 2.ed. Rio de Janeiro, 1997. 212p.
EMPRESA BRASILEIRA DE PESQUISA AGROPECUÁRIA -EMBRAPA. Centro Nacional de Pesquisas dos Solos. Sistema brasileiro de classificação de solos. 2.ed. Rio de Janeiro, 2006. 306p.
FOOD AND AGRICULTURE ORGANIZATION - FAO. World reference base for soil resources: A framework for international classification, correlation and communication. Rome, 2006. 145p. (World Soil Resources Reports, 143)
FORMAGGIO, A.R.; EPIPHANIO, J.C.N.; VALERIANO, M.M. & OLIVEIRA, J.B. Comportamento espectral (450-2.450 nm) de solos tropicais de São Paulo. R. Bras. Ci. Solo., 20:467-474, 1996.
FRENCH, A.N.; SCHMUGGE, T.J. & KUSTAS, W.P. Discrimination of senescent vegetation using thermal emissivity contrast. Remote Sens. Environ., 74:249-254, 2000.
GALVÃO, L.S.; ALMEIDA FILHO, R. & VITORELLO, Í. Spectral discrimination of hydrothermally altered materials using ASTER shortwave infrared bands: Evaluation in a tropical savannah environment. Inter. J. Appl. Earth Obser. Geoinf., 7:107-114, 2005.
GALVÃO, L.S.; FORMAGGIO, A.R.; COUTO, E.G. & ROBERTS, D.A. Relationships between the mineralogical and chemical composition of tropical soils and topography from hyperspectral remote sensing data. ISPRS Photo. Interp. Remote Sens., 63:259-271, 2008.
GALVÃO, L.S. & VITORELLO, Í. Role of organic matter in obliterating the effects of iron on spectral reflectance and colour of Brazilian tropical soils. Inter. J. Remote Sens., 19:1969-1979, 1998.
GREEN, A.A.; BERMAN, M.; SWITZER, P. & CRAIG, M.D. A transformation for ordering multispectral data in terms of image quality with implications for noise removal. IEEE Trans. Geosci. Remote Sens., 26:65-74, 1988.
IWASAKI, A. & TONOOKA, H. Validation of crosstalk correction algorithm for ASTER/SWIR. IEEE Trans. Geosci. Remote Sens., 43:2747-2751, 2005.
ITT VISUAL INFORMATION SOLUTIONS – ITT VIS. ENVI 4.4. Boulder, 2008. CD ROM.
NETER, J. & WASSERMAN, W. Applied linear statistical models. New York, John Wiley, 1974. 842p.
PALLUCONI, F.; HOOVER, G.; ALLEY, R.; JENTOFT-NILSEN, M. & THOMPSON, T. An atmospheric correction method for ASTER thermal radiometry over land: ASTER Standard Data Product AST09, “Level-2 Radiance—TIR, Land_Leaving”. Jet Propulsion Laboratory. 4800 Oak Grove Drive, Pasadena. 1999. p. 27. Available at: <http://eospso.gsfc.nasa.gov/ eos_homepage/for_scientists/atbd/docs/ASTER/atbd-ast-05.pdf>
SALISBURY, J.W. & D’ARIA, D.M. Emissivity of terrestrial materials in the 8-14 µm atmospheric window. Remote Sens. Environ., 42:83-106, 1992.
SOUZA JÚNIOR, J.G.A.; DEMATTÊ, J.A.M. & GENÚ, A.M. Comportamento espectral dos solos na paisagem a partir de dados coletados por sensores terrestre e orbital. R. Bras. Ci. Solo, 32: 727-738, 2008.
STONER, E.R. & BAUMGARDNER, M.F. Soil spectral characterization. In: INTERNATIONAL GEOSCIENCE AND REMOTE SENSING SYMPOSIUM – IGARSS, 1981, Washington. Proceedings. Washington, Institute of Electrical and Electronics Engineers, 1981. p.1426-1436. SULSOFT. ASTER DTM: Installation & User’s Guide. 2004. 21p. v.2.2. Copyright © SulSoft Ltda. Disp. <http:// www.sulsoft.com.br>
UHLMANN, A.; CURCIO, G.R.; GALVÃO, F. & SILVA, F.M. Relationships between distribution of vegetation physiognomic types and geomorphic and pedological patterns in a savanna area (Cerrado) in southern Brazil. Arq. Biol. Técnol., 40:473-483, 1997.
UNITED STATES DEPARTMENT OF AGRICULTURE -USDA. Keys to soil taxonomy. 10.ed. Washington, Natural Resources Conservation Service, 2006. 341p.
VAUGHAN, R.G.; HOOK, S.J.; CALVIN, W.M. & TARANIK, J.V. Surface mineral mapping at Steamboats Springs, Nevada, USA, with multi-wavelength thermal infrared images. Remote Sens. Environ., 99:140-158, 2005. WAMBEKE, A.V. Soils of the tropics: Properties and appraisal.
New York, McGraw- Hill, 1992. 343p.