Vol.57, n.6: pp. 971-978, November-December 2014 http://dx.doi.org/10.1590/S1516-8913201402619
ISSN 1516-8913 Printed in Brazil
BRAZILIAN ARCHIVES OF BIOLOGY AND TECHNOLOGY
A N I N T E R N A T I O N A L J O U R N A L
Modeling the Growth of
Byssochlamys fulva
on Solidified
Apple Juice at Different Temperatures
Daniel Angelo Longhi, Andréia Tremarin, Bruno Augusto Mattar Carciofi, João Borges
Laurindo and Gláucia Maria Falcão de Aragão
*Departamento de Engenharia Química e Engenharia de Alimentos; Universidade Federal de Santa Catarina; Florianópolis - SC - Brasil
ABSTRACT
The aim of this study was to establish primary and secondary models to describe the growth kinetics of
Byssochlamys fulva on solidified apple juice at different temperatures. B. fulva was inoculated on solidified apple juice at 10, 15, 20, 25 and 30 °C. Linear-with-breakpoint, Baranyi and Roberts, and Huang primary models (without upper asymptote) were fitted to the data, and they showed good ability to describe the growth kinetics. B. fulva showed longer adaptation time on apple juice than on culture medium, but growth rates were similar as reported in the literature. The dependence of µmax and λ parameters on temperature was described with Square Root
and Arrhenius-Davey secondary models, respectively. These models were important to establish process/storage conditions and apple juice shelf life.
Key words: mould growth, mathematical modeling, food microbiology, predictive mycology
*Author for correspondence: [email protected]
INTRODUCTION
Some mould species are heat resistant due to their ability to produce ascospores. Byssochlamys sp. are responsible for spoilage and degradation of processed fruit juices and fruit-based products, since they can grow in acidic environments and under low oxygen partial pressures. Furthermore, some of them have been reported as mycotoxin producers (Houbraken et al. 2006; Panagou et al. 2010). Byssochlamys is heat resistant fungal genus most implicated in the spoilage of fruit juices and foods (Tribst et al. 2009), since clarified apple juice can be easily spoiled by B. fulva even at a very low initial contamination (Sant’Ana et al. 2010). Thus, the evaluation of growth kinetics of this mould is important in food safety, since the patulin production in apple juices by this mould species was confirmed by Sant’Ana et al. (2010).
B. fulva growth kinetics was recently studied in
Modeling the growth of filamentous fungi has been performed mainly for the linear growth range, where the slope of the curve is defined as the maximum growth rate (Wyatt et al. 1995; Dantigny et al. 2005; Gougouli and Koutsoumanis 2010). However, sigmoidal models describing all growth phases (adaptation time, maximum growth rate, and stationary phase) could be more able to assess mould growth, since the parameter estimation can be made for the whole curve. Sigmoidal models were originally developed to describe bacterial growth, but some works used these models to describe mould growth (Tassou et al. 2007; Silva et al. 2010; Astoreca et al. 2012). The Baranyi and Roberts (Baranyi et al. 1993; Baranyi and Roberts 1994) sigmoidal model was successfully used to assess the growth of 14 different mould species (Marín et al. 2008). The moulds often show a great ability to grow occupying all the available space (Marín et al. 2008). In these cases, there is no way to evaluate the maximum diameter reached by the mould, thus models that do not consider the stationary growth phase (models without upper asymptote) should be used.
The objective of this study was to evaluate the growth kinetics of B. fulva on solidified apple juice under five isothermal conditions (10, 15, 20, 25, and 30 °C) and the ability of the Linear-with-breakpoint, Baranyi and Roberts, and Huang models without upper asymptote to describe the growth kinetics of this mould.
MATERIAL AND METHODS
Microorganism and Preparation of Spore Suspension
Byssochlamys fulva IOC 4518 strain was isolated from apple juice concentrate in a previous work (Salomão et al. 2008). The preparation of B. fulva
spores was started by pre-sporulation in Petri dishes containing Potato Dextrose Agar (PDA) medium (pH 3.5) at 30 °C for seven days. The collected spores were added to the plates containing Malt Extract Agar (MEA) medium and incubated for 30 days at 30 °C. After this period, 1.0 mL of sterile distilled water was added to each plate, which was scraped with a rubber spatula. The entire plate content was filtered through four layers of sterile gauze and centrifuged at 3,500 rpm (2,000 times the force of gravity) for 15 min. This procedure was repeated until no hyphae were
seen under the microscope. The final suspension was prepared with the precipitate in a minimum volume of water, sufficient to obtain a highly concentrated suspension (around 105 UFC/mL) (Salomão et al. 2007). The B. fulva suspensions were transferred to a flask and kept at 4°C until use.
Growth Medium
Diluted apple juice was prepared from clarified and concentrate apple juice (70° Brix) supplied by Fischer S/A, Videira/SC, Brazil. The pH of the juice was adjusted to 3.8 by means of sodium hydroxide (1 mol/L) or hydrochloric acid (1 mol/L) solutions. Soluble solids content was adjusted to 25° Brix (refractometer AR200, Reichert, USA) through dilution with distilled water. A hygrometer (Aqua Lab Model 3TE, Decagon Devices, USA) was used to measure the juice’s water activity (aw), which was equal to 0.97
for diluted apple juice. Growth medium was prepared with 100 mL of this formulated juice added to 1.5 g of agar, and this mixture was heated and maintained at 115 °C for 1 min. Then, the growth medium was placed in Petri dishes (150 mm in diameter).
Inoculation and Growth Kinetics of B. fulva The plates containing solidified apple juice were individually inoculated in a laminar flow chamber by depositing a loopful of the microorganisms’ suspension in the center of each plate. Next, the plates were wrapped in plastic film and incubated at constant temperature (10, 15, 20, 25, and 30 °C) for three months or until the fungi reached the entire plate. The growth kinetics of B. fulva was analyzed by measuring the colony diameter on the surface of solidified apple juice over time at different incubation temperatures.
Experimental data were obtained by averaging the measurements of colonies at four different positions in each plate for three different plates. The reverse sides of colonies were measured with a ruler (± 0.5 mm) every 12 h, resulting in the kinetics of the colony diameter (mm) over time (days). Plating of diluted apple juice with agar without inoculation was performed at each incubation temperature in order to verify whether the medium was free of contamination.
Mathematical Modeling
(BAR) (Baranyi et al. 1993; Baranyi and Roberts 1994), and Huang (HUA) (Huang 2008) models (without upper asymptote) to describe the experimental data were assessed in this study. The LIN model was used to describe only the linear growth phase (Equation (1)). On the other hand, the BAR (Equation (2)) and HUA (Equation (3)) models were used to describe the biphasic growth curve (adaptation time and maximum growth rate). The differential equations of the BAR and HUA original models were reduced so as not to consider the stationary growth phase (upper asymptote). For all models, D(t) is the colonies’ diameter (mm) at the time t (day), µmax is the maximum growth rate
(mm/day), λ is the adaptation time (day), and α
(1/day) is an empirical curvature parameter, fixed as suggested by the author (α = 25) (Huang 2008).
( )
max
D(t)=µ t-λ (1)
(
)
[
]
[
]
{
max max}
D(t)=ln 1 exp+ µ t−λ −exp µ λ (2)
(
)
(
)
( )
1 exp 1 ln 1 exp t α λ µ α αλ + − + + maxD(t)= t (3)
Secondary models normally used for modeling growth parameters of bacteria have been used for parameters of moulds (Dantigny et al. 2005), like the Square Root and Arrhenius-Davey models. The dependence of µmax and λ parameters on the
temperature were described by the Square Root model (Ratkowsky et al. 1982), Equation (4), and the Arrhenius-Davey model (Davey 1989), Equation (5), respectively. In these models, T is the temperature (°C), Tmin is the theoretical
temperature for minimal growth (°C), and b, C0
and C1 are empirical parameters.
(
)
max b T Tmin
µ = − (4)
( )
10
ln C C
T
λ = + (5)
The fitting of primary and secondary models to the data was performed by the Curve fitting tool of Matlab software (MathWorks, Natick, USA) using the non-linear least squares method and the trust-region reflective Newton algorithm.
Statistical Analysis
The ability of the primary models to describe the experimental data was assessed through the root-mean-square error (RMSE) and the adjusted coefficient of determination (R2adj). The RMSE was
calculated according to Equation (6), in which pdi
is the values predicted by the model, obi is the
experimental data, num is the number of experimental points, and par is the number of parameters of the assessed model.
( )2
1 num
i i
i
p d o b R M S E
n u m p a r
= − = −
∑
(6)The R2adj was based on the squared Pearson
correlation coefficient considering the number of experimental points and parameters. It was
calculated according to Equation (7), in which pd is the average of the values predicted by the
model, and ob is the average of the experimental data.
(
)(
)
(
) (
)
2 2 2 2 1 1 1 1 i i adj i ipd pd ob ob num
R
num par pd pd ob ob
− − − = − − − + − −
∑
∑
∑
(7)Good fits are obtained when RMSE values are almost zero, and R2adj values are almost one.
RESULTS AND DISCUSSION
Modeling B. fulva Growth at Different Temperatures
The experimental data of B. fulva growth on solidified apple juice showed typical mould growth curves, with clear adaptation time and linear growth phases, absence of stationary growth phase (during the evaluated time), and temperature-dependent growth rates. For the higher temperatures (20, 25, and 30 °C), the maximum diameter of the plate (150 mm) was reached by the B. fulva colonies, whereas at 10 and 15 °C, no stationary phase was observed over the experimental time. Similar growth behavior for many mould species on solid medium was reported by Marín et al. (2008).
All the evaluated primary models were able to describe very well the growth of B. fulva on solidified apple juice. The R2adj and RMSE values
for the LIN, BAR, and HUA models fitted to the experimental data at 10, 15, 20, 25, and 30 °C are shown in Table 1. The good ability of the models to describe the experimental data could be verified through the low RMSE (below 5.37 mm) and high
R2adj (above 0.983) values obtained. The fitting of
performances of the Baranyi and Roberts model to describe the experimental data of mould growth have been reported in the literature, e.g., Marín et al. (2008); Tassou et al. (2007); Silva et al. (2010). On the other hand, the Huang model has not been used to describe mould growth.
The statistical indexes RMSE and R2adj were almost
the same for the fitting of the LIN, BAR, and HUA models to the data (Table 1). Dantigny et al. (2005) reported regression coefficients often greater than 0.99 for the LIN model. The main difference among the models is the approach,
where the LIN model is fitted only for the linear phase, while the BAR and HUA are fitted for both adaptation time and linear phase. Thus, the LIN model can be easier to use for being simpler, while the BAR and HUA models can be more practical because all experimental data can be used in the modeling. Marín et al. (2008) found that for large plates, the BAR model (without upper asymptote) would be the best model to describe mould growth. The results in this study showed that the HUA and LIN models could be also successfully used in these cases.
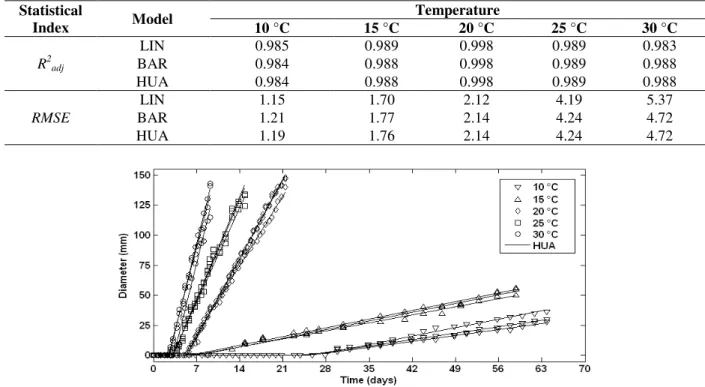
Table 1 -R2adj and RMSE (mm) values of the fitting of the LIN, BAR, and HUA models to the growth data of B.
fulva colony diameter on solidified apple juice at 10, 15, 20, 25, and 30 °C.
Statistical
Index Model
Temperature
10 °C 15 °C 20 °C 25 °C 30 °C
R2adj
LIN 0.985 0.989 0.998 0.989 0.983
BAR 0.984 0.988 0.998 0.989 0.988
HUA 0.984 0.988 0.998 0.989 0.988
RMSE
LIN 1.15 1.70 2.12 4.19 5.37
BAR 1.21 1.77 2.14 4.24 4.72
HUA 1.19 1.76 2.14 4.24 4.72
Figure 1 - Experimental data of B. fulva colony diameter growth (triplicate) on solidified apple juice over time at 10, 15, 20, 25, and 30 °C and the fitting of the HUA model.
Modeling Dependence of µmax and λ Parameters on Temperature
The model parameters µmax and λ estimated by the
fitting of each model to the experimental data are shown in Table 2. Both estimated parameters showed great similarity for all the models, mainly for the BAR and HUA models. The good ability of the Square Root and Arrhenius-Davey models to describe the dependence of µmax and λ parameters
with the temperature could be verified through the
high R2adj (above 0.940) values obtained, as shown
in Table 3. The fitting of the Square Root model to the µmax parameter data obtained from the HUA
model is shown in Figure 2, and the fitting of the Arrhenius-Davey model to the λ parameter data
obtained from the HUA model is shown in Figure 3. These results confirmed a strong dependence of the adaptation time (λ) and maximum growth rate
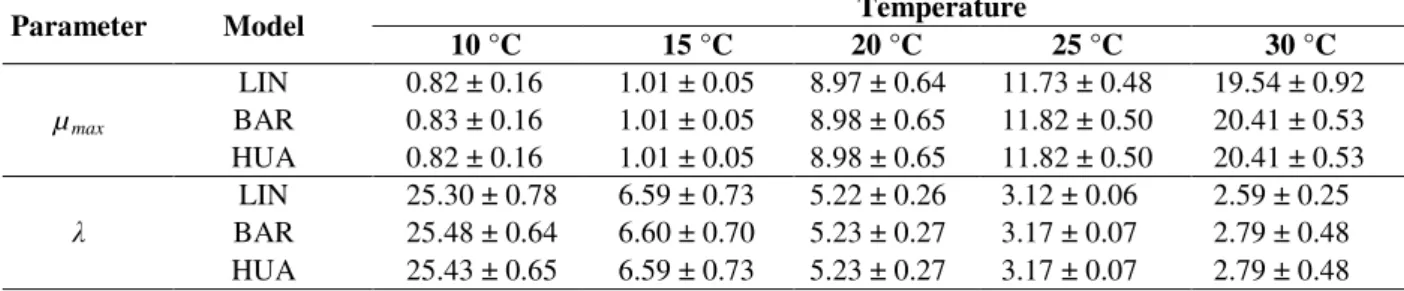
Table 2 - Values of parameters µmax and λ (± standard error) for the LIN, BAR, and HUA models fitted to the growth data of B. fulva colony diameter on solidified apple juice at 10, 15, 20, 25, and 30 °C.
Parameter Model Temperature
10 °C 15 °C 20 °C 25 °C 30 °C
µmax
LIN 0.82 ± 0.16 1.01 ± 0.05 8.97 ± 0.64 11.73 ± 0.48 19.54 ± 0.92 BAR 0.83 ± 0.16 1.01 ± 0.05 8.98 ± 0.65 11.82 ± 0.50 20.41 ± 0.53 HUA 0.82 ± 0.16 1.01 ± 0.05 8.98 ± 0.65 11.82 ± 0.50 20.41 ± 0.53
λ
LIN 25.30 ± 0.78 6.59 ± 0.73 5.22 ± 0.26 3.12 ± 0.06 2.59 ± 0.25 BAR 25.48 ± 0.64 6.60 ± 0.70 5.23 ± 0.27 3.17 ± 0.07 2.79 ± 0.48 HUA 25.43 ± 0.65 6.59 ± 0.73 5.23 ± 0.27 3.17 ± 0.07 2.79 ± 0.48
Table 3 - Parameter values (b, Tmin, C0 and C1) and statistical indexes (R 2
adj and RMSE) of the Square Root and Arrhenius-Davey secondary models fitted to µmax and λ parameters data from the LIN, BAR, and HUA primary models.
Model µmax λ
b Tmin R2adj RMSE C0 C1 R2adj RMSE
LIN 0.0386 6.27 0.940 0.072 3.097 31.97 0.977 0.124
BAR 0.0388 6.26 0.941 0.072 3.086 32.67 0.980 0.118
HUA 0.0388 6.26 0.941 0.072 3.088 32.63 0.980 0.117
Figure 2 - Fitting of the Square Root model to the µmax parameter data obtained from the HUA primary model.
Figure 3 - Fitting of the Arrhenius-Davey model to the λ parameter data obtained from the HUA
primary model.
Effects of Environmental Conditions on Mould Growth
Many studies have focused on the effect of different water activities on mould growth
appropriate data and regression models for
Byssochlamys sp. in the literature.
As stated before, the results showed that B. fulva
was able to grow very well on solidified apple juice from 10 to 30 °C and water activity of 0.97, with average maximum growth rate around 20.0 mm/day at 30 °C. Panagou et al. (2010) estimated the maximum growth rate of B. fulva on malt extract agar with the Rosso cardinal secondary model from 26 to 28 mm/day at optimal conditions of temperature (32.1 °C) and water activity (0.985). Valik and Pieckova (2001) estimated the
B. fulva maximum growth rate of 20.23 mm/day on Sabouraud agar at optimal water activity (0.99) and temperature of 25 °C. B. fulva maximum growth rate of 15.18 mm/day at 34.5 °C on refrigerated papaya pulp (water activity was not reported) was obtained from secondary model of Silva et al. (2013). The different values of maximum growth rate among different studies could be explained by the different growth media employed, experimental conditions (temperatures and water activities), and intrinsic characteristics of mould species.
An important contribution of this work has been the evaluation of B. fulva growth on solidified apple juice, since growth kinetics of this mould species are available on different types of culture
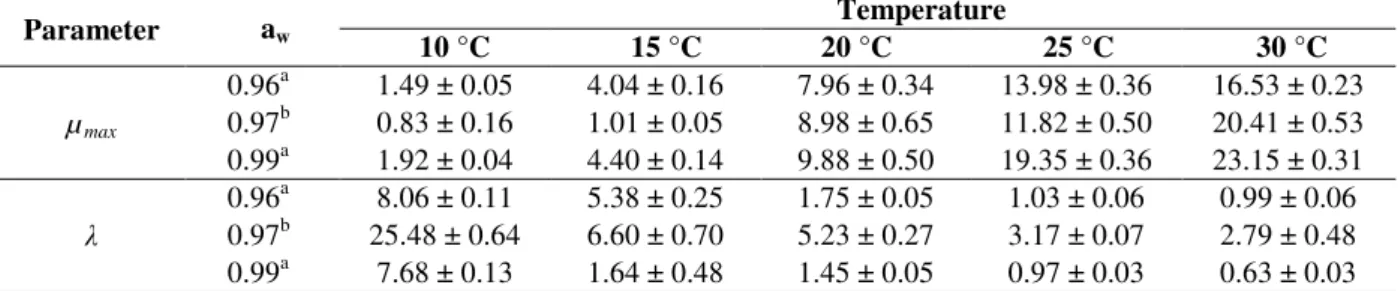
media, but are scarce on foods. The microorganisms tend to have different growth behavior on different growth media, mainly on foods due to their complexity. The mould growth on laboratory media may overestimate their ability to grow on foods and lead to an unrealistically predicted broad range of growth conditions (Astoreca et al. 2012). Thus, the B. fulva growth parameters on malt extract agar (Panagou et al. 2010) and on solidified apple juice (results of the present study) were compared, as shown in Table 4. The main difference was observed for the adaptation time (λ parameter), probably due to the needed time for the mould adaptation on the more complex apple juice growth medium. On the other hand, the maximum growth rate (µmax parameter)
was less affected by the different growth medium, showing that B. fulva was able to grow very well on both media after being adapted to the environment.
The evaluation of the effects of environmental conditions (temperature, water activity, growth media, among others) on mould growth is important to predict the shelf life of food products. Therefore, the primary and secondary models established in the current work could be useful to determine process/storage conditions, which could extend the shelf life of apple juice.
Table 4 - Comparison of the Baranyi and Roberts model parameters µmax and λ (± standard error) for growth of B.
fulva on malt extract agara and on solidified apple juiceb at different water activities and temperatures.
Parameter aw
Temperature
10 °C 15 °C 20 °C 25 °C 30 °C
µmax
0.96a 1.49 ± 0.05 4.04 ± 0.16 7.96 ± 0.34 13.98 ± 0.36 16.53 ± 0.23 0.97b 0.83 ± 0.16 1.01 ± 0.05 8.98 ± 0.65 11.82 ± 0.50 20.41 ± 0.53 0.99a 1.92 ± 0.04 4.40 ± 0.14 9.88 ± 0.50 19.35 ± 0.36 23.15 ± 0.31
λ
0.96a 8.06 ± 0.11 5.38 ± 0.25 1.75 ± 0.05 1.03 ± 0.06 0.99 ± 0.06 0.97b 25.48 ± 0.64 6.60 ± 0.70 5.23 ± 0.27 3.17 ± 0.07 2.79 ± 0.48 0.99a 7.68 ± 0.13 1.64 ± 0.48 1.45 ± 0.05 0.97 ± 0.03 0.63 ± 0.03 a Data from Panagou et al. (2010) for growth of
B. fulva DSM 1808 on malt extract agar. b Data of the current work for growth of
B. fulva IOC 4518 on solidified apple juice.
The temperature can vary during the production and distribution chain, and the effect of fluctuating temperature on the mould growth can be important. Gougouli and Koutsoumanis (2010) established primary and secondary models and assessed the effect of fluctuating temperature on the growth of Penicillium expansum and
Aspergillus niger on malt extract agar. Silva et al. (2013) established models and assessed the growth
CONCLUSION
The adaptation time of B. fulva was more affected by the growth medium than the maximum growth rate, in which B. fulva showed longer adaptation time on solidified apple juice than on culture medium, but growth rates were similar after being adapted in both environment. The LIN, BAR, and HUA models assessed in this work showed good ability to describe the growth kinetics of B. fulva
on solidified apple juice. It could be important to emphasize that the Huang model, which was not used to describe mould growth, could also be used successfully to provide the growth parameters µmax
and λ. The dependence of these parameters on the
temperature was well described by the Square Root and Arrhenius-Davey models, respectively. These models were important to establish the process/storage conditions and apple juice shelf life.
ACKNOWLEDGEMENTS
The authors thank the Graduate Program in Food Engineering of the Federal University of Santa Catarina (UFSC) and CAPES-Brazil for their financial support.
REFERENCES
Astoreca A, Vaamonde G, Dalcero A, Ramos AJ, Marín S. Modelling the effect of temperature and water activity of Aspergillus flavus isolates from corn. Int J Food Microbiol. 2012; 156: 60-67.
Baranyi J, Roberts T, McClure P. A non-autonomous differential equation to model bacterial growth. Food Microbiol. 1993; 10: 43-59.
Baranyi J, Roberts T. A dynamic approach to predicting bacterial-growth in food. Int J Food Microbiol. 1994; 23: 277-294.
Dantigny P, Guilmart A, Bensoussan M. Basis of predictive mycology. Int J Food Microbiol. 2005; 100: 187-196.
Davey KR. A predictive model for combined temperature and water activity on microbial growth during the growth phase. J Appl Bacteriol. 1989; 67: 483-488.
Garcia D, Ramos AJ, Sanchis V, Marín S. Modelling the effect of temperature and water activity in the growth boundaries of Aspergillus ochraceus and
Aspergillus parasiticus. Food Microbiol. 2011; 28: 406-417.
Gougouli M, Koutsoumanis K. Modelling growth of
Penicillium expansum and Aspergillus niger at constant and fluctuating temperature conditions. Int J Food Microbiol. 2010; 140: 254-262.
Houbraken J, Samson RA, Frisvad JC. Byssochlamys: significance of heat resistance and mycotoxin production. In: Hocking AD, Pitt JI, Samson RA, Thrane U. Advances in Food Mycology: Advances in Experimental Medicine Biology. v. 571. New York, NY: Springer; 2006. 211-224.
Huang L. Growth kinetics of Listeria monocytogenes in broth and beef frankfurters – Determination of lag phase duration and exponential growth rate under isothermal conditions. J Food Sci. 2008; 73: 235-242. Marín S, Cuevas D, Ramos AJ, Sanchis V. Fitting of
colony diameter and ergosterol as indicators of food borne mould growth to known growth models in solid medium. Int J Food Microbiol. 2008; 121: 139-149. Panagou EZ, Chelonas S, Chatzipavlidis I, Nychas GJE.
Modelling the effect of temperature and water activity on the growth rate and growth/no growth interface of Byssochlamys fulva and Byssochlamys nivea. Food Microbiol. 2010; 27: 618-627.
Ratkowsky DA, Olley J, Mcmeekin TA, Ball A. Relationship between temperature and growth-rate of bacterial cultures. J Bacteriol. 1982; 149: 1-5. Salomão BCM, Massaguer PR, Aragão GMF.
Isolamento e seleção de fungos filamentosos termorresistentes do processo produtivo de néctar de maçã. Ciênc Tecnol Aliment. 2008; 28: 116-121. Salomão BCM, Slongo AP, Aragão G M F. Heat
resistance of Neosartorya fischeri in various juices.
Lwt-Food Sci Technol. 2007; 40: 676-680.
Sant’Ana AS, Simas RC, Almeida CAA, Cabral EC, Rauber RH, Mallmann CA et al. Influence of package, type of apple juice and temperature on the production of patulin by Byssochlamys nivea and
Byssochlamys fulva. Int J Food Microbiol. 2010; 142: 156-163.
Silva PRS, Tessaro IC, Marczak LDF. Integrating a kinetic microbial model with a heat transfer model to predict Byssochlamys fulva growth in refrigerated papaya pulp. J Food Eng. 2013; 118: 279-288. Silva AL, Sant’Ana AS, Massaguer PR. Modelling the
lag time and growth rate of Aspergillus section Nigri
IOC 4573 in mango nectar as a function of temperature and pH. J Applied Microbiol. 2010; 109: 1105-1116.
Tassou CC, Panagou EZ, Natskoulis P, Magan N. Modelling the effect of temperature and water activity on the growth of two ochratoxigenic strains of Aspergillus carbonarius from Greek wine grapes. J Applied Microbiol. 2007; 103: 2267-2276.
Tribst AAL, Sant’Ana AS, Massaguer PR. Microbiological quality and safety of fruit juices - past, present and future perspectives. Crit Rev Microbiol. 2009; 35: 310-339.
Valik L, Pieckova E. Growth modelling of heat-resistant fungi: the effect of water activity. Int J Food Microbiol. 2001; 63: 11-17.
Wyatt MK, Parish ME, Widmer WW, Kimbrough J. Characterization of mould growth in orange juice.
Food Microbiol. 1995; 12: 347-355.
Zimmermann M, Miorelli S, Massaguer PR, Aragão GMF. Modeling the influence of water activity and ascospore age on the growth of Neosartorya fischeri
in pineapple juice. Lwt-Food Sci Technol. 2011; 44: 239-243.