ISSN 1517-7076 artigo e-12231, 2018
Autor Responsável: Luiz Antonio Barbosa Data de envio: 22/03/2017 Data de aceite: 03/01/2018
10.1590/S1517-707620180004.0565
Influence of reaction temperature on the
generation of gels during EVA
production in tubular reactor
Luiz Antonio Barbosa 1, Ademir Anildo Dreger 2, Ruth Marlene Campomanes Santana 3, Eduardo Luis Schneider 4, Fernando Dal Pont Morisso 5,
1 Faculdades Integradas de Taquara, Av. Oscar Martins Rangel, 4500 (ERS 115), CEP 95600-000, Taquara, Rio Grande
do Sul , Brasil.
2 Faculdades Integradas de Taquara, Av. Oscar Martins Rangel, 4500 (ERS 115), CEP 95600-000, Taquara, Rio Grande
do Sul, Brasil.
3 Universidade Federal do Rio Grande do Sul - UFRGS, LAPOL - Laboratório de Materiais Poliméricos, Processamento
e Reciclagem Campus do Vale - Bloco IV - Prédio 43.426 - sala 115 Cx. Postal 15010 Av. Bento Gonçalves, 9500, Agronomia, 91501-970, Porto Alegre, Rio Grande do Sul, Brasil.
4 Universidade Federal do Rio Grande do Sul - UFRGS, Departamento de Engenharia de Materiais, Campus do Vale,
Setor IV – Prédio 43426, Av. Bento Gonçalves, 9500, 91509-900, Porto Alegre, Rio Grande do Sul, Brasil.
5 Universidade Feevale, Laboratório de Estudos Avançados em Materiais, Curso de Mestrado Profissional em Tecnologia
de Materiais e Processos Industriais, Instituto de Ciências Exatas e Tecnológicas, Campus II, ERS 239, 2755, CEP 93525075, Novo Hamburgo, Rio Grande do Sul, Brasil.
e-mail: [email protected], [email protected], [email protected], [email protected], [email protected]
ABSTRACT
The fouling formation in the EVA production leads to an increase in the residence time of the material. This result is a favorable condition to generation of the crosslinks during the polymerization. The crosslinking allows raising the molar mass of the polymer, which after the polymerization reaction are characterized as gels, thus generating problems in the product quality during production due to contamination of the resin. This paper describes the fouling process in the reactor, the defouling mechanism, the crosslinking, the scis-sion of chain and presents a study on the influence of the reaction temperature in relation to the formation of gels by quantitative analysis by Optical Controller System - OCS. The average temperature rise of the reac-tion at 10 ºC, helped to reduce the generareac-tion of gels due to the viscosity reducreac-tion over the reactor, which reduces the polymer residence time in the walls of the tube and consequently the formation of fouling. Keywords: Crosslinking, fouling, tubular reactor, EVA, OCS.
1. INTRODUCION
In plants producing poly(ethylene-co-vinyl acetate) EVA, a recurring problem is the formation of gels during
and after synthesis of polymerization. According to Henk (2015), the gels are any visible imperfection in polyethylene film [1]. Contamination in polyolefin film by the formation of gels is a phenomenon that is dif-ficult to predict, reproduce and resolve. This paper discussed the generation of gels formed from crosslinking which is the result of unintended mixing of polymers of different density, molecular weight or type of comonomer during polymerization.
truder balloon, sticking and causing stop in process of transformation EVA [3].
The objective of this work is to study the influence of the reaction temperature with respect to genera-tion of crosslinking, with two and three reacgenera-tions during the producgenera-tion of poly(ethylene-co-vinyl acetate)
EVA
in a reactor tubular
. The study considers that, in lower temperatures there is fouling formation in the reactor tubes, which increases the residence time of the polymer and allows generation of crosslinks. The importance of this study when compared to other production methods, lies in the increase of product quality when applied to the manufacture of tubular films that requires high transparency.1.1 Production Process of LDPE and EVA
The low density polyethylene (LDPE) and EVA production system includes three sections in the process: the compression unit, the reactor and schemes product separation. The process consists in compressing ethylene gas with high purity to the tubular reactor under high pressure (1000 to 3000 atm) and heat until the reaction initiation temperature and to control in 140-330 °C range. In the reactor is where begin the polymerization reactions by free radicals. Polymerization in chains of monomers can be initiated by injection into the reactor of initiator compounds such as oxygen and or organic peroxides or by physical conditions such as radiation or heat [4-9].
The polymerization through free radical ethylene in the presence of various initiators and chain trans-fer agents (CTA) under supercritical conditions of pressure and temperature of reaction, are injected into the reactor entry into additional quantities of ethylene and initiators, these injections in additional multipoint along the reactor length, with objective to achieve greater productivity and give the resin the desired proper-ties.
Free radical initiators are the chemicals which, under certain conditions, initiate chemical reactions and produce free radicals. These radicals are reactive chemical species that have a free electron (not connect-ed or unpairconnect-ed). The radicals may also have positive or negative chargconnect-ed species that carry a free electron (ionic radical). The initiator-derived free radicals are very reactive chemical intermediates and generally have short life times, half-live of less than 10-3s [10].
The typical LDPE is a branched polymer formed by polymerization process via free radicals. In this polymerization type the polymer chain transfer reactions are significant, because they form an active radical in a main chain. This radical active, propagates mainly to form a long chain branching, but can lead to chain scission [11].
Once formed, the radicals undergo two basic types of reactions: the propagation and termination reac-tions. In a propagation reaction, the radical reacts to form a covalent bond and a new radical. The three most common propagation atom abstraction reactions are, β-scission and the double carbon-carbon bonds or aro-matic rings. In a termination reaction, two radicals interact with each other in a destructive reaction, wherein both radicals form covalent bonds, and the reaction ceases. The two most common reactions are terminated coupling and unproportional reaction. Since the reaction is a chain propagation reaction, it has become the most significant aspect of commercial chemical free radicals. The chain reactions by radicals are involved in many business processes [12].
As the pressure of the reaction medium is increased, the LDPE molar mass tends to increase due to the higher number of ethylene monomers in proximity to the end of the growing chain, thereby promoting chain growth, resulting in a product with molar mass in the order of the average molar mass Mw de 3 a 5,8x10⁵ g.mol-1 [13]. The increased reaction temperature increases the level of LDPE branching, which re-duces the degree of crystallinity and density. The higher temperatures promotes the random motion of grow-ing chains, thereby increasgrow-ing the likelihood of intramolecular chain transfer reactions. Thus, various molecu-lar properties of the polymer and the productivity are defined by the reaction conditions, which establishes control of the free radical mechanism. The high operating temperatures can reach close to 350 °C and result in unsafe operation conditions, favoring the decomposition reaction [14].
BARBOSA, L.A.; DREGER, A.; SANTANA, R.M.C., et al. revista Matéria, v.23, n.4, 2018.
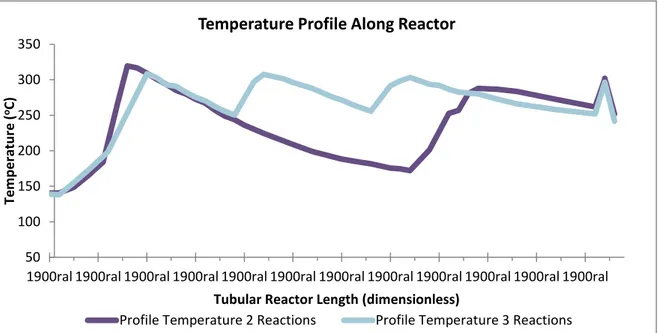
Figure 1: Temperature profile along the tubular reactor with two and three reactions.
In the LDPE polymerization reactors also known as "high pressure low density" or HPLD, the polymerization mechanism is a reaction of free radicals leading to the formation of long chain branches, LCB, that can be as long as the main backbone polymer [15]. The free radical mechanism also leads to the for-mation of short chain branches, typically one to five carbon atoms long [16].
1.2 Tubular Reactor
The model tubular reactor used in the production of LDPE shows the behavior near the plug flow reactor (PFR). A tubular reactor for production of LDPE is composed of metallic spiral pipe and its extension, the ratio of length and diameter. The total length of this reactor, is between 500 and 3000 meters, while its inner diameter can reach 60 millimeters [4,17]. The reactors are equipped with a control valve located at the reac-tor outlet which opens periodically to produce a pressure pulse, which generates an increase in speed and the polymer rips out of the tube wall [18,9]. The axial speeds are also high, usually around 10 m.s-l [9].
A tubular reactor typically LDPE, consists of a complex configuration of reaction zones and intercon-nected cooling that usually can be divided into three distinct regions: (a) pre-heating region where the mon-omer is heated by hot water or steam up until polymerization temperature; (b) reaction region, where occurs, the conversion of part ethylene to polyethylene; and (c) product cooling region where the formed polymer is cooled until the end of the reaction [19].
The polymerization reaction is highly exothermic, the heat generated by the reaction must be ex-changed with the refrigerant passing through the jacket of the reactor. The conversion of a typical tubular reactor is of the order of 20 to 35% [19, 14, 17].
1.3 Fouling in Reactor
The fouling is described in the literature as an insulating polymer film on reactor tube wall caused by phase separation or by a hydrodynamic boundary layer rich viscous polymer [20]. During the polymerization of the LDPE process stream is monophasic, but the fouling is caused by the formation of two phases of a mixture of polyethylene and ethylene fluids in the reactor tubes due to temperature low enough to cause phase separa-tion. Almost all of the process stream is monophasic, where the mixture of fluid has two phases in the bound-ary layer near the reactor wall due to temperature low enough, it causes phase separation. The polymer rich phase is deposited on the inner wall of the reactor, which considerably reduces the heat transfer rate, as illus-trated in Figure 2. Tw is the reactor wall tube temperature; Tf the fouling temperature; T1 the temperature at the fouling surface.
50 100 150 200 250 300 350
1900ral 1900ral 1900ral 1900ral 1900ral 1900ral 1900ral 1900ral 1900ral 1900ral 1900ral 1900ral
Tem
p
e
ratu
re
(
oC)
Tubular Reactor Length (dimensionless)
Temperature Profile Along Reactor
Figure 2: Representation of the layer of fouling along the wall of the reactor tube [21].
At a given condition of temperature and reactor pressure, the temperature of the inner wall of the reac-tor tube is the critical parameter that determines when fouling occurs, this must be controlled by coolant tem-perature. This phase separation occurs in the coldest region of the tubular reactor tube. Figure 3 represents the radial temperature profile in the reactor tube and the heat flow direction [21, 22]. Where, Tw is the reactor wall tube temperature; Tf the fouling temperature; T1 the temperature at the fouling surface; and TP is the process temperature.
Figure 3: Radial temperature profile in the reactor tube [21].
1.4 Mechanism of Defouling
According Bucheli et al. (2005), defouling is the removal of polymer scale layer that is attached to the inner
wall of the tubular reactor tube. In normal operation, the polymerization plant in tubular reactors, utilizes two defouling mechanisms: the pressure control valve of the reactor opens and closes in controlled purge cycles, causing drag of the polymer in the tube wall owing to speed fluid [21]. The efficiency of this effect is de-pendent on the distance from the valve [23] and the operation in the reactor is called purge or bamping; (b) another way is the thermodynamic defouling through the temperature increase in the wall tube at the reactor or increase coolant fluid temperature to remove fouling deposits. Increasing the reactor wall temperature causes a subsequent increase in the incrusted polymer temperature, this allows the incrustation becomes de-tached from the surface, being carried by the flow of ethylene, thereby reducing the thickness of the fouling layer [22].
1.5 Chemical Degradation
Chemical degradation can be evidenced by the presence of contaminants, which may be catalyst or initiator residues, monomer impurities or additives. Some of these contaminants are not reactive under inert atmos-phere and without light, but when exposed to light in the presence of oxygen become degrading agents effec-tive. Thus, chemical degradation is classified as: external chemical agents, and chemical agents internal to the polymer [24;25].
Chemical degradation occurs not only when the polymer is exposed to some aggressive chemical agent but may also occur due to contamination during the industrial process, such as catalyst residues, initia-tors, impurities in the monomer, or even by external etching agents, Such as lubricating oils, fuels, metal ox-ides. Among the chemical processes that can interfere in the degradation of the polymer, oxidation is one of the most common, being called thermo-oxidation. During processing, the chemical degradation starts from free radicals that are attacked by oxygen, that processes may occur and that modify the properties of the pol-ymers, such as chain breaks and crosslinking [24;25].
T1
Fouling
Tw
Flow
Tf
BARBOSA, L.A.; DREGER, A.; SANTANA, R.M.C., et al. revista Matéria, v.23, n.4, 2018.
1.6 Thermal degradation
The sensitivity of the polymers to temperature depends on the structure and type of chemical bond present in the polymer chain. Degradation consists of a process of reactions involving the scission of polymer backbone bonds and the formation of others and consequently the change of the chemical structure and the reduction of the molar mass, which implies changes in the physicochemical properties. The complete decomposition of a polymer involves a complex of reactions that may be endothermic and / or exothermic. The endothermic re-actions are related to processes of bond rupture, depolymerization and volatilization. Exothermic processes are generally associated with oxidation reactions [26;24].
There are several chemical mechanisms of thermal decomposition of polymers: (i) random chain scis-sion, in which the division occurs at apparently random locations in the polymer chain; (ii) scission in the final chain, wherein individual monomer units are successively removed at the end of the chain; (iii) chain removal, wherein atoms or groups that are not part of the polymer chain (or backbone) are cleaved; And (iv) cross-linking, whereby linkages between polymer chains are created [27].
Thermal degradation of the thermoplastic copolymer, polyvinylacetate (EVA), produced at different relative concentrations between the comonomers, the degradation temperature range is between 250 and 400 °C, quantitatively producing acetic acid during this process. Polyethylene is a more stable polyolefins and begins to degrade from 400 oC with C-C bond breakage and crosslinking, forming very few volatile products. In the EVA copolymer, the formation of acetic acid begins long before any breakage of C-C chem-ical bonds occurs in the main chain, with two well defined degradation stages occurring [28].
Thermo-degradation occurs through the action of heat, chemical attack or shear (residence time). The-se phenomena exert a accented effect on its thermal stability, causing the loss of property by reaction with the oxygen present in the atmosphere, forming oxidized products of low molar mass and carbon dioxide (CO2). The thermo-oxidation occurs due to the presence of oxygen according to a mechanism that comprises four steps: initiation, propagation, branching and termination [29].
1.7 Crosslinks
The crosslinks reactions are those leading to the formation of insoluble and infusible polymers in which the chains are attached and form a three-dimensional network structure, called crosslinking [30,31, 32,33].
The reticule formation, hinders approximation of chains and the molecular interactions which reduces the sliding of the same ones, increasing the mechanical strength and thus tend to become insoluble and infu-sible polymer. During the crosslinking, branching of the polymer chains are recombined forming a polymer with a molar mass very high or considered infinite. A polymer is considered to have infinite molar mass, when the value measured is greater than the molar mass of the analysis equipment can measure [30,31,34].
According Tamboli et al, (2004) polyethylene crosslinking process occurs in four phases: initiation, propagation, branching and termination. Figure 4 shows an example of the mechanism by crosslinking poly-ethylene energy radiation abstraction of hydrogen and the generation of free radical in the polymer chain [31].
CH
2CH
2CH
2CH
2CH
2CH
2CH
2CH
2CH
2CH
2CH
2CH
2CH
2CH
2CH
2CH
2CH
2CH
2CH
2CH
2Polyethylene
CH
2CH
2CH
2CH
2+
2
Figure 4: Crosslink polyethylene by high-energy radiation, adapted of Paoli, (2008) [24].
al groups can react then these chains are connected by means of a new link C-C, forming a giant polymer molecule in the medium reaction [36].
2 CH2 CR CH2 CHR CH2 CHR
CH2 CR CH2 CHR CH2 CHR
CH2 CR CH2 CHR CH2 CHR
Figure 5. Example of EVA crosslinking reaction, adapted of Paoli, (2008) [24].
1.8 Scission of Chain
The chain scission is the breaking of a chemical bond, when energy applied to the chemical bond is greater than the bonding energy. This energy may be provided by light, gamma radiation, heat or shear (mechanical disruption). One of the features that allows the split is when the chain has a binding of lower energy than the simple carbon bond (C-C) de 83 kJ mol-1 [24,37].
In the case of polyethylene, produced by polymerization by addition reactions, the breaking of the chemical bond in the main chain will correspond to the breaking of a single C-C bond, reducing the molar mass of the polymer chain. The scission of the C-C bonds may be homolytic or heterolytic. Homolithic scis-sion corresponds to the breaking of the covalent bond with an electron remaining attached to each fragment, forming two free radicals. In heterolithic scission, the electron pair becomes attached to one of the negatively charged fragments (anion) and the other fragment will be deficient of positively charged electrons (cation). The most commonly observed is homolytic scission, which generates alkyl macroradicals. Heterolytic scis-sion occurs in some situations where the polymeric material is exposed to energies much higher than the binding energy and produces ions (cations and anions) and radical ions [24].
The scission of carbon bonds (C-C) can occur by breaking the covalent bond where electrons remain in the fragment, forming two free radicals or by exposure to more higher binding energies producing íons and radicals [32].
The thermal scission is the chemical bond breakage by the thermal effect, where the energy of the connection depends on several factors such as the number branching of the polymer, the kinds of substituents along the polymer chain and the existence or absence of defects originated by polymerization. Mechanical scission of chemical bonds can occur in polymers when they are subjected to a shear stress [24].
BARBOSA, L.A.; DREGER, A.; SANTANA, R.M.C., et al. revista Matéria, v.23, n.4, 2018.
2. MATERIALS AND METHODS
The methodology used in this work consists of removing one of the three polymerization reactions during the EVA production. During the polymerization with three reactions, peak temperatures are lower due to the con-trol of the polymer properties. The removal of a reaction will allow operate with higher temperature peaks, this fact will help reduce fouling in the reactor due to increasing the resin temperature and, consequently, an increase in temperature in the wall of the reactor tube.
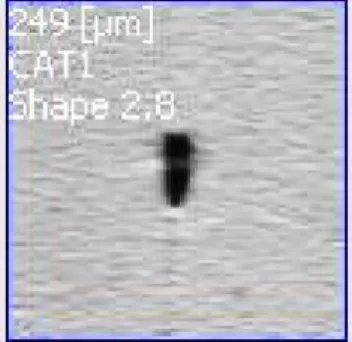
The quality control method applied to the resins used in the production tubular film is determined by amount of contamination by gels. The method of analysis can be established by optical detection. This tech-nique has online impurities inspection system, with the flat or tubular film, by detecting with high resolution camera and special lighting system developed by Optical Controller System - OCS, by calculating the bright-ness using the software reading is FSA100. The system facilitates the recognition of gels as optically recog-nizable defects in the film. The Gels are distributed in pre-established categories and the defects are assigned to the relevant section of the film.
The reading of the gels was carried out on flat film with a thickness of 38 ± 5 μm, 2.5 m2, which cor-responds to 42 m long and 0.075 m wide, where it was determined the number of defects per 2.5 m2 and by category, according shown in Table 01. In this study, only the results of category 1 - CAT1 gels were consid-ered. CAT is the category of classification of gels according to their size.
Table 1: Classification of gels by their dimensions.
CATEGORY
DIMENSIONS OF GELS
01
up to 0,5 mm
02
>0,5 to 1 mm
03
>1 to 1,5 mm
04
>1,5 mm
Figure 6 shows an image photograph of the gel taken at the OCS machine, of the EVA film, during the film analizing process.
Figure 6: Photograph of a gel in the CAT1 held by OCS.
The results found were analyzed through statistical methods, to establish a correlation of results gels found as two three polymerization reactions.
3. RESULTS AND DISCUSSIONS
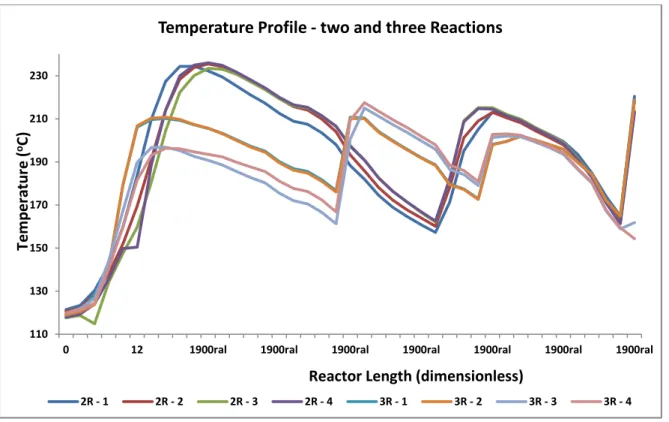
profile of temperature with two reactions was 11 °C above the temperature with three reactions.
Figure 7: Temperature profile along the tubular reactor with two and three reactions.
It can be seen in Figure 8, the temperature distribution along the tubular reactor at high pressure in a steady state, where we can see and compare the profile with two and three reactions is during the experiment. It was not possible to increase further the temperature according to the control limit in the fluidity index of the resin.
Figure 8: Temperature profile along the tubular reactor with two three reactions.
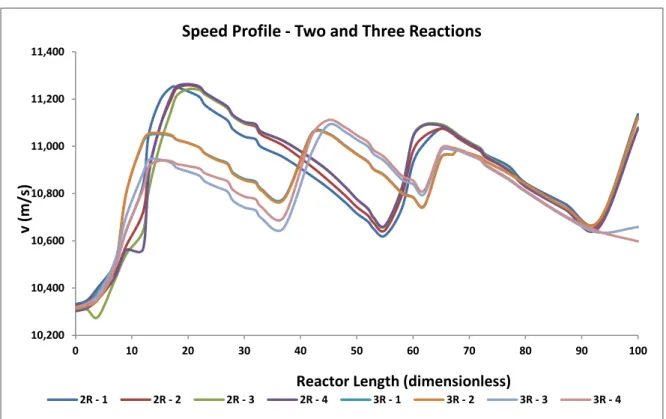
Figure 9, we can see the profile of velocity as a function of reaction temperature, concerning operating time with two three reactions. The average results of speed for the better and the worst result with two reac-tions the speed value was 10,91 m.s-1 with 223 gels and 10,91 m.s-1 with 866 gels. With three reactions with speed of 10,88 m.s-1 and 185 gels, to 10,84 m.s-1 and 896 gels.
1900ral 1900ral 1900ral 1900ral 1900ral 1900ral 1900ral 1900ral 1900ral 1900ral 1900ral 1901ral 1902ral 1902ral 1903ral 1904ral 1904ral 1905ral
1 11 21 31 41 51 61 71 81 91 101 111 121 131 141 151 161 171 181 191 201 211
A v e rag e te mp e ratu re r e ac ti o n ( oC) N u mb e r o f G e ls - C A T1
Number of Samples
CAT1 - 3 reactions CAT1 - 2 reactions Average Temp Reactor 3 reactions Average Temp Reactor 2 reactions
110 130 150 170 190 210 230
0 12 1900ral 1900ral 1900ral 1900ral 1900ral 1900ral 1900ral
T
e
mp
e
ra
tu
re
(
oC)
Reactor Length (dimensionless)
Temperature Profile - two and three Reactions
BARBOSA, L.A.; DREGER, A.; SANTANA, R.M.C., et al. revista Matéria, v.23, n.4, 2018.
Figure 9: Velocity profile of the gas along the tubular reactor with two three reactions.
The results analyses obtained through statistical methods using the MINITAB software, establish a correlation between the amount of gels met in the two and three polymerization reactions.
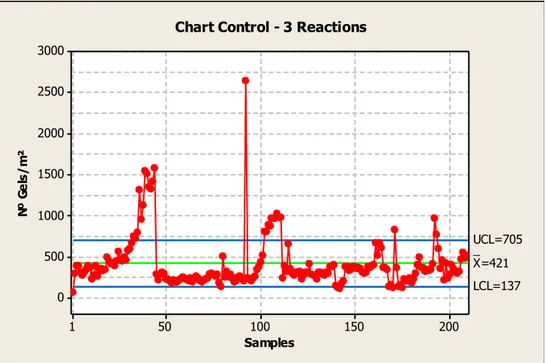
This experiment was used as the upper limit of process control (UCL), the given index in the product specification that is equal to 500 gels in CAT1.
Statistical analysis of the data regarding the film results in the polymerization process with two three reactions performed through the graphical analysis of the two cases identifies that it is out of statistical pro-cess control, signaling an alert in the production of the product, given that the chart points were outside the control limits.
Figure 10 shows a chart of the results with control samples to the amount of gels during the produc-tion of EVA with 3 reacproduc-tions, which gave an average X equal to 421, the control lower limit value in the (LCL) 137 and control upper limit (UCL) equal to 705 gels.
10,200 10,400 10,600 10,800 11,000 11,200 11,400
0 10 20 30 40 50 60 70 80 90 100
v
(
m
/s
)
Reactor Length (dimensionless)
Speed Profile - Two and Three Reactions
Figure 10: Control chart with the results gels in CAT1, with 3 reactions.
Figure 11 shows a control chart with results of the samples to the amount of gels during the produc-tion of EVA 2 reacproduc-tions, which gave an average X equal to 303, the control lower limit (LCL) 108, the boundary UCL control top equal to 498 gels.
Figure 11: Control Letter to the results of gels in CAT1, with 2 reactions.
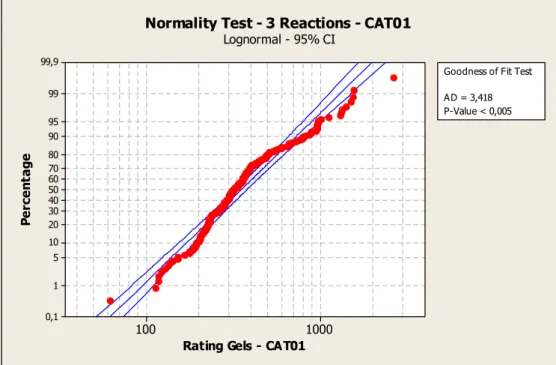
The normal analysis by Anderson-Darling was performed and demonstrated the data distribution was not normal because P-value < 0.05. Because of robustness regarding the use of control charts and calculation capability preferred to not transform the data set (using the Box-Cox procedure) in a lognormal, distribution as shown in Figures 12 and 13. The data of the process reactions were normal in 3 with P-value < 0.05 and not normal reactions were 2 with P-value < 0.044, very close to an acceptable value is 5%.
Samples
N
º
G
e
ls
/
m
²
200 150
100 50
1 3000
2500
2000
1500
1000
500
0
_ X=421 UCL=705
LCL=137 Chart Control - 3 Reactions
Samples
N
º
G
e
ls
/
m
²
150 100
50 1
3000
2500
2000
1500
1000
500
0
_ X=303 UCL=498
BARBOSA, L.A.; DREGER, A.; SANTANA, R.M.C., et al. revista Matéria, v.23, n.4, 2018.
Figure 12: Test normal through the lognormal results in gels CAT1, with 3 reactions.
Figure 13: Test by normal lognormal results in gels CAT1, with 2 reactions.
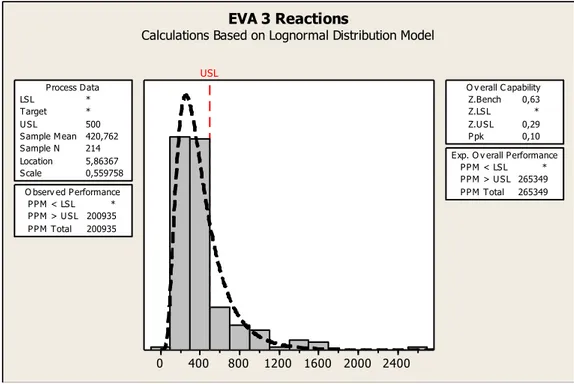
Based on Six Sigma methodology, it can observe the process capability index in Figure 14 which shows the results of the analysis of gels in the film through the OCS for 3 reactions. Through these indices can be seen that the process is unable to meet specifications and produce products with a minimal margin defects. The Cpk and Ppk are below the minimum specified values, and Cpk = 0.56 and Ppk = 0.10 (greater than 1.67 are considered satisfactory). The ZBench index found for the total process capacity (Overall Capa-billity), was ZBench = 0.63 Sigma, demonstrating that the process quality levels and product are not meeting specifications. The number of defects per million in the process (Overall Performance) was 265349 PPM, featuring 2 sigma process as not meeting the criteria for acceptance.
Rating Gels - CAT01
P e rc e n ta g e 1000 100 99,9 99 95 90 80 70 60 50 40 30 20 10 5 1 0,1
Goodness of Fit Test
A D = 3,418 P-Value < 0,005 Normality Test - 3 Reactions - CAT01
Lognormal - 95% CI
Rating Gels - CAT01
P e rc e n ta g e 1000 100 99,9 99 95 90 80 70 60 50 40 30 20 10 5 1 0,1
Goodness of Fit Test
A D = 0,772 P-Value = 0,044 Normality Test - 2 Reações - CAT01
Figure 14: Capabiliy index in gels in CAT1, with 3 reactions.
Capability index shown in Figure 15 through the lognormal distribution with the results of film analy-sis by OCS to two reactions show that the process is able to meet specifications and produce product with a minimum margin of defects. The Cpk and Ppk indices are below the minimum specified values, and Cpk = 0.95 and Ppk = 0.30 (greater than 1.67 to be satisfactory). The ZBench index found for the total process ca-pacity (Overall Capabillity), was ZBench = 1.37, demonstrating that the levels of quality of process and product are meeting the specifications. The number of defects per million in the process (Overall Perfor-mance) was 84739.1 PPM, featuring The process currently meets the customer's requirements, and at 3 sigma.
Figure 15: Capabiliy index in gels in CAT1, with 2 reactions.
2400 2000 1600 1200 800 400 0
USL
P rocess D ata
S ample N 214
Location 5,86367
S cale 0,559758
LS L *
Target *
U S L 500
S ample M ean 420,762
O v erall C apability
Z.Bench 0,63
Z.LS L *
Z.U S L 0,29
P pk 0,10
O bserv ed P erformance
P P M < LS L *
P P M > U S L 200935
P P M Total 200935
E xp. O v erall P erformance
P P M < LS L *
P P M > U S L 265349
P P M Total 265349
EVA 3 Reactions
Calculations Based on Lognormal Distribution Model
900 750 600 450 300 150 0
USL
P rocess D ata
S ample N 177
Location 5,61382
S cale 0,43729
LS L *
Target *
U S L 500
S ample M ean 302,96
O v erall C apability
Z.Bench 1,37
Z.LS L *
Z.U S L 0,91
P pk 0,30
O bserv ed P erformance
P P M < LS L *
P P M > U S L 67796,6
P P M Total 67796,6
E xp. O v erall P erformance
P P M < LS L *
P P M > U S L 84739,1
P P M Total 84739,1
EVA 2 Reactions
BARBOSA, L.A.; DREGER, A.; SANTANA, R.M.C., et al. revista Matéria, v.23, n.4, 2018.
4. CONCLUSIONS
Through this study it can be seen that the results in CAT1 gels are directly influenced by the formation of fouling in the reactor, due to the increased residence time in the reactor. The physical and thermal conditions in the reactor and other steps of the production process EVA which favor a reduction of residence time are not important for crosslinking and consequent generation of gels in the polymer. The temperature has a deci-sive role in the viscosity of the mixture in the reaction medium, confirming to the processing of the polymer throughout the reactor and reducing the residence time for fouling.
Performance results in gels, are strongly related to the operating temperatures than the number of reac-tions, but working with two reactions allowed raise the average temperature of the reaction medium and, maintain control of the variables that determine the melt index.
This study may be expanded to other reaction conditions or process so that the statistical analysis of the data are within the statistical process control.
5. ACKNOWLEDGMENTS
The authors thank PPGE3M-UFRGS and the University Feevale, for providing all infrastructure for the de-velopment of this research.
6. BIBLIOGRAPHY
[1] HENK L. Gel formation during extrusion of LDPE and LLDPE., 2015 Retrieved from
http://pisa.org.za/files/Henk%20Lourens%20paper.doc
[2] BARBOSA, L. A. Estudo da geração de crosslinking durante a fabricação de EVA/PEBD. Dissertação
de M.Sc., Universidade Feevale, Novo Hamburgo, Rio Grande do Sul, Brasil, 2013.
[3] ROMAN, A. Polietileno PEBD – Processos de Transformação. Editora Érica Ltda, São Paulo, 1997.
[4] KIPARISSIDES, C., VERROS, G., MACGREGOR, J. F. “Mathematical modeling, optimization, and quality control of high-pressure ethylene polymerization reactors”,Journal of Macromolecular Science, v. 4,
pp.437-527, 1993.
[5] KWAG, B. G., CHOI, K. Y. “Modeling of a multistage high-pressure ethylene polymerization reactor”,
Chemical Engineering Science, v.49, pp.4959-4969, 1994.
[6] PEACOCK, A. J. Handbook of polyethylene, strutures, porperties, and aplications. Editado por Marcel
Dekker, Inc. New York, 2000.
[7] NEUMANN, G. A. Modelagem de um reator tubular de alta pressão para produção de PEBD.
Disserta-ção de M.Sc., Universidade Federal do Rio Grande do Sul, Porto Alegre, 2001.
[8] CHIEN, I-L., KAN, T. W., CHEN, B. “Dynamic simulation and operation of a high pressure ethylene-vinyl acetate (EVA) copolymerization autoclave reactor”,Computers & Chemical Engineering, v.31, n.3,
pp.233–245, 2007.
[9] ASTEASUAIN, M., TONELLI, S. M., BRANDOLIN, A., et al., “Dynamic simulation and optimisation
of tubular polymerization reactors in gPROMS”,Computers and Chemical Engineering, v.25, n. 4–6), pp.
509–515, 2001.
[10] GRILLER, D., INGOLD, K. U. “Persistent Carbon-Centered Radicals”,Accounts of Chemical Research,
v.9, n.1, pp.13-19, 1976.
[11] TOBITA, H. “Free-Radical Polymerization with Long-Chain Branching and Scission: Markovian Solu-tion of the Weight-Average Molecular Weight”,Macromolecular Theory and Simulations, v.23, pp. 477–489,
2014.
[12] ASPEAK. Initiators, free-radical. Encyclopedia of Polymer Science and Technology, 2015. Retrieved
from http://aspeak.shahrmajazi.com/Upload/subdomain/aspeak/article/aspeak1391-11-9-23-27-4Initiators, Free-Radical%20(www.aspeak.net).pdf.
[13] PLADIS, P., KIPARISSIDES, C. “A comprehensive model for the calculation of molecular weight long-chain branching distribution in free-radical polymerizations”,Chemical Engineering Science, v.53, n.18,
pp.3315-3333, 1998.
[14] KOLHAPURE, N. H. Computational fluid dynamics for design and optimization of tubular low-density polyethylene reactors, Dissertation Doctor of Philosophy Major: Chemical Engineering, Iowa State
[15] FLORY, P. J. “The Mechanism of Vinyl Polymerizations”,Journal of The American Chemical Society,
v. 59, n.2, pp. 241–253, 1937.
[16] ROEDEL, M. J. “The Molecular Structure of Polyethylene I. Chain Branching in Polyethylene during Polymerization”, Journal of The American Chemical Society, v.75, n. 24, pp.6110–6112, 1953.
[17] ERDEGHEM, V., PETER, M. M, LOGIST, F., et al., “Model based optimisation of tubular reactors for
LDPE production”, In: Preprints of the 8th IFAC Symposium on Advanced Control of Chemical Processes The International Federation of Automatic Control Furama Riverfront, Singapore, 2012.
[18] KIPARISSIDES, C., VERROS, G., PERTSINIDIS, A. “On-Line Parameter Estimation in a High-pressure Low-Density Polyethylene Tubular Reactor”,AIChe Journal, v. 42, n.2, pp. 440–454, 1996.
[19] MAN, C. W. Modelagem Matemática e Aplicação de Rede Neuronal no Sistema de Copolimerização de Oleifinas a Alta Pressão, Tese de D.Sc., Escola Politécnica, Universidade de São Paulo, 1995.
[20] SEBASTIAN, F., CASTAÑEDA-ZUÑIGA, D. M., NEUTEBOOM, J. D. P., et al., “Fouling in the High
Pressure LDPE Process: Experimental and Computational Investigation Approach”,Macromolecular Symo-sia, v.360, pp. 78–86, 2016
[21] BUCHELLI, A., CALL, M. L., BROWN, A. L., et al., “Modeling Fouling Effects in LDPE Tubular
Polymerization Reactors. 1. Fouling Thickness Determination”,Industrial & Engineering Chemestry Re-search, v. 44, pp. 1474-1479, 2005.
[22] MYKHAYLO, K., KUNDE, C., MANGOLD, M. “Simulation and Nonlinear Analysis of the Stagnant Polymer Layer in a LDPE Tubular Reactor”, In: Proceedings of the 22nd European Symposium on Computer Aided Process Engineering, pp. 17 - 20, London. Retrieved from, 2012.
[23] LACUNZA, M. H., UGRIN, P. E., BRANDOLIN, A., et al., “Heat Transfer Coefficient in a
High-Pressure Tubular Reactor for Ethylene Polymerization”, Polymer Engineering & Science, v. 38, n.6, pp.
992-1013, 1998
[24] PAOLI, M. A. Degradação e Estabilização de Polímeros. Segunda versão on-line Retrieved from , 2008. http://www.chemkeys.com/blog/wp-content/uploads/2008/09/polimeros.pdf
[25] GOMES, L.B. Avaliação da degradação em solo simulado de filmes de polietileno com aditivos pró-degradantes após exposição ao envelhecimento acelerado., Trabalho de Conclusão do Curso, Universidade
de Caxias do Sul, Caxias do Sul, 2010.
[26] CANEVAROLO Jr, S. V. Ciência dos Polímeros. Artiliber Editora Ltda, São Carlos, 2004.
[27] BEYLER, C. L., HIRSCHLER, M. M. Thermal decomposition of polymers. SFPE handbook of fire
pro-tection engineering, v. 2, pp. 111-131, 2002
[28] RODRÍGUEZ-VÁZQUEZ, M., LIAUW, C. M., ALLEN, N. S., et al., “Degradation and stabilisation of poly (ethylene-stat-vinyl acetate): 1–Spectroscopic and rheological examination of thermal and thermo-oxidative degradation mechanisms”, Polymer Degradation and stability, v.91, n.1, pp.154-164, 2006.
[29] SCOTT, G. “Initiation processes in polymer degradation”,Polymer Degradation and Stability, v. 48, pp.
315-324, 1995.
[30] KRUPA, I., LUYT, A. S. “Thermal properties of uncross-linked and cross-linked LLDPE/wax blends”,
Polymer Degradation and Stability, v.70, n.1, pp.111–117, 2000.
[31] TAMBOLI, S. M, MHASKE, S. T, KALE, D. D. “Crosslinked polyethylene”, Indian Journal of Chemi-cal Technology, v.11, pp.853-864, 2004.
[32] LABARTA, J. A. R., OLAYA M. M., MARCILLA, A. “DSC and TGA study of the transitions involved in the thermal treatment of binary mixtures of PE and EVA copolymer with a crosslinking agent”, Polymer, v.
47, n.24, pp.8194–8202, 2006.
[33] AKCELRUD, L. Fundamentos da Ciência dos Polímeros. Editora Manole Ltda, São Paulo, 2007.
[34] SOARES, B. G., LUCAS, E. F., MONTEIRO, E. E. C. Caracterização de Polímeros – Determinação de peso molecular e análise térmica. E-papers Serviços Editoriais Ltda, Rio de Janeiro, 2001.
[35]. LUGÃO, A. B. Estudos da síntese por irradiação, da estrutura e do mecanismo de formação de poli-propileno com alta resistência do fundido., Tese de D.Sc., Instituto de Pesquisas Energéticas e Nucleares,
BARBOSA, L.A.; DREGER, A.; SANTANA, R.M.C., et al. revista Matéria, v.23, n.4, 2018.
[36] STELESCU, M. D., MANAILA, E., CRACIUN, G., et al., “Crosslinking and grafting ethylene vinyl acetate copolymer with accelerated electrons in the presence of polyfunctional monomers”, Polymer Bulletin,
v. 68, n.1, pp. 263-285, 2012
[37] CALLISTER, W. D. J. Fundamentos da Ciência e Engenharia de Materiais – Uma Abordagem Inte-grada. LTC – Livros Técnicos e Científicos Editora S.A., Rio de Janeiro, 2006.
[38] RIBEIRO, R. P. Efeito da radiação gama no comportamento in vitro de um copolímero bioabsorvível.
![Figure 3: Radial temperature profile in the reactor tube [21].](https://thumb-eu.123doks.com/thumbv2/123dok_br/16319278.719091/4.892.241.670.406.626/figure-radial-temperature-profile-reactor-tube.webp)
![Figure 4: Crosslink polyethylene by high-energy radiation, adapted of Paoli, (2008) [24]](https://thumb-eu.123doks.com/thumbv2/123dok_br/16319278.719091/5.892.133.783.827.993/figure-crosslink-polyethylene-high-energy-radiation-adapted-paoli.webp)