Influence of granulometry, cement content, and
moisture in the mechanical performance of the
cemented crushed stone
Kharine Prado¹, Fernando Silva Albuquerque², Guilherme Bravo de Oliveira Almeida³ 1Federal University of Sergipe, Postgraduate in Civil Engineering, [email protected]
2Federal University of Sergipe, Postgradua.on in Civil Engineering, [email protected] 3Federal University of Sergipe, Postgradua.on in Civil Engineering, [email protected]
Recebido:
4 de outubro de 2018
Aceito para publicação:
21 de janeiro de 2020
Publicado:
30 de abril de 2020
Editor de área:
Jorge Barbosa Soares
ABSTRACT
The Cemented Crushed Stone (C2, as the South African Classifica.on) was widely used on the main high-traffic Brazilian highways in the 1970s and 1980s. However, it presents several limita.ons for its use in the road work related to the proper.es of the material and its almost fragile nature, since as soon as the large varia.ons in the tensile strain take place along the loading cycle, cri.cal and accelerated degrada.on also occur, lead-ing to material fa.gue distress. Several factors stand out as probable causes for the in-tense and rapid process of fa.gue, the main ones being: granulometry, cement content, and moisture content. In this way, a study was carried out to analyze the mechanical proper.es of C2 based on granulometry varia.on in rela.on to the cement and moisture content. It was noted that the mixture with the best joint performance was the one with the highest percentage of the sand frac.on, highest cement content, and molded below the op.mum moisture. Some recommenda.ons were made for the mix design of C2, such as the defini.on of a granulometric range that considers the analysis of the aggre-gate large/small ra.o in order to obtain a greater gain of maximum dry specific mass, as well as the use of cement contents above 4%, since below that the cementa.on will be insufficient. In addi.on, op.mized ra.os (aggregate + cement + water) should be de-fined by performing the mechanical analyzes listed in this paper, in order to select the best performance mixture to be applied in the road works.
Keywords:
Cemented Crushed Stone, Mix Design,
Mechanical Performance Improvement.
DOI:10.14295/transportes.v28i1.1861
1. INTRODUCTION
A more durable pavement has been a major challenge for Road Engineering. The signi icant in-crease in traf ic volume, excessive loads, and inferior quality of materials have caused a reduc-tion in pavement durability due to accelerated fatigue damage. Thus, knowledge of the charac-teristics of the materials that make up the base and sub-base layers becomes necessary for de-termining the allowable stresses and strains, in order to avoid early damage to the pavement structure.
Cement treated materials are an alternative for making up pavement layers due to their abil-ity to reduce plastic deformation and avoid fatigue demage while reducing tensile stresses (ME-DINA & MOTTA, 2015). Cemented Crushed Stone (C2, as the South African Classi ication) is a type of cemented material derived from the composition, produced by mixture in a factory, of crushed fractions with various diameters, in which a small amount of Portland cement is used
to bind the aggregates. This requires the addition of water in order to reach the maximum dry apparent density in the compaction process and for cement hydration (DER/PR, 2005; YEO et al., 2011; XUAN et al., 2012).
Despite the fact that C2 has been widely used in the mid-20th century as a base layer on high-volume roads, it has been subject to several criticisms, limitations, and changes (SILVA et al., 2013). The presence of micro-cracks, inherent to the C2 mixture, reduces the stored elastic en-ergy, reducing the effective elasticity modulus of the material, resulting in cracks and crevices that, by re lection, reach the coating layer, causing early deterioration of the pavement (BALBO, 2006; MEDONÇA & ALBUQUERQUE, 2017).
The usual C2 mix design methods used in Brazil (ABNT, 2013a; DER/SP, 2005; DER/PR, 2005) specify several granulometric ranges of aggregates and cement contents that vary from 3% to 5%, to meet certain criteria of uncon ined compressive strength. However, regarding the strain of the pavement, a more careful analysis of the type and proportion of the materials that compose the mixture (granulometry, cement content, and moisture content) should be consid-ered, in order to provide resistance to the pavement layer to support the dynamic loads result-ing from the vehicle traf ic, and to provide greater durability.
Among the mix design aspects (granulometry, cement content, and moisture content) that are pointed out as responsible for the low structural performance of C2, the granulometry has been the target of several considerations by some authors (Chen et al., 2008; U.S. DOT, 2013; SAPEM, 2014). Those comments are concerned with grain size, since large sizes (≥ 32mm) cause segregation during launching or compaction, and with the type of granulometric distri-bution, since it presents an in luence on the strength gain. Also important is the cement content that, when in excessive levels, causes damage such as cracking by shrinkage, resulting in re-strictions in cement mixtures (Silva et al, 2013; Marodin, 2010). Finally, the moisture content is a fundamental parameter in the C2 mix design for the resistance gain and in the increase of porosity of the mixture (BALBO, 1993; 2002).
Therefore, this work aims to analyze the in luence of the particle size range, cement content, and moisture content on the mechanical performance of C2. Two granulometric curves were analyzed which are distinguished by the variation of their ine content (4.8mm passing material in the sieve), in three cement contents (3%, 4%, and 5%), and in the optimal and -1% optimal compaction moistures in the modi ied Proctor.
2. BIBLIOGRAPHIC REVIEW
Granular materials treated with cement are unique in engineering because they behave as a mixture between a "modi ied" (unbound) material and a chemically stabilized material, compa-rable to concrete. C2 is considered as a mixture composed of crushed material with a continu-ous and well-graded granulometry, in which 3% to 5% Portland cement and water are added, remaining, after compaction, with a heterogeneous aspect (ANDRADE et al., 2015).
The role of water is to facilitate the compaction of the mixture and hydrate the cement. A small amount of cement is used to bind the large aggregates that form point connections be-tween them, not surrounding them as occurs in concrete. Therefore, since C2 is the result of the interaction between the three elements (aggregate, cement, and water), the adequate propor-tion of these elements is important to de ine a mixture that is adequate and supports the con-ditions proposed for its use (YEO et al., 2011).
The materials stabilized with some type of hydraulic binder, intended for paving, develop tensile stress due to the bond between the cement matrix and the aggregate. The cemented layer might break if the cement matrix does not support the tensile stresses and, as a conse-quence, the tensile stresses on the cemented layer generate cracks that propagate as bottom-up cracks (YEO, 2011).
The mechanistic study of cemented materials is the analysis of their behavior in relation to stresses and strains when they are submitted to the cyclic loads derived from the vehicle traf ic. Therefore, the design of the C2 type mixture, to be de ined, must be experimentally analyzed regarding its mechanical behavior of compressive and tensile strength, requiring materials compatible with the cyclic loading demands, which should be resistant to crushing and fatigue, respectively.
The mechanical performance of C2 mixtures is the result of the interaction between two phases: the cemented matrix phase and the compacted granular skeleton phase. The irst will govern, with higher intensity, the mechanical strength of the mixture due to the bonding that occurs between the particles, being this phase in luenced by the type and content of cement and the curing conditions. The second phase will be responsible for the mechanical stability, and is mainly in luenced by the type of aggregate, the granulometry, and the degree of compaction (XUAN et al., 2012 and KLINSKY & FARIAS, 2016).
In this multiphase system (aggregate + cement paste), in which the C2 is located, the weakest connections are plasticized by rupture. During the entire pavement life, the layer will suffer modular degradation and the elasticity modulus will be constantly decreasing, due to the loss of longitudinal continuity of the layer by cracking, which in luences the de lectometric basins obtained in the ield and in the values of the backanalyzed elasticity modulus. However, on a smaller scale of the layer (e.g., specimen), it is possible to select fractions of the C2 presenting integrity and the same behavior as the original material (NASCIMENTO and ALBUQUERQUE, 2018). Also, C2 presents non-linear behavior of the resilience modulus evaluated by dynamic axial compression. Since there is an increase in the main tension, much due to the action of traf ic on the pavement, the material will be more rigid (MENDONÇA and ALBUQUERQUE, 2017).
However, many researches have analyzed C2 (Nascimento & Albuquerque, 2018; Motta & Ubaldo, 2015; Xuan et al., 2012; Marodin, 2010; Lim & Zollinger, 2003) in practical and theoret-ical studies, in the most diverse parameters throughout the years, but most have been con-cerned only with the mechanical properties of C2 in its hardened state. Few studies (Klisnky & Farias, 2016; Yeo, 2011) have dealt with mix design aspects (granulometry, cement content, and moisture content), leaving a great gap in this issue, where, as already seen, such mix design aspects are responsible for C2 structural performance.
In Brazil, different grain size speci ications have been developed for C2 based on the experi-ences of each highway agency. However, in all standards and technical speci ications, some pa-rameters are also followed. The C2 should have a well graded granulometry, with maximum aggregate diameter not exceeding 38mm and ines between 3% and 10% (pass through the sieve n⁰ 200) (DER/PR, 2005; DER/SP, 2005; ABNT, 2013b). Meanwhile, in countries such as Australia, France, Germany and Norway, in order to meet the strict resistance criteria, re-strictions are placed on the maximum grain size for this material (maximum: 20mm and mini-mum: 14mm). In contrast, in other countries such as Brazil and South Africa, it is common to
have a grading with a larger size range, whose maximum diameters are 38mm and 28mm, re-spectively, but with the latter presenting a larger amount in the sand fraction (BALBO, 1997; LCPC, 2003; DER/PR, 2005; DER/SP, 2005; MAIN ROADS, 2011; ABNT, 2013a; SAPEM 2014;). Some research (Klinsky and Farias, 2016; Yeo et al., 2011) have devoted attention to the anal-ysis of cement content in the development of the mechanical properties of the C2. It was found that the variation in cement content does not signi icantly alter the value of the maximum dry speci ic mass (γs), both in the intermediate (Brazilian practice) and modi ied Proctor compac-tion energy. The γs is dependent on the type of stone used and the type of grading established for the mixtures. In addition, they observed that the cement content in luences the strength gain in the C2 mixtures. The increase in the uncon ined compressive strength (UCS) and the indirect tensile strength (ITS) showed a linear behavior as a function of the increase in the cement content.
The moisture content is also seen as a key parameter in the C2 resistance gain. After experi-mental studies, Balbo (2002, 1993) concluded that it is advisable that the moisture content be analyzed in the C2 mix design in order to determine the amount of complementary water re-sponsible for the complete hydration of the cement.
Xuan et al. (2012) showed that there is a moisture threshold that critically in luences the development of the Uncon ined Compressive Strength (UCS) of the C2. Up to this moisture threshold, the UCS continues to increase and beyond this level, the UCS decreases. Therefore, the effects presented in C2 due to the variation of the moisture content might be understood in two aspects: the irst is that the amount of water, determined according to the compaction test, may be above the necessary moisture content for better arrangement of the grains and hydra-tion of the cement in the mixture. This will cause a reduchydra-tion in the speci ic mass of the mixture, as the voids are illed with water, making the distance between the grains greater. The second, the mixture with a higher amount of water, besides creating a distance between the grains, will promote the development of the cement gel towards the grains (Van Der Waals Forces), because along the hydration of the cemented materials, the excess water goes against the solid particles (aggregate), generating a thin ilm of water over the grain. In this way, the resistance gain will be impaired, because there will be more pores in the hardened grout (BALBO, 1997).
3. MATERIALS AND METHODS
3.1. Experimental Planning
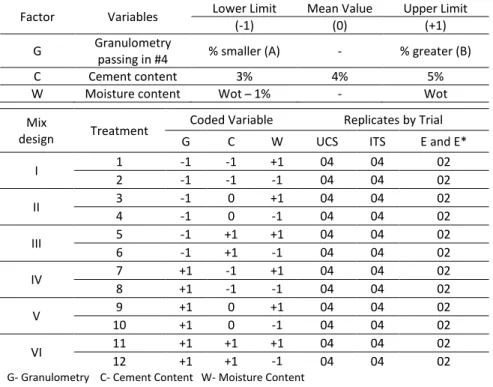
In this research, an experimental factorial planning was de ined by selecting two different gran-ulometric ranges in order to examine the mechanical behavior of C2 as a function of cement contents and predetermined moisture contents. Table 1 presents the complete factorial plan-ning taking into account the set of factors studied (granulometric range, cement content, and moisture content), applied in the three levels (lower, middle, and upper), which are indicated by codes (-1), (0), (+1), respectively. In addition, Table 1 is related to the amount of replicates (specimens) that were evaluated in each mechanical test in each of the 12 treatments.
The selected granulometric curves were differentiated by the ratio large/small aggregate. A granulometric curve, called "A", was de ined according to the speci ication of the granulometric range adopted in Brazil, according to the ET-DE-P00/009 technical speci ication of DER/SP (DER/SP, 2005), being widely used in the building of base and sub-base cemented layers of the main highways in the country. The second curve, called "B", was based on the South African
Pavement Engineering Manual (SAPEM, 2014), a country with a vast and updated study in ce-mented materials. Curves A and B are shown in Figure 1.
Table 1 – Seleção das empresas para estudo e respectiva frota, por tipo de motor Factor Variables Lower Limit Mean Value Upper Limit
(-1) (0) (+1)
G Granulometry
passing in #4 % smaller (A) - % greater (B)
C Cement content 3% 4% 5%
W Moisture content Wot ̶ 1% - Wot
Figure 1. Granulometric distribution of samples A and B. 0 10 20 30 40 50 60 70 80 90 100 0,01 0,1 1 10 100 %P a ss in g
Diâmetro das Partículas (mm)
Lower Limit - Sapem, 2014 Upper Limit - SAPEM, 2014 Sample B Lower Limit - DER/SP, 2005 Upper Limit - DER/SP. 2005 Sample A
#4 #200
Mix
design Treatment
Coded Variable Replicates by Trial
G C W UCS ITS E and E*
I 1 -1 -1 +1 04 04 02 2 -1 -1 -1 04 04 02 II 3 -1 0 +1 04 04 02 4 -1 0 -1 04 04 02 III 5 -1 +1 +1 04 04 02 6 -1 +1 -1 04 04 02 IV 7 +1 -1 +1 04 04 02 8 +1 -1 -1 04 04 02 V 9 +1 0 +1 04 04 02 10 +1 0 -1 04 04 02 VI 11 +1 +1 +1 04 04 02 12 +1 +1 -1 04 04 02
G- Granulometry C- Cement Content W- Moisture Content UCS – Unconfined Compressive Strength
ITS – Indirect Traction Strength E – Elasticity Modulus
3.2. Materials
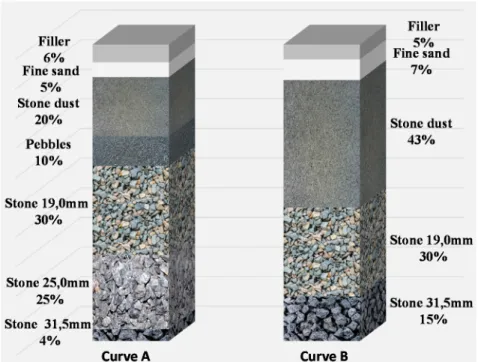
The aggregates of gneiss origin, with a shape index of 2.4 and Los Angeles abrasion loss of 16%, used in the granulometric composition of C2 mixtures, came from a quarry located in the Ca-jaı́ba village, in the municipality of Itabaiana/SE. In total, 6 (six) types of aggregates with differ-ent characteristic dimensions were collected (stone 31.5mm, stone 25.0mm, stone 19.0mm, stone dust, and iller). In addition, ine sand (maximum diameter of 0.3mm) was added to meet the content of ines (4.8mm passing material on the sieve) that were demanded by the granulo-metric ranges under analysis. This ine sand was acquired in the local commerce (construction material store), in Aracaju/SE. In Figures 2a and 2b, the images and granulometric curves of each aggregate are presented.
(a) (b) Figure 2. (a) granulometric curves of the aggregates (b) types of aggregate used in the mixtures.
The cement used was type PC II-Z-32 RS, i.e., Portland Cement (PC) composed with the addi-tion of pozzolan (Z) and Sulphate Resistant (SR), meeting the normative recommendaaddi-tions (ABNT, 2013a), besides being one of the classes of cement most used in the Brazilian civil con-struction and easily acquired in the local commerce. In this survey, cement contents ranging from 3% to 5% were used, determined based on the proportions that characterize crushed ma-terials as cemented, according to NBR 12261 (ABNT, 2013a), and the mixtures were molded both in the optimal moisture of compaction and in -1% optimal moisture.
The drinking water used was free of organic materials, oils, or other substances harmful to the hydration of Portland cement.
3.3. Design of mixtures
Based on the results obtained from the granulometry of each fraction of the aggregate, the com-bination of the aggregates was estimated, by attempt, in order to it them within the limits of the granulometric ranges (curves "A" and "B" of Figure 1). The proportions of each type of ag-gregate are presented in detail in Figure 3 for each curve A and B.
Curves A and B showed results of sand equivalent of the small aggregate (material passing through the 4.8mm sieve) of 70.6% and 73.0%, respectively. The real speci ic masses were also determined by weighting the speci ic masses of each aggregate that compose the C2 mixtures, according to the procedure described by BERNUCCI et al., (2006), and the results are described in Table 2.
Subsequently, the modi ied Proctor energy compaction tests were performed to determine the optimal moisture and the maximum dried density, for the 19mm sieve passing material, of the C2 samples obtained from curves A and B. The cement contents were de ined in 3%, 4%, and 5%, with the percentages in mass of all aggregates adjusted proportionally according to the cement contents used, that is, the proportion of each aggregate plus the addition of cement to-talled 100% in mass of the mixture. The test was performed according to the recommendations prescribed in the DNER-ME 162/94 Standard (DNER, 1994) and the results are presented in Table 2.
Figure 3. Summary of aggregate proportions for each Granulometric Curve
Table 2 – Results of the compacting test of the C2 samples
The specimens (BP) for the mechanical tests were moulded according to the moistures found in the compaction test, and according to each treatment envisaged (Wot and Wot-1) for the mix-tures, whereby, according to ABNT (2013a), the moistures may vary in a range of +/- 0.5% around the target humidity.
3.4. Mechanical Tests
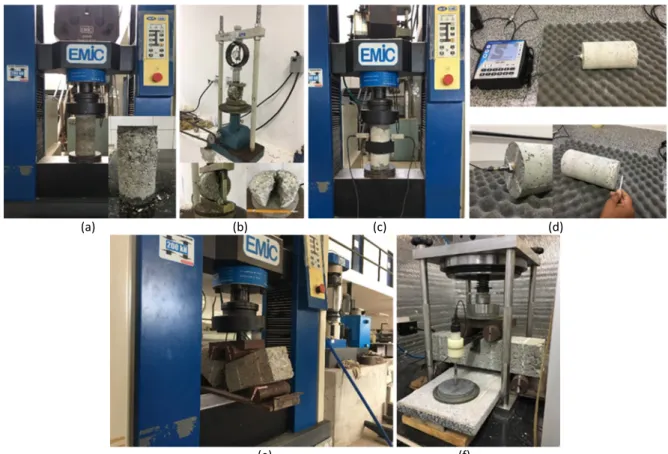
The evaluation of the mechanical properties of Cemented Crushed Stone mixtures comprised the Uncon ined Compressive Strength (UCS) and Indirect Tensile Strength (ITS) tests, for the curing periods of 7 and 28 days. Elasticity Modulus (E) and Longitudinal Dynamic Modulus (E*) tests were also performed for the age of 28 days. The tests are illustrated in Figure 4a, b, c, d, respectively.
Sample A B
Cement Content 3% 4% 5% 3% 4% 5%
Specific mass (g/cm³) 2.781 2.784 2.786 2.786 2.789 2.792
Maximum dried density (kN/m³) 22.46 22.47 22.61 22.72 22.60 22.36
Optimal moisture content (%) 9.0 9.2 9.7 8.2 8.8 9.8
For the UCS tests, cylindrical BPs with dimensions of 100mm in diameter and 200mm in height were molded, compacted in modi ied Proctor energy, and tested according to NBR 5739 (ABNT, 2007). While for the ITS test, BPs with dimensions of 100mm in diameter and 60mm in height were molded, compacted by impact in a single layer, as suggested by Austroads (2008), and tested as prescribed in the DNIT-ME-136/2010 standard (DNER, 2010).
(a) (b) (c) (d)
(e) (f)
Figure 4. Mechanical Tests: (a) Unconfined Compressive Strength, (b) Indirect Tensile Strength, (c) Elasticity Modulus,
(d) Dynamic Modulus, (e) Flexural Strength, and (f) Fatigue
The tests for deformability analysis of C2 mixtures (E and E*) were made on BPs of the same dimensions used in the UCS tests. As these were non-destructive tests, the same BPs were used for the E and E* tests. The elastic modulus test followed the recommendations of NBR 8522 (ABNT, 2008a) and determined the initial 30% tangent module of the UCS of the material. The dynamic modulus test followed the technical recommendations prescribed in ASTM Standard C215/2014, which deals with the dynamic determination of elastic properties of materials from the natural frequency of vibration of a body, opting in this work for the longitudinal dynamic modulus.
3.5. Effect of parCcle size, cement content, and moisture on C2 mix design
In this work, a factorial regression of the studied mechanical variables (UCS, ITS, E, E*), de ined as dependent variables, and their interaction with the assigned factors (granulometric curve - G; cement content - C; and moisture content - W), described as independent coded variables, were performed. The effect of each factor in the determination of the studied mechanical vari-ables was assessed (HAIER et al., 2005).
In the analysis the data that comprise the set of values of each mechanical property resulting from the laboratory tests, in the age of 28 days, were used. The software Statistica 7 was used to evaluate the effect of independent variables on the inference of the mechanical parameters studied. Statistica 7 is a product of Stafsoft and has a univariate and multivariate set of statistical tools. Through it, it was obtained the coef icients of the models, the standard error associated with each coef icient, the respective t-student value, with its degree of freedom, and the corre-sponding levels of signi icance (p-levels).
3.6. Tests for the C2 FaCgue Analysis
The use of fatigue test results on prismatic specimens under lexion stresses was proposed to perform the fatigue analysis of the studied C2 mixtures. Prior to the fatigue tests, it was neces-sary to determine the lexural strength, as a way to control the tensile stresses used in the fa-tigue test, which should be between 60 and 95% of the lexural strength (Austroads, 2008). The prismatic, molded for these tests, corresponded to the C2 mixture that presented the best relation between the indirect tensile strength and the other mechanical parameters (UCS, E, and E*). The results of these tests were also used for the mixture studied by Nascimento et al., (2018), which consists of a C2 mixture with a granulometry in the range A, with 3% cement and optimum moisture. This analysis proposal was due to the need of material savings, test time, and because it was believed that the fatigue performances of all the other studied mixtures would be within the spectrum of the two mixtures mentioned.
To determine the lexural strength in four points of the C2, 3 (three) prismatic specimens with dimensions of 100mm×100mm×400mm, as speci ied in the NCHRP protocol (2014), were cast and tested after 28 days of curing without immersion in water (Figure 4e), with loads ap-plied in the L/3 ratio (in the middle third of BP).
The fatigue test was of the lexural type with stress-controlled, a method adopted for mate-rials cemented by AUSTROADS (2008), using the same load application frame of the lexural strength test, however, with the application of cyclic loads of 1 Hz (Figure 4f) until BP rupture or until reaching one million cycles.
4. RESULTS AND DISCUSSION
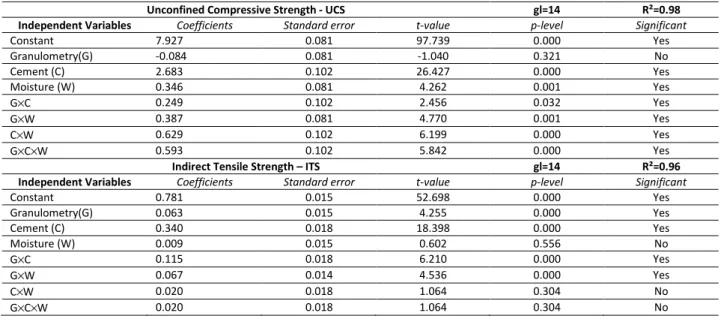
Table 3 presents the results of the laboratorial experiments of the mechanical properties (UCS, ITS, E, E*) in each treatment given to the C2 mixtures (see Table 1), according to the established cure periods (7 and 28 days). In the sequence, Table 4 presents the results of factorial regres-sions derived from the suggested factorial planning, in order to evaluate the effects of factors (G, C, W) on the performance of each mechanical property, analyzed for the values at 28 days of curing performed through the interpretation of the coef icients of each term of the model. Also, based on the factorial analysis, it was possible to identify spurious data (errors) from possible failures in the experimental procedure, which are highlighted in Table 3. The data were consid-ered spurious when their associated residual error (difference between the measured value and the value inferred by the model) exceeded 20% of the measured value. In this condition, the regressions presented in Table 4 were obtained from a fractional factorial plan (Montgomery et al., 2014).
In Table 4 the coef icients of each factor were evaluated by the p-level value (probability as-sociated to the signi icance level), in which there would be signi icance if this value was less than or equal to 0.05 (≤ 5%), that is, considering a 95% con idence level.
In addition, the results of the mechanical properties, for 28 days of cure, with the exception of spurious data, were arranged in curves, which correlate with the type of sample and moisture (Wot and Wot-1) as a function of the cement content. This curve allowed us to interpret more clearly how the analyzed variables (G, C, W) contributed to the variation of the mechanical pa-rameters studied (Figure 5).
Table 3 – Results of the tests performed in the experimental programme in the different treatments
Granulometric
Range Treatment
UCS (MPa) ITS (MPa) E (GPa) E* (GPa) 7 days 28 days 7 days 28 days 28 days 28 days
A 1 3.88 5.71 0.39 0.44 5.4 14.2 4.15 5.11 0.40 0.43 6.6 12.8 2 4.86 5.67 0.35 0.50 6.1 12.2 4.11 5.64 0.35 0.50 8.5 15.8 3 4.90 7.70 0.36 0.67 9.6 21.9 5.40 8.60 0.36 0.65 10.2 21.3 4 6.02 6.18 0.77 0.91 11.1 20.2 6.44 6.61 0.76 0.85 11.3 19.1 5 7.48 10.58 0.61 0.88 13.9 24.3 7.24 10.12 0.63 0.89 13.9 23.2 6 6.78 10.48 0.63 0.85 14.1 25.6 8.28 10.42 0.73 1.05 15.3 25.6 B 7 4.47 4.51 0.31 0.36 7.5 14.1 4.68 4.33 0.30 0.43 6.5 12.5 8 3.12 5.07 0.27 0.37 6.7 13.9 3.23 5.72 0.28 0.35 8.0 15.3 9 6.60 8.49 0.54 0.98 11.2 21.1 6.04 8.66 0.61 0.99 9.9 20.2 10 5.29 7.13 0.52 0.78 10.1 17.4 4.78 8.44 0.50 0.73 10.5 17.6 11 5.76 7.32 0.45 1.35 16.4 24.7 5.18 6.62 0.38 0.92 13.6 22.3 12 5.72 8.77 1.02 1.17 15.2 22.7 5.54 8.86 0.89 1.21 13.4 23.8
Spurious data suppressed for possible experimental errors.
Table 4 – Factorial regression results for the analyzed mechanical parameters: UCS, ITS, E and E*
Unconfined Compressive Strength - UCS gl=14 R²=0.98 Independent Variables Coefficients Standard error t-value p-level Significant
Constant 7.927 0.081 97.739 0.000 Yes Granulometry(G) -0.084 0.081 -1.040 0.321 No Cement (C) 2.683 0.102 26.427 0.000 Yes Moisture (W) 0.346 0.081 4.262 0.001 Yes G×C 0.249 0.102 2.456 0.032 Yes G×W 0.387 0.081 4.770 0.001 Yes C×W 0.629 0.102 6.199 0.000 Yes G×C×W 0.593 0.102 5.842 0.000 Yes
Indirect Tensile Strength – ITS gl=14 R²=0.96 Independent Variables Coefficients Standard error t-value p-level Significant
Constant 0.781 0.015 52.698 0.000 Yes Granulometry(G) 0.063 0.015 4.255 0.000 Yes Cement (C) 0.340 0.018 18.398 0.000 Yes Moisture (W) 0.009 0.015 0.602 0.556 No G×C 0.115 0.018 6.210 0.000 Yes G×W 0.067 0.014 4.536 0.000 Yes C×W 0.020 0.018 1.064 0.304 No G×C×W 0.020 0.018 1.064 0.304 No
Table 4 – Factorial regression results for the analyzed mechanical parameters: UCS, ITS, E and E* (continuation)
Tangential Elasticity Module – E gl=14 R²=0.96 Independent Variables Coefficients Standard error t-value p-level Significant
Constant 10.471 0.151 69.395 0.000 Yes Granulometry(G) -0.096 0.151 -0.635 0.537 No Cement (C) 3.450 0.202 17.073 0.000 Yes Moisture (W) -0.301 0.151 -1.992 0.070 No G×C -0.275 0.202 -1.361 0.199 No G×W 0.333 0.151 2.205 0.048 Yes C×W 0.193 0.202 0.954 0.359 No G×C×W -0.032 0.202 -0.159 0.876 No
Longitudinal Dynamic Model – E* gl=14 R²=0.96 Independent Variables Coefficients Standard error t-value p-level Significant
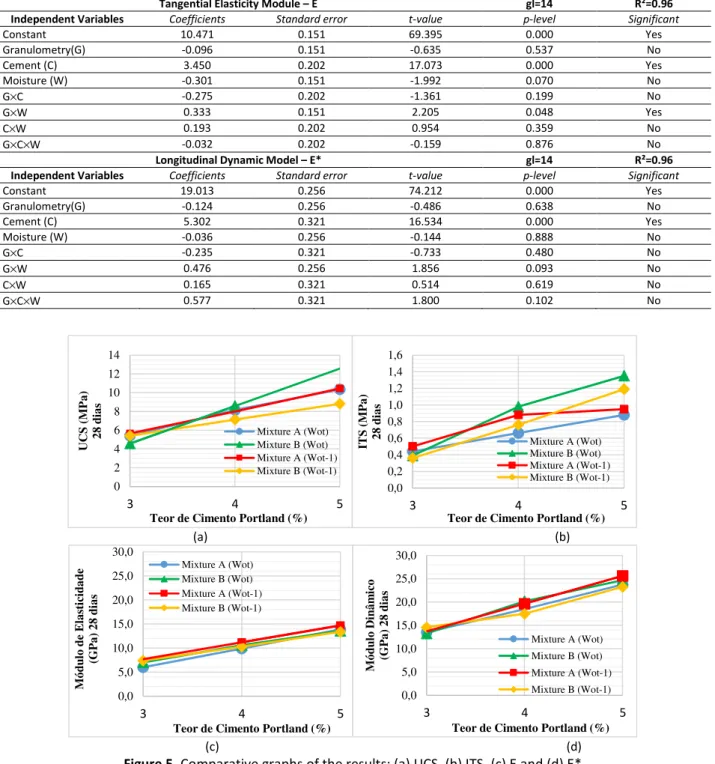
Constant 19.013 0.256 74.212 0.000 Yes Granulometry(G) -0.124 0.256 -0.486 0.638 No Cement (C) 5.302 0.321 16.534 0.000 Yes Moisture (W) -0.036 0.256 -0.144 0.888 No G×C -0.235 0.321 -0.733 0.480 No G×W 0.476 0.256 1.856 0.093 No C×W 0.165 0.321 0.514 0.619 No G×C×W 0.577 0.321 1.800 0.102 No (a) (b) (c) (d) Figure 5. Comparative graphs of the results: (a) UCS, (b) ITS, (c) E and (d) E*
In the sequence, the main analyses for each factor studied (G, C, W) are highlighted individually.
4.1. GRANULOMETRIC DISTRIBUTION CURVE
Based on the results, it is observed that although the values obtained from the UCS (Table 3) exhibit some difference regarding the type of granulometry, the factorial regression analysis con irms that there was no in luence of this factor on the results (p-level>5%) (Table 4). How-ever, the granulometric range, interacting with the other factors (cement and moisture) resulted in a great signi icance in the analysis, con irming the tendency of increase of the UCS value,
0,0 0,2 0,4 0,6 0,8 1,0 1,2 1,4 1,6 3 4 5 IT S ( M P a ) 2 8 d ia s
Teor de Cimento Portland (%)
Mixture A (Wot) Mixture B (Wot) Mixture A (Wot-1) Mixture B (Wot-1) 0 2 4 6 8 10 12 14 3 4 5 U C S ( M P a ) 2 8 d ia s
Teor de Cimento Portland (%)
Mixture A (Wot) Mixture B (Wot) Mixture A (Wot-1) Mixture B (Wot-1) 0,0 5,0 10,0 15,0 20,0 25,0 30,0 3 4 5 M ó d u lo d e E la st ic id a d e (G P a ) 2 8 d ia s
Teor de Cimento Portland (%)
Mixture A (Wot) Mixture B (Wot) Mixture A (Wot-1) Mixture B (Wot-1) 0,0 5,0 10,0 15,0 20,0 25,0 30,0 3 4 5 M ó d u lo D in â m ic o (G P a ) 2 8 d ia s
Teor de Cimento Portland (%)
Mixture A (Wot) Mixture B (Wot) Mixture A (Wot-1) Mixture B (Wot-1)
when a granulometry with greater percentage of materials in the sand fraction (0.05mm to 4.8mm) is applied in the optimal moisture. The curves of Figure 5a con irm the direction of sample B (Wot) in presenting a better behavior regarding the resistance gain, although only in cement contents above 4%.
On the other hand, the granulometry was a determining factor in the ITS gain. The granulo-metric range with higher sand content, curve B, provided higher ITS gain, con irmed by the re-sults (Table 3) and factorial regression analysis (Table 4). Moreover, it was found that the inter-action of a granulometry with a higher sand frinter-action content (sand + stone dust) and cement, resulted in a higher void illing. Thus, due to the greater contact between the particles, the gel formed by the cement agglutinated the small grains, binding them to the large ones. Thus, sam-ple B proved to be more ef icient in the ITS results.
In the analysis of the elasticity modulus test, presented in Tables 3 and 4 and Figure 5c, re-garding the particle size variation, they present a behavior similar to that observed for UCS. The differences in particle size were not signi icant regarding the stiffness gain of the mixture, the modulus values did not vary substantially for the same treatment levels assigned to the mixture. However, in the interaction between granulometry and moisture, the slope of sample B is
con-irmed in the largest gain of speci ic dry weight, providing a higher intermeshing of the com-pacted aggregates and higher stiffness gains.
As with the elasticity modulus, the results of longitudinal dynamic modulus did not suffer interference from the particle size curves analyzed in this research. Tables 3 and 4 and Figure 5d con irm that the stiffness gain of C2 mixtures was not related to the granulometric range, with very similar results being found in the same cement content.
4.2. Cement Content
According to the UCS results, presented in Table 3, the cement content increase from 4% to 5% in the sample with range particle size B, molded in the Wot (28 days), showed a drop in the resistance value of approximately 19%. This behavior is not common in the C2 mixtures and this data was considered spurious in the factorial regression due to the possibility of some ex-perimental error, such as: excess of moisture, lack of homogenization of the mixture, or differ-ence in the analyzed granulometric range. However, Figure 5a shows that sample A (28 days), presented a linear growth of the UCS as a function of the cement content: from 3% to 4% cement there was an average gain of 50% in the Wot and 13% in the Wot-1, while from 4% to 5% there was an average increase of 27% in the Wot and 63% in the Wot-1. Table 4 con irms that the factor with highest signi icance in the UCS gain was the cement content. In this case, the higher the cement content in the mixture, the higher was the result of the UCS. Since cement depends on the water content for its hydration and resistance gain, it is noted that the interaction with highest signi icance was between cement and moisture, with the mixture in optimal moisture being the one favored in this study.
According to the results of Table 4, and as it happened for UCS, the factor which showed the highest signi icance in ITS was cement, since the t-value and coef icient of the coded variable (C) are the highest in this model, showing a higher effect in the determination of the ITS value, since all variables are coded in the same scale (-1 to +1). According to the results, the higher the cement content, the higher will be the ITS gain. By observing the results presented in Table 3, a linear growth of ITS is observed, as a function of the cement content. However, this study re-vealed that the highest ITS gain was observed in a variation from 3% to 4% cement, for both
mixtures (A and B), molded in Wot and Wot-1, at 28 days of cure. In the type A mixtures, it obtained an average increase of 60% in the ITS and in the type B mixtures, the average gain exceeded 100%. It might be seen from Figure 5b that sample A presented a linear behavior according to the cement content and under the same analysis sample B obtained a better re-sponse from ITS regarding the increase of cement content. For each 1% of cement added, in this sample, the resistance increased 0.48MPa.
Table 3 shows that the stiffness gain for the elasticity modulus in mixtures with curves A and B is a function of the cement content, as it was already predicted and con irmed in the factorial analysis (Table 4). In this analysis, the only factor that presented signi icance in this mechanical parameter was cement. The higher the cement content, the higher the stiffness of the mixture after curing.
Likewise the elasticity modulus, the values of the longitudinal dynamic modulus were pre-sented mainly as a function of the cement content. It is clear from Table 4 that the only factor that presented signi icance in the longitudinal dynamic module was the cement content. From the results, it was possible to realize that the increase in the cement content was responsible for the stiffness gain of the mixture. It is observed in Figure 5d that the sample with curve A (Wot and Wot-1) has a linear behavior, in which the increase of stiffness in the mixtures depends on the increase of the cement content. In the case of the samples with curve B, molded in the optimal moisture, the highest peak of growth of the longitudinal dynamic module (52%) is be-tween 3% and 4% of cement. However, for samples in the same granulometric curve, molded in the moisture below the optimum, the highest gain in the value of the longitudinal dynamic mod-ule is between 4% and 5% cement, which was approximately 33%. For the 3% cement, similar to the elasticity modulus, the value of the longitudinal dynamic modulus, between the samples with curves A and B, did not present signi icant variation.
4.3. Moisture Content
Regarding the molding moisture, from the results presented in Table 3, it might be seen that the samples with curve A, molded in Wot and Wot-1, at 28 days of curing, showed linear behavior regarding the resistance growth. The factorial analyses show that the moisture is an in luential factor in the UCS gain. The mixtures molded in the Wot showed a greater tendency of resistance growth.
Table 4 shows that in the factorial analysis moisture is not a signi icant factor for the ITS gain. This is apparent when analyzing Figure 5b, where it is possible to notice that the molding hu-midity has not in luenced the results of the tensile strength of the samples with curves A and B for the 3% cement content, because they presented close values. However, for samples molded with 4% and 5% cement contents, and at 28 days of curing, the behavior was different for sam-ples with A and B curves, where, for the irst, the samsam-ples molded in Wot-1 presented a better performance for ITS, while, for the second, the best performance was for samples molded in Wot.
The samples with the granulometric B curve, molded in the Wot, obtained a better behavior among the C2 mixtures studied in this research, both for UCS and ITS. In a general analysis of the Wot and Wot-1 molded samples, with a curing time of 28 days, it was noticed that the sam-ples with B curve presented results of indirect tensile strength 34% higher in average than the samples with A curve. However, the compressive strength of the samples with curve A, in 3% cement, exceeded by 13% those of the sample with curve B.
Even not being a signi icant factor in the stiffness gain, concerning the elasticity modulus of the analyzed C2 mixtures, it might be noticed that the 1% reduction of the optimum moisture in the samples with particle size curve A produced mixtures with higher stiffness (on average 14% higher than those molded in the optimum humidity). For samples with B curve the values were quite similar.
As for the other mechanical parameters, the longitudinal dynamic modulus is not in luenced by the moisture content in the factorial regression analysis. However, there is a tendency for moulded mixtures with a B-grain size curve in Wot to perform better than moulded samples in Wot-1. Reverse behavior is observed in the samples molded with particle size curve A.
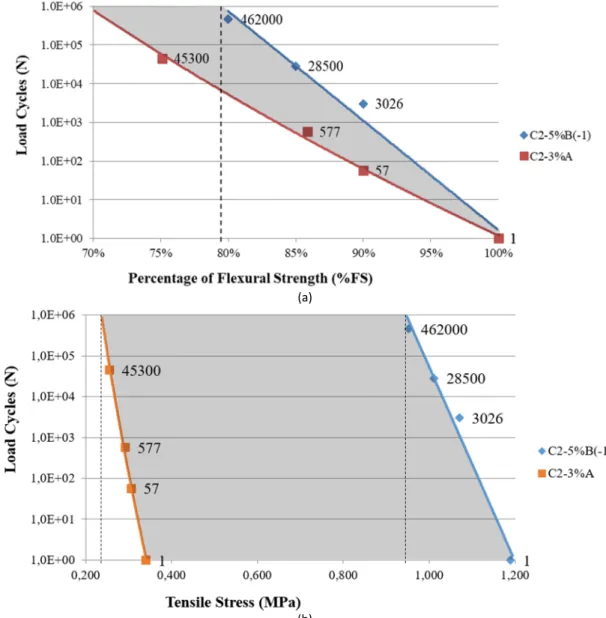
4.4. FaCgue Load Test
The best performances observed in the criterion of best relation between the indirect tensile strength and the other mechanical parameters (UCS, E, and E*) were for the BGTC-5B(-1) mix-ture, being the one chosen for the fatigue studies of this work.
(a)
(b)
Figure 6. (a) Fatigue Load of C2 -3A and 5B(-1) versus the Percentage of Flexural Strength (b) Fatigue Load of C2 -3A
The average lexural strength test result for this mixture was 1.19MPa with a standard devi-ation of 0.035MPa. In the fatigue test the number N was determined, which represents the amount of cycles required for fatigue failure of the specimen at each stress level used, which were 80%, 85% and 90% of the lexural strength value.
Fatigue values were represented in a semi-logarithmic shape curves, which correlated the number of cycles (N) with the percentage lexural strength and with the lexural strength .The results of the present trial were compared with the results of the fatigue life study performed by Nascimento (2018) for a mixture of C2 with 3% cement, granulometry in the range A and optimum moisture, whose mean lexural strength result was 0.34MPa with standard deviation of 0.03MPa. The comparison of the analyses performed is in the curves presented in Figure 6a and 6b, respectively.
By analyzing the curves from the criteria described by AUSTROADS (2014) – which indicates one million cycles as the limit in which a C2 type cemented mixture reaches the undetermined effective fatigue lifetime – it was possible to highlight that, to reach this level, the 5B(-1) mixture analyzed in this study should have an acting stress below 0.93MPa, the equivalent to 79% of the lexural strength. Meanwhile, the mixture with 3% cement would have an inde inite effective fatigue life for a tension below 0.24MPa, corresponding to 70% of the lexural strength.
It should be noted that the difference in the absolute stress value below which the mixture would not rupture due to fatigue in service was already expected, mainly due to the different cement contents (Figure 6b). However, the difference relative to the percentage of the lexural strength is largely due to the granulometry choice (Figure 6a). There is great evidence, there-fore, that a mixture rich in cement and with a granulometry rich in the sand fraction (according to the granulometry B studied) is able to provide higher physical stability and a better mechan-ical performance to C2, much due to the higher availability of grout in the mixture matrix. Possibly, there is an ideal ine and crushed fraction for each cement content.
5. CONCLUSION
The objective of this study was to analyze the mechanical properties of Cemented Crushed Stone from the variation of granulometric ranges, cement content, and moisture content. Two granu-lometric ranges were used, the irst based on Brazilian standards, called A, and the other, called B, established according to the speci ication of the Republic of South Africa (SAPEM, 2014). The two differ by their content of ines (4.8mm material passing through the sieve) that make up the mixture. Three cement contents were also used (3%, 4%, and 5% - common to materials treated with cement) and two moisture contents, the optimal moisture and the -1% optimal moisture of the compaction curve in the modi ied Proctor.
Regarding the analysis of the granulometric ranges, the representative of the Brazilian stand-ard (range A) in the - 1% optimum moisture, proved to be more effective in resistance gain to uncon ined compressive strength and in the stiffness gain when the mechanical properties of the elasticity and dynamic modulus are evaluated. However, this study showed that the granu-lometric range B, in the -1% optimum moisture, meeting the Republic of South Africa speci ica-tion (SAPEM, 2014), provided greater indirect tensile strength gain to the C2 mixtures studied in this research. There is a great possibility that a granulometry with a higher percentage of sand fraction (0.05mm to 4.8mm) will provide better responses to the efforts to which they will be submitted in the pavement when applied to materials treated with Portland cement.
Higher values of tensile strength are preferable to C2 from the mechanical point of view, since it is a variable directly related to fatigue, which represents its main mechanism of damage in service.
This work revealed that the increase in cement content was responsible for the increase in tensile strength and rigidity of the C2 mixtures studied. This might be explained by the function that cement plays in the C2 mixture, providing higher cohesion by forming a cemented matrix capable of joining the aggregates in an attempt to obtain a more homogeneous material after the hydration process. However, the increase in the cement content makes the mixture more fragile and susceptible to retraction and cracks, which were not part of analyses in this research. Although, it is observed that the values of strength and modulus do not increase signi icantly when the content of cement varies from 4% to 5%, indicating that there is an ideal cement con-tent for a satisfactory mechanical performance for C2 type cemented mixtures.
Regarding the moisture content, the parameter that was directly in luenced by this factor was the uncon ined compressive strength, with higher values for the specimens molded in the optimum moisture. In general, the moisture content, when interacting with the granulometry and the cement, has in luenced the mechanical properties of the C2 mixtures studied. There was a tendency to more experimental errors in moulded mixtures in the optimum moisture. This might result in a susceptibility to increase the porosity of the mixtures and a mechanical per-formance lower than that of the moulded mixtures in the lower than optimum moisture. It might also cause cement to leach and reduce its speci ic mass, resulting in a mixture with less ability to withstand compression stresses.
Still regarding the moisture content, it may be seen that in mixtures with a higher fraction of ines (passing the 4.8mm sieve - band B) the molding in the optimum moisture gives a better performance in tensile strength, contrary to what was observed in mixtures with a lower frac-tion of ines (band A). In these mixtures, the molding in -1% optimum moisture might be the ideal. This result might have been caused by the process of obtaining mixtures of the C2 type, that is, by compaction. In mixtures with a higher fraction of ines, the amount of water required must be higher to obtain a good interaction between the particles, and consequently, more wa-ter is also needed for the hydration of the cement, which will confer the largest portion of re-sistance to the mixture. On the other hand, mixtures with a lower fraction of ines have a larger amount of large aggregates, promoting a lower need of water for the interaction of the grains and for the complete hydration of the cement. Therefore, it is necessary to evaluate a criterious method of moisture correction of the mixtures of the C2 type, since the compaction moisture acts effectively for materials with diameters less than 19mm (which are used in the test). Ag-gregates with a higher diameter represent inert materials, susceptible only to water absorption. Although it was not the mixture with the highest tensile strength, C2 5B(-1) was the one with the best relation between mechanical parameters (UCS, E, and E*) and the indirect tensile strength, being the one selected for the fatigue test. It was observed that this mixture with 5% of cement and high sand fraction content tended to resist more loading cycles when compared to the C2 mixture studied by Nascimento (2018), with low cementation (3% cement) and lower amount of sand fraction. C2 5B(-1) could effectively withstand stress cycles of up to 79% of its lexural strength, while C2 3A would withstand up to 70%. Therefore, denser mixtures with higher grout availability in the matrix tend to have a longer fatigue life. However, there is a great possibility that there is an ideal fraction of ines and crushes for each cement content studied,
and this factor should be investigated in the design of C2 mixtures, in order to obtain a denser mixture, with less voids, greater stability, and better mechanical performance.
ACKNOWLEDGEMENTS
To CNPq for the inancial support to carry out this research, from a project contemplated in the Public Notice MCTI/CNPQ/Universal 14/2014.
REFERENCES
ABNT (2007) NBR 5739: Concrete - Compression tests and cylindrical specimens Concreto. Brazilian Association of Technical Standards, Rio de Janeiro. Available in Portuguese.
ABNT (2008a) NBR 8522: Concrete – Determination of the static modulus of elasticity to compression. Brazilian Association of Technical Standards, Rio de Janeiro. Available in Portuguese.
ABNT (2013a) NBR 12261: Dosage of graded stone treated with cement - Procedure. Association of Technical Standards, Rio de Janeiro. Available in Portuguese.
ABNT (2013b) NBR 11803: Materials for cement-treated graded stone base or sub-base - Requirements. Association of Technical Standards, Rio de Janeiro. Available in Portuguese.
Andrade, L. R.; A. K. Kuchiishi; I. S. Bessa; K. L. Vasconcelos; L. L. B. Bernucci; I. A. Beja; J. M. Chaves (2015) Mechanical behav-ior of granular base layers and treated with cement on a very heavy road. Annals of the XXIX Transport Research and
Teaching Congress, ANPET, Ouro Preto, p.148-149. Available in Portuguese.
ASTM (2014)
A Standard Test Method for Fundamental Transverse, Longitudinal, and Torsional Frequencies of Concrete Speci-mens da American Society for Testing and Materials, ASTM C 215-14. 7p. DOI 10.1520/C0215-14.
AUSTROADS (2008)
Technical Report. The development and evaluation of protocols for the laboratory characterization of ce-mented materials. AUSTROADS.
AUSTROADS (2014) Cemented Materials Characterisation, Sidney.
Balbo, J. T. (1993)
Study of the mechanical properties of stone and cement mixtures and their application to semi-rigid pave-ments. Thesis (PhD in Engineering). Department of Transportation Engineering, Polytechnic School, University of São
Paulo, São Paulo. Available in Portuguese.
Balbo, J. T. (1997) High quality cement treated crushed stones for concrete pavement bases. International Purdue Conference
on Concrete Pavement Design and Materials for High Performance, 6th, Indiana, USA, p.195-207.
Balbo, J. T. (2002) Paving - Materials, Properties and Construction Techniques. Publishing company USP, São Paulo. Available in Portuguese.
Balbo, J. T. (2006) Cemented crushed stone: an assessment of its durability from the perspective of porosity, toughness and fracture. Transportation, volume XIV, number 1, p.45-53. ISSN: 1415-7713. DOI: 10.14295/transportes. V14i1.59. Availa-ble in Portuguese.
Bernucci, L. L. B;, L. M. G, Motta; J. B. Soares; J. A. P. Ceratti (2006) Asphalt paving: basic training for engineers. 1rd Edition. PE-TROBRAS. ABEDA, Rio de Janeiro. Available in Portuguese.
Chen, D.; T. Scullion; T. Lee; J. Bilyeu (2008) Results from a Forensic Investigation of a Failed Cement Treated Base. Journal of
Performance of Constructed Facilities, American Society of Civil Engineers (ASCE), 22(3), p. 143–153. DOI:
10.1061/(ASCE)0887-3828(2008)22:3(143).
DER/PR (2005) ESP-P16: Pavin: graduated cemented crushed stone. Paraná State Department of Highways, Paraná. Available in Portuguese.
DER/SP (2005) ET-DE-P00/009 - Technical speci:ication: sub-base or base of cemented crushed stone. Department of Highways of the State of São Paulo, São Paulo. Available in Portuguese.
DNIT (1994) DNER-ME 162: Soils - Compaction test using worked samples. National Department of Land Infrastructure. Rio de Janeiro. Available in Portuguese.
DNIT (2010) DNER-ME 136: Asphalt paving - Asphalt mixtures - Determination of traction by diametrical compression. National Department of Land Infrastructure. Rio de Janeiro. Available in Portuguese.
Haier, J. F.; R. E. Anderson; R. L. Tathan; W.O. Black (2005) Multivariate Data Analysis. Translated by Adonai Schlup Sant’ana e Anselmo Chaves Neto – 5rd ed., Publishing company Bookman, Porto Alegre, RS.
Klinsky, L. M. G.; V. C. Faria (2015) Effects of the variation of humidity and compaction energy on the parameters of Cemented Crushed Stone. Proceedings of the 45th Annual Paving Meeting and the 19th National Road Conservation Meeting, ENACOR, Brası́lia, DF. Available in Portuguese.
LCPC (2003) Pavement structures catalog. Technical guide for the use of Ile-de-France regional materials.
Lim S.; D. G. Zollinger (2003) Estimation of the compressive strength and modulus of elasticity of cement-treated aggregate base materials. Transportation Research Board 1837, Washington, p 30-38. DOI: 10.341/1837-04.
Main Roads Western Australia (2011) Speci:ications 501: pavements. Document No. 04/10110-04. Main Roads Western Aus-tralia, Perth.
Marodin, E. E. (2010) Sizing alternative for the BR-448 pavement: mechanistic analysis with the application of cemented crushed
stone. Thesis (Doctorate) - Federal University of Rio Grande do Sul, Porto Alegre. Available in Portuguese.
Medina, J.; L. M. G. Motta (2015) Paving mechanics. Publishing company INTERCIEZNCIA, 3rd Edition, Rio de Janeiro. Available in Portuguese.
Mendonça, A. T.; F. S. Albuquerque (2017) Critical analysis and adjustment of fatigue prediction models with incremental damage analysis for BGTC performed on semi-rigid asphalt pavement. Transport Magazine. p. 107-123. DOI:
10.14295/transport. v 25i2.1046. Available in Portuguese.
Montgomery, Douglas C.; Runger, George C. (2014) Applied Statistics and Probability for Engineers. John Wiley & Sons, Sixth Edition, United States of America.
Motta, L. M. G.; M. O. Ubaldo (2015) Discussion on Values of Resilience Module of Cemented Crushed Stone (BGTC).
43rd An-nual Paving Meeting, 17th National Road Conservation Meeting, ENACOR, Maceió. Available in Portuguese.
Nascimento. S. R.; F. S. Albuquerque (2018) Cement-based fatigue performance study. Transport Magazine. p. 21-36. DOI: 10.14295/transport v26i1.1358. Available in Portuguese.
NCHRP (2014) Characterization of Cementitiously Stabilized Layers for Use in Pavement Design and Analysis. National Cooper-ative Highway Research Program. Report 789. Washington, D.C. 82p. 2014.
SAPEM (2014) South African Pavement Engineering Manual. South African National Roads Agency Ltd.
Silva A. H. M.; J. M. Chaves; L. A. Aranha; L. L. B. Bernucci; K. L. Vasconcelos (2013) Evaluation of executive parameters for the construction of a thick layer of cemented base. Brazilian Congress of Highways & Concessions,8, São Paulo. Available in Por-tuguese.
U. S. (2013) Standards for Specifying Construction of Airports. Department of Transportation. (2013-DRAFT). Advisory Circu-lar. AC No. 150/5370-10G.
Xuan D. X.; L. J. M. Houben; A. A. A. Molenaar; Z. H. Shui (2012) Mechanical Properties of Cement-Treated Aggregate Material –
A Review Materials and Design, 33, p.496-502. DOI: 10.1016/j.matdes 2011.04.55.
Yeo, Y. S. (2011) Characterization of cement-treated crushed rock base course for Western Australian Roads. Thesis (Doctor of Philosophy). Curtin University. Bentley, Australian.
Yeo. Y. S.; P. Jitsangiam; H. Nikraz (2011) Mix design of cementitious basecourse.