Engenharia
Modelling of Transcritical Jets by the use of a Real
Fluid Equation of State
Eduardo Luís Santos Farias Antunes
Tese para obtenção do Grau de Doutor em
Engenharia Aeronáutica
(3
ociclo de estudos)
Orientador: Prof. Doutor André Silva
Orientador: Prof. Doutor Jorge Barata
Dedicatória
À minha mulher Julita e à minha lha Liliana.
Na esperança de que os esforços e sacrifícios de hoje se traduzam na realização dos nossos sonhos e desejos.
Agradecimentos
Quero agradecer ao meu orientador, Professor Doutor André Resende Rodrigues Silva, pela orien-tação, apoio cientí co e teórico, mas também pelo enorme encorajamento e elevado otimismo que me transmitiu ao longo de todo o trabalho e principalmente nos momentos mais difíceis.
Quero agradecer ao meu orientador, Professor Doutor Jorge Manuel Martins Barata, por me dar a oportunidade de trabalhar integrado no grupo de investigação e por todo o apoio cientí co e teórico prestado durante a realização do trabalho.
Resumo
O presente trabalho tem como o objectivo o estudo e modelação de jactos de azoto criogénico numa gama de condições transcriticas e supercriticas. A injecção de combustível em condições de alta pressão e temperatura apresenta-se como o principal objecto de aplicação da presente investigação. Este tipo de injecção é típica não só em motores foguetes mas também em moder-nos motores diesel assim como em turbinas de gás, em ambos os casos pressões e temperaturas de combustão têm aumentado com o objectivo de aumentar e ciência e performance reduzindo ao mesmo tempo e emissão de poluentes.
Uma aproximação numérica de densidade variável, originalmente desenvolvida para a mode-lação de jactos gasosos, turbulentos e incompressíveis foi utilizada para a modemode-lação deste tipo de escoamentos. Os resultados demonstraram o potencial desta aproximação. No entanto, a mesma não previa os efeitos resultantes da transmissão de calor nos uidos nem o comporta-mento de gases reais. Para colmatar estas de ciências foi incluída a equação da energia assim como equações de estado de gás real. Para a determinação das propriedades dos uidos foram empregues e testadas diferentes metodologias.
Os resultados obtidos mostram uma boa concordância no seu geral com os dados experimentais divergindo apenas no comprimento do cone potencial. Uma conclusão importante dos resulta-dos é a da importância que a turbulência tem neste tipo de escoamento quando comparada com as propriedades moleculares.
Palavras-chave
Ponto crítico; Jatos criogénicos; Injeção de combustível; Motores foguete; Escoamentos super-críticos; Termodinâmica de gases reais.
Resumo alargado
A prevenção das alterações climáticas assim como a salvaguarda dos recursos naturais do nosso planeta são hoje dois dos maiores desa os que a humanidade enfrenta. O uso excessivo dos combustíveis fosseis está de forma evidente na base destes problemas, por esse motivo é ur-gente a sua redução. A humanidade também se encontra numa corrida pelo conhecimento do universo, entre as varias tecnologias necessárias para obter uma melhor compreensão do que nos rodeia estão as tecnologias que nos permitem realizar viagens espaciais, bem como desenvolver a capacidade de construir motores foguete cada vez mais áveis e com melhor desempenho.
Uma tendência que tem sido adotada de forma generalizada por parte de projetistas e constru-tores para o aumento da e ciência e desempenho de moconstru-tores de combustão interna, de que são exemplo os motores diesel, as turbinas de gás, os motores foguetes e outros, é o aumento das pressões e temperaturas de operação. Estas trazem no entanto complexidades adicionais. Ao aumentar a pressão e temperatura de operação, não raras vezes, atingem-se os valores críticos termodinâmicos destas variáveis. As consequências não são de todo inócuas, em volta do ponto crítico e acima deste existem vigorosas variações do comportamento dos uídos. No ponto crítico, por um lado, propriedades como a difusividade mássica, a tensão super cial e o calor latente desaparecem, por outro lado, o calor especi co a pressão constante, a compressibili-dade isentrópica e a condutivicompressibili-dade térmica aproximam-se a in nito. É também sabido que em condições supercríticas, de nidas pelo facto da pressão e temperatura estarem ambas a valores acima dos críticos, dá-se uma variação do comportamento da estrutura dos jatos, esta passa de um típico jato liquido injetado num gás para algo que mais se assemelha a um jato gasoso injetado num ambiente gasoso. No entanto os maiores desa os aparecem na modelação de jatos em condições próximas do ponto crítico já que nestas condições o conhecimento é ainda hoje limitado.
No presente trabalho pretendeu-se modelar a injeção de azoto criogénico numa camara re-pleta de azoto gasoso a condições supercríticas. O azoto é injetado a duas temperaturas diferentes que correspondem no caso da temperatura mais baixa a condições transcríticas, quando a pressão é supercrítica mas a temperatura subcrítica, e no caso de temperatura mais elevada corresponde a condições supercríticas de injeção. Várias estratégias diferentes foram empregues, todas elas baseadas nas médias de Favre das equações de Navier-Stokes e utilizando um modelo de turbulência k − ε. Inicialmente foi empregue uma estratégia originalmente de-senvolvida para jatos gasosos de densidade variável, esta abordagem faz uso da lei de Amagat, por via da fração de mistura, para obter a densidade e que usa um valor constante para viscosi-dade molecular. Outras estratégias, que empregam duas diferentes equações de estado de gás real, Soave-Redlich-Kwong e Peng-Robinson, foram também empregues. Nestas metodologias foi necessário integrar a equação da energia, originalmente não presente na formulação, por forma a obter o campo de temperaturas. Foram também testados diferentes métodos para a determinação de propriedades como a viscosidade molecular, condutividade térmica e calor especi co.
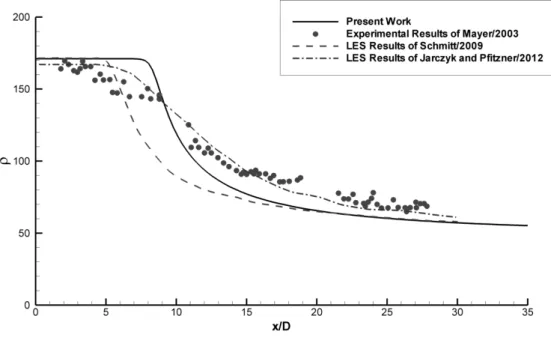
Os resultados obtidos mostram boa concordância com os resultados experimentais e também com simulações Large Eddy Simulation (LES) de outros autores principalmente para a razão de abertura do jato e para a distribuição radial da densidade a diferentes distâncias axiais. Já para a distribuição axial da densidade na linha central houve algumas discrepâncias nomeadamente na determinação do comprimento do cone potencial. A partir da comparação dos resultados
entre as varias metodologias pôde ser concluído que a variação da metodologia de calculo das propriedades moleculares tem uma fraca in uência sobre os resultados, isto sugere que são as características turbulentas do escoamento que de facto mais in uenciam o mesmo.
Como futuro trabalho sugere-se o estudo da in uência do numero de Prandtl turbulento e a sua eventual variabilidade ao longo do escoamento.
Abstract
The prevention of further climate as well as the exhaustion of natural resources in our planet are two of the biggest challenges faced by humankind. To achieve this objectives, emissions and fossil fuel consumption must be reduced. At the same time humankind puts great effort in the understanding of our universe, space ights are an important mean to achieve such knowledge and for those better performance and reliability of rocket engines are required.
Increasing the operating pressure and temperature of power systems such as diesel engines, gas turbines, rocket engines, and others, is a known way of increasing ef ciency and performance. Over the past years, this increase has become an important trend in the design of new power units.
In order to study the high pressure and high temperature operating condition of the variety of internal combustion engines, a cryogenic nitrogen jet injected into supercritical chamber con-ditions was simulated numerically. The Favre averaged Navier-Stokes equations were employed together with a k − ε turbulence model. To determine the density value different approaches were employed, one making use of Amagat's law based on mixture fraction, and another em-ploying the Soave-Redlich-Kwong or the Peng-Robinson real uid equations of state, and also integrating the favre averaged energy equation. To determine the uid properties also different approaches were tested.
The obtained results have shown an acceptable agreement with experiments, mainly in terms of the jet spreading rate as well as for radial density distribution. For the axial density distribution was found a more dif cult agreement for the length of the potential core. Results also suggest the a strong in uence of the turbulent characteristics over the ow of study.
Keywords
Critical Point, Cryogenic Jets, Fuel Injection, Rocket Engines, Supercritical Flows, Real Fluid Thermodynamics.
Contents
1 Theroretical Review 1 1.1 Introduction . . . 1 1.2 Droplets Studies . . . 4 1.3 Jet Studies . . . 10 1.3.1 Experimental . . . 10 1.3.2 Numerical . . . 22 1.4 Objectives . . . 341.5 Structure of the document . . . 35
2 Mathematical Approach 37 2.1 Introduction . . . 37
2.2 Governing Equations for Fluid Dynamics . . . 37
2.2.1 Conservation of Mass . . . 38
2.2.2 Conservation of Linear Momentum . . . 38
2.2.3 Conservation of Energy . . . 39
2.3 Reynolds Averaged Navier-Stokes Equations . . . 39
2.3.1 Reynolds Averaged Conservation of Mass . . . 40
2.3.2 Reynolds Averaged Conservation of Linear Momentum . . . 41
2.3.3 Other considerations . . . 42
2.4 Favre Averaged Navier-Stokes Equations . . . 42
2.4.1 Favre Averaged Conservation of Mass . . . 44
2.4.2 Favre Averaged Conservation of Linear Momentum . . . 45
2.4.3 Favre Averaged Conservation of Energy . . . 46
2.5 Treatment of Turbulence . . . 48
2.5.1 Modeling of favre uctuation correlations . . . 50
2.6 Governing Equations for the axisymmetric ow of study . . . 51
2.7 Wall Treatment . . . 53
2.7.1 The Law of the Wall . . . 54
2.7.2 Law of the Wall for Scalar Transport . . . 55
2.7.3 Wall treatment for k and ε equations . . . 56
3 Real Fluid Thermodynamics 59 3.1 Introduction . . . 59
3.2 Equation of State . . . 59
3.2.1 Amagat's law . . . 60
3.2.2 Ideal gas law . . . 61
3.2.3 Real uid equation of state . . . 62
3.2.4 Soave-Redlich-Kwong Equation of State . . . 65
3.2.5 Peng-Robinson Equation of State . . . 66
3.2.6 Equation of state comparison . . . 68
3.3 Determination of Viscosity . . . 69
3.3.1 Assumption of Viscosity as constant . . . 69
3.3.2 Sutherland's law . . . 69
3.3.4 Real uid equation for viscosity . . . 71
3.4 Determination of Thermal Conductivity . . . 74
3.4.1 Sutherland's law . . . 75
3.4.2 Determination of thermal conductivity from experimental data . . . 75
3.4.3 Real uid equation for thermal conductivity . . . 76
3.5 Determination of speci c heat . . . 80
3.5.1 Determination of speci c heat from experimental data . . . 81
4 Numerical Approach 83 4.1 Introduction . . . 83
4.2 Numerical Method . . . 83
4.2.1 Discretization of differential equations . . . 83
4.2.2 Numerical Scheme . . . 85
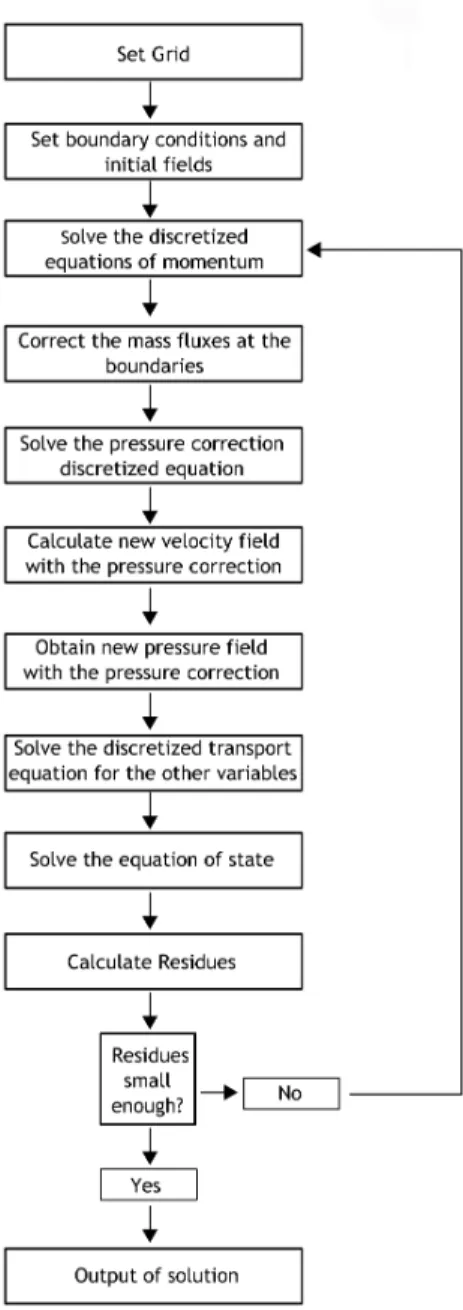
4.2.3 Algorithm . . . 87
4.3 Flow Con guration and Boundary Conditions . . . 87
4.4 Cases of Study . . . 88
4.5 Grid . . . 89
5 Results 93 5.1 Introduction . . . 93
5.2 Fraction Mixture Based Equation of State . . . 93
5.2.1 Flow Fields . . . 94
5.2.2 Axial Density Distribution . . . 95
5.2.3 Radial Density Distribution . . . 97
5.2.4 Jets Spreading Rate . . . 98
5.3 Real Fluid Equation of State with Constant Properties . . . 100
5.3.1 Properties at Different Temperatures . . . 101
5.3.2 Flow Fields . . . 104
5.3.3 Axial Density Distribution . . . 104
5.3.4 Radial Density Distribution . . . 108
5.3.5 Jet Spreading Rate . . . 109
5.4 Real Fluid Equation of State with uid properties obtained from experimental data 111 5.4.1 Flow Fields . . . 112
5.4.2 Axial Density Distribution . . . 113
5.4.3 Radial Density Distribution . . . 116
5.4.4 Jet Spreading Rate . . . 119
5.5 Real Fluid Equation of State with viscosity and thermal conductivity obtained from Lemmon and Jacobsen . . . 120
5.5.1 Flow Fields . . . 120
5.5.2 Axial Density Distribution . . . 121
5.5.3 Radial Density Distribution . . . 124
5.5.4 Jet Spreading Rate . . . 124
5.6 Summary . . . 127
A Scienti c Communications 137
A.1 Paper Presented in 50th AIAA Aerospace Science Meeting including the New Hori-zons Forum and Aerospace Exposition . . . 138 A.2 Paper Presented in 53th AIAA Aerospace Science Meeting . . . 153 A.3 Paper Presented in 3◦Encontro de Jovens Investigadores do LAETA . . . 168 A.4 Paper Presented in the 12th International Conference on Energy for a Clean
Envi-ronment . . . 182 A.5 Abstract of the Comunication Presented in the Mechanical Engineering
Confer-ence - CEM 2016 . . . 192 A.6 Abstract of the Comunication Presented in the Joint meeting of the Portuguese
and Scandinavian-Nordic Sections of the Combustion Institute - 2016 . . . 194 A.7 Paper Accepted for Publication at Journal of Engineering and Applied Sciences . . 197 A.8 Paper Published in Combustion Engines . . . 212
List of Figures
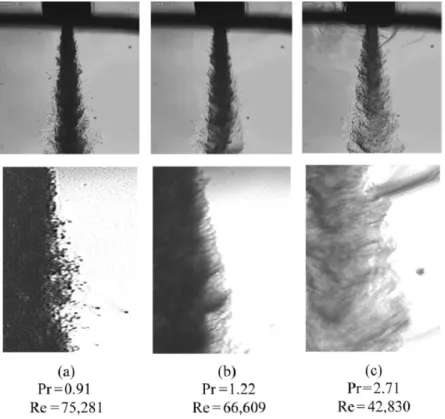
1.1 The four regimes around the critical point. . . 2 1.2 Setup for Shadowgraph without optical components. . . 11 1.3 LN2injection into GN2at a) 4.0, b) 3.0, and c) 2.0 MPa [23]. . . 15 1.4 LN2 injected into GN2 at three reduced pressures ranging from subcritical to
supercritical. The bottom row contains magni ed images of the top row [20] . . 19 1.5 Schematic of uid jet evolution [36] . . . 26 3.1 Nitrogen Density comparison of Ideal Gas Equation of State with data from Gas
Encyclopedia [62] for a range of temperature at 3.0, 4.0, and 5.0 MPa. . . 62 3.2 Comparison of the performance of the Ideal Gas, Soave-Redlich-Kwong, and Peng-Robin-son equations of state for a pressure of 3 MPa. . . 68 3.3 Comparison of the performance of the Ideal Gas, Soave-Redlich-Kwong, and Peng-Robin-son equations of state for a pressure of 4 MPa. . . 69 3.4 Comparison of the performance of the Ideal Gas, Soave-Redlich-Kwong, and Peng-Robin-son equations of state for a pressure of 5 MPa. . . 70 3.5 Comparison of the Sutherland's law performance with the experimental data for
3, 4, and 5 MPa. . . 71 3.6 Comparison between data from Gas Encyclopaedia and the function by parts
ob-tained from it for a pressure of 4 MPa. . . 71 3.7 Comparison against experimental data, of the Lemmon/Jacobsen's formulation
for viscosity determination with the PR and SRK equations of state for a pressure of 3 MPa. . . 74 3.8 Comparison against experimental data, of the Lemmon/Jacobsen's formulation
for viscosity determination with the PR and SRK equations of state for a pressure of 4 MPa. . . 75 3.9 Comparison against experimental data, of the Lemmon/Jacobsen's formulation
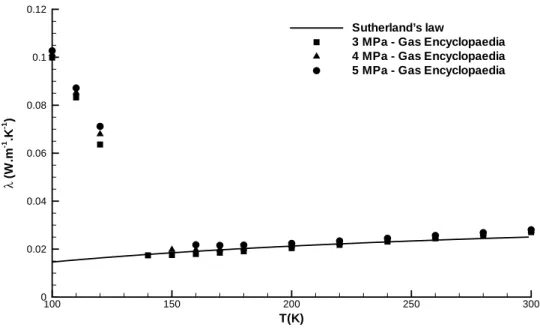
for viscosity determination with the PR and SRK equations of state for a pressure of 5 MPa. . . 76 3.10 Comparison of the Sutherland's law performance for thermal conductivity with
the experimental data for 3, 4, and 5 MPa. . . 77 3.11 Comparison between data from Gas Encyclopaedia and the function by parts
ob-tained from it for a pressure of 4 MPa. . . 78 3.12 Comparison against experimental data, of the Lemmon/Jacobsen's formulation
for thermal conductivity determination with the PR and SRK equations of state for a pressure of 3 MPa. . . 80 3.13 Comparison against experimental data, of the Lemmon/Jacobsen's formulation
for thermal conductivity determination with the PR and SRK equations of state for a pressure of 4 MPa. . . 81 3.14 Comparison against experimental data, of the Lemmon/Jacobsen's formulation
for thermal conductivity determination with the PR and SRK equations of state for a pressure of 5 MPa. . . 82 3.15 Comparison between data from Gas Encyclopaedia and the function by parts
4.1 Node con guration for a control volume centered in P. . . 84
4.2 Algorithm for the sequence of resolution of the numerical approach. . . 88
4.3 Flow con guration. . . 89
4.4 Boundary Conditions. . . 89
4.5 conditions in the thermodynamic regime chart. . . 90
4.6 Computational grid. . . 91
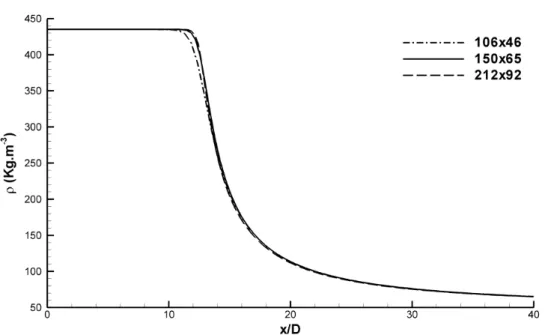
4.7 Grid dependency test based on the axial density distribution in the centreline for the original approach. . . 92
4.8 Grid dependency test based on the axial density distribution in the centreline for the approach with real uid thermodynamics. . . 92
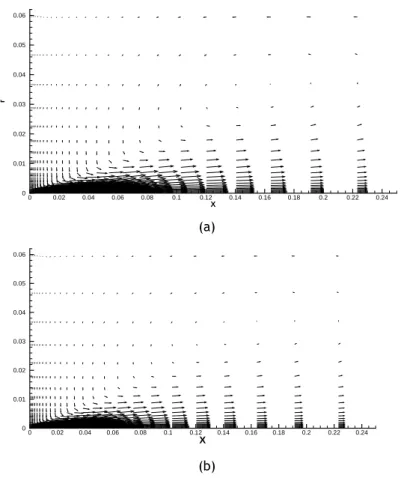
5.1 Velocity eld of the jet for a) transcritical and b) supercritical conditions. . . 95
5.2 Mixture fraction eld of the jet for a) transcritical and b) supercritical conditions. 96 5.3 Density eld of the jet for a) transcritical and b) supercritical conditions. . . 96
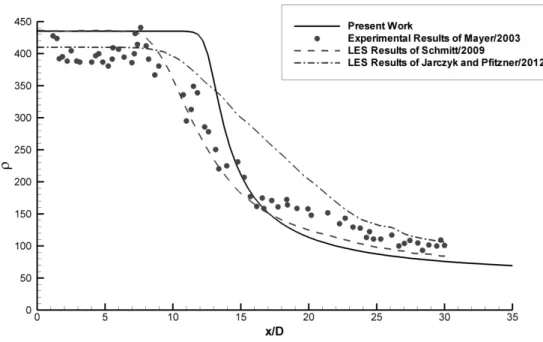
5.4 Axial density distribution for transcritical case and comparisons with different authors' results. . . 97
5.5 Axial density distribution for supercritical case and comparisons with different authors' results. . . 98
5.6 Radial Density Distribution for transcritical case. a) x/D = 1.2; b) x/D = 5; c) x/D = 25 . . . 99
5.7 Radial Density Distribution for supercritical case. a) x/D = 1.2; b) x/D = 5; c) x/D = 25 . . . 99
5.8 Full Width of Half Maximum of Density for transcritical case and comparison with experimental data of Mayer et al.[26]. . . 100
5.9 Full Width of Half Maximum of Density for supercritical case. . . 101
5.10 Axial density distribution for the transcritical case a), and supercritical case, b), with the use of Soave Redlich-Kwong Equation of State. . . 102
5.11 Full Width of Half Maximum of Density for the transcritical case a), and supercrit-ical case, b), with the use of Soave Redlich-Kwong Equation of State. . . 102
5.12 Axial density distribution for the transcritical case a), and supercritical case, b), with the use of Peng-Robinson Equation of State. . . 103
5.13 Full Width of Half Maximum of Density for the transcritical case a), and supercrit-ical case, b), with the use of Peng-Robison Equation of State. . . 103
5.14 Velocity eld of the jet for a) transcritical and b) supercritical conditions with the use of the Soave-Redlich-Kwong equation of state and with constant uid properties. . . 105
5.15 Mixture fraction eld of the jet for a) transcritical and b) supercritical conditions with the use of the Soave-Redlich-Kwong equation of state and with constant uid properties. . . 105
5.16 Density eld of the jet for a) transcritical and b) supercritical conditions with the use of the Soave-Redlich-Kwong equation of state and with constant uid properties. . . 106
5.17 Velocity eld of the jet for a) transcritical and b) supercritical conditions with the use of the Peng-Robinson equation of state and with constant uid properties. 106 5.18 Mixture fraction eld of the jet for a) transcritical and b) supercritical condi-tions with the use of the Peng-Robinson equation of state and with constant uid properties. . . 107
5.19 Density eld of the jet for a) transcritical and b) supercritical conditions with the use of the Peng-Robinson equation of state and with constant uid properties. . . 107 5.20 Axial density distribution for transcritical case and comparisons with different
authors results. . . 108 5.21 Axial density distribution for supercritical case and comparisons with different
authors results. . . 109 5.22 Radial Density Distribution for transcritical case. a) x/D = 1.2; b) x/D = 5; c) x/D
= 25 . . . 110 5.23 Radial Density Distribution for supercritical case. a) x/D = 1.2; b) x/D = 5; c) x/D
= 25 . . . 110 5.24 Full Width of Half Maximum of Density for transcritical case and comparison with
experimental data of Mayer et al. [26]. . . 111 5.25 Full Width of Half Maximum of Density for supercritical case. . . 112 5.26 Velocity eld of the jet for a) transcritical and b) supercritical conditions with the
use of the Soave-Redlich-Kwong equation of state and with variable uid properties.113 5.27 Mixture fraction eld of the jet for a) transcritical and b) supercritical conditions
with the use of the Soave-Redlich-Kwong equation of state and with variable uid properties. . . 114 5.28 Density eld of the jet for a) transcritical and b) supercritical conditions with the
use of the Soave-Redlich-Kwong equation of state and with variable uid properties.114 5.29 Velocity eld of the jet for a) transcritical and b) supercritical conditions with
the use of the Peng-Robinson equation of state and with variable uid properties. 115 5.30 Mixture fraction eld of the jet for a) transcritical and b) supercritical
condi-tions with the use of the Peng-Robinson equation of state and with variable uid properties. . . 115 5.31 Density eld of the jet for a) transcritical and b) supercritical conditions with the
use of the Peng-Robinson equation of state and with variable uid properties. . . 116 5.32 Axial density distribution for transcritical case and comparisons with different
authors results. . . 117 5.33 Axial density distribution for supercritical case and comparisons with different
authors results. . . 117 5.34 Radial Density Distribution for transcritical case. a) x/D = 1.2; b) x/D = 5; c) x/D
= 25 . . . 118 5.35 Radial Density Distribution for supercritical case. a) x/D = 1.2; b) x/D = 5; c) x/D
= 25 . . . 118 5.36 Full Width of Half Maximum of Density for transcritical case and comparison with
experimental data of Mayer et al. [26]. . . 119 5.37 Full Width of Half Maximum of Density for supercritical case. . . 120 5.38 Velocity eld of the jet for a) transcritical and b) supercritical conditions with
the use of the Soave-Redlich-Kwong equation of state and with uid properties obtained from [65]. . . 121 5.39 Mixture fraction eld of the jet for a) transcritical and b) supercritical
condi-tions with the use of the Soave-Redlich-Kwong equation of state and with uid properties obtained from [65]. . . 122 5.40 Density eld of the jet for a) transcritical and b) supercritical conditions with
the use of the Soave-Redlich-Kwong equation of state and with uid properties obtained from [65]. . . 122
5.41 Velocity eld of the jet for a) transcritical and b) supercritical conditions with the use of the Peng-Robinson equation of state and with uid properties obtained from [65]. . . 123 5.42 Mixture fraction eld of the jet for a) transcritical and b) supercritical conditions
with the use of the Peng-Robinson equation of state and with uid properties obtained from [65]. . . 123 5.43 Density eld of the jet for a) transcritical and b) supercritical conditions with
the use of the Peng-Robinson equation of state and with uid properties obtained from [65]. . . 124 5.44 Axial density distribution for transcritical case and comparisons with different
authors results. . . 125 5.45 Axial density distribution for supercritical case and comparisons with different
authors results. . . 125 5.46 Radial Density Distribution for transcritical case. a) x/D = 1.2; b) x/D = 5; c) x/D
= 25 . . . 126 5.47 Radial Density Distribution for supercritical case. a) x/D = 1.2; b) x/D = 5; c) x/D
= 25 . . . 126 5.48 Full Width of Half Maximum of Density for transcritical case and comparison with
experimental data of Mayer et al. [26]. . . 127 5.49 Full Width of Half Maximum of Density for supercritical case. . . 128
List of Tables
2.1 Model constants of the k − ε turbulence model. . . 50
2.2 Source terms in the generalized equation 2.66. . . 53
3.1 Physical Properties of Nitrogen. . . 60
3.2 Parameters of the Viscosity and Thermal Conductivity Equations for N2 [66]. . . . 73
3.3 Coef cients of the Collision Integral Equation [66]. . . 73
3.4 Coef cients of the Collision Integral Equation [66]. . . 73
3.5 Coef cients and Exponents of the Residual Fluid Thermal Conductivity Equations for N2 [65] . . . 79
4.1 Conditions of the test cases. . . 90
5.1 Potential core x/D. . . 128
Nomenclature
a real uid equation of state constant b real uid equation of state constant
B transfer number
βv evaporation rate
cp speci c heat at constant pressure [J.kg−1.K−1] cv speci c heat at constant volume [J.kg−1.K−1] Cµ,Cε1,Cε2 coef cients of the turbulence model
d droplet diameter [m]
d0 initial droplet diameter [m]
D injector diameter [m]; normalized droplet diameter δi,j Kronecker delta
δτ viscous lengthscale
δvis,00 visual thickness of shear layer
e internal energy [J]
et total energy [J]
ε dissipation rate of turbulent energy f misture fraction; body force
F mean mixture fraction
G buoyancy term
γ ratio of speci c heat
h enthalpy [J]
i axial direction index
j radial direction index
λ thermal conductivity [W.m−1.K−1] k turulent kinetic energy; index
K von Karman constant
Mn molar mass [kg.mol−1] µ molecular viscosity [P a.s] µt turbulent viscosity [P a.s]
n amount of substance [mol]
φ generalized variable
ω chamber-to-injection uid density ratio (ρ∞/ρ0); acentric factor
P pressure [Pa]
Pc critical pressure [Pa]
P∞ chamber ambient pressure [Pa] Pk production of turbulent kinetic energy Pr reduced pressure (P∞/Pc)
P r Prandtl number
P rt turbulent Prandtl number
ρ density [kg.m−3]
ρ0 injected uid density [kg.m−3]
ρgs∞ injection chamber's uid density [kg.m−3] ρc critical density [kg.m−3]
q heat transfer
Q heat
r radial coordinate [m]
R gas constant [J.mol−1.K−1]
R/D radial distance normalized by injector diameter Rdiam injector radius [m]
Re Reynolds number
Ret friction Reynolds number
Sφ source term
σk, σkε coef cients of the turbulence model
t time [s] T temperature [K] Tc critical temperature [T ] Tr reduced temperature (T/Tc) T∗ pseudo-boiling temperature [K] τ viscous stress
τw shear stress at the wall u axial velocity [m.s−1]
uτ friction velocity
u+ dimensionless velocity U mean axial velocity [m.s−1] Uin injection axial velocity [m.s−1]
v radial velocity [m.s−1] ∨t turbulent kinematic viscosity
V mean radial velocity [m.s−1]; volume[m3] Vm molar volume [m3.mol−1]
~
V velocity vector [m.s−1]
X axial coordinate [m]
x/D axial distance normalized by injector diameter y+ distance from the wall measures in viscous lengths
Acronyms List
AFRL Air Force Research Laboratory CFD Computational Fluid Dynamics
CNRS French National Center for Scienti c Research
DLR German Aerospace Center
DNS Direct Numerical Simulation
EoS Equation of State
FANS Favre Averaged Navier Stokes LES Large Eddy Simulation
LOX Liquid Oxygen
NIST National Institute of Standards and Technology OpenFOAM Open source Field And Manipulation
PDF Probability Density Function PIV Particle Image Velocimetry
PLIF Planar Laser-Induced Flourescence
PR Peng-Robinson
RANS Reynolds Averaged Navier-Stokes
SIMPLE Semi-Implicit Method for Pressure Linked Equations STP Standard Conditions for Temperature and Pressure
Chapter 1
Theroretical Review
1.1 Introduction
Humankind is currently in a moment of history were it is strongly dependent on fossil fuels to sustain and further advance the technological development, while other alternatives sources of energy have not yet been found as an effective replacement despite intensive research. However, these fossil fuels are not unlimited, so a more ef cient use of them must be found meanwhile. Also, we live in a planet that relies in a very fragile balance of its ecosystem. Pollution originated by the burning of fossil fuels is proved to be able to destabilize this fragile balance with possible disastrous consequences. Thus, a less harmful way of burning these fuels must be found, or at least a way of while ful lling our energetic demands, burning those fuels in smaller amount.
One way of ful lling the objectives above is by the development and adoption of more ef cient combustion power systems. When relying on combustion to produce energy, there are some very important aspects concerning to it, one of those is the fuel injection. Fuel injection is the biggest responsible for a good mixing of the fuel with the oxidizer, which is crucial for an ef cient combustion. This way, the study of fuel injection is since the start of the development of a power production system a very interesting case of study.
Increasing the operating temperatures and pressure of power systems like diesel engines, gas turbines and rocket engines is also a known way of enhancing the fuel ef ciency of such engines. However the increase of temperature and pressure does not come without costs. Initially the main engineering dif culties appeared in the form of the resistance of materials both to stress and temperature. Big effort was made by the industry in the way of nding better materials to use in such engines. Today the main problems observed, with the increase of operating pressure and temperature, are mostly thermodynamic problems.
When operating pressure and temperature increase, the fuels and oxidisers used by propulsion systems may experience the exceeding of their critical values. The issue is that under conditions of pressure and temperature that exceed or are around the critical values, uids have shown to have quite distinct behaviour from the usually observed while at conditions far from these. The critical point, where both pressure and temperature are at their critical value, is considered itself as a singularity. In this particular condition uid properties like effective mass diffusivity, surface tension and latent heat were observed to vanish. On the other hand, the heat capacity at constant pressure, cp, the isentropic compressibility, ksand the thermal conductivity, λ, all become in nite [1]. The non-existence of latent heat causes that to vaporize the liquid no heat needs to be added, and thus, there isn't vaporization heat. This conclusion is also defended by Yang [2]. The uid at critical condition presents this way a behaviour resembling that of a boiling liquid. However if the behaviour at the critical point is somewhat quite well described, there are an in nity of conditions around this particular point in which the uid shows strong behaviour variations, that are not yet totally described.
A proper analysis and study of the conditions must be performed. In order to do so, four regions or regimes around the critical point will be described.
When both temperature and pressure are subcritical the region is called saturated (or sub-critical) regime [3], in this region two phase ow is possible depending on the temperature and pressure, and when injecting liquid fuels atomization can be observed. Increasing the pressure to supercritical values while maintaining subcritical temperature the system falls into a differ-ent region called transcritical regime, under these conditions is observed a compressed liquid that remains at this state until supercritical values of temperature are achieved, this regime is currently the one for which researchers hold less knowledge about, and the one that represents more challenges in recent researches. When the temperature of the uid is supercritical it be-comes impossible to obtain a liquid state any longer, independently of the pressure's value. In fact an extreme increase of the pressure value will ultimately lead to the deposition of the uid into solid state without passing through the liquid state. Two different regions can be
identi-ed with supercritical temperature. At subcritical pressures the region is callidenti-ed superheatidenti-ed regime, under these conditions the uid has an ideal-gas behaviour When both pressure and temperatures have supercritical values the region is called the supercritical regime at which the uid has a gas-like behaviour with the particularity of conserving a liquid-like density thus being called a dense gas [3] or generally as uid as described in Bellan's work [1]. These four regimes are schematized in Figure 1.1.
Figure 1.1: The four regimes around the critical point.
For single component ows the existence of supercritical values of pressure and temperature, which de nes the regime in which the uid is, just depends on the uid physical properties. However, when dealing with more than just one substance, the variation of the mixture fraction can strongly in uence critical values of the uid as described by Lacaze and Oefelein[3]. It's quite common the use of fuel for refrigeration proposes in rocket engines before injecting them into the thrust chamber [4]. In this case fuel enters the thrust chamber at already supercritical temperatures enabling only the superheated and supercritical regimes inside the thrust chamber. And because also the pressure inside the thrust chamber is usually subcritical lonely during the starting moments of engine operation, most of the operation of liquid rocket
engines is made in the supercritical regime. This can be corroborated by the examples of the liquid-H2/liquid-O2 space shuttle main engine, with the combustion chamber operating at pressures of 22.3 MPa and the Vulcain engine (of Ariane 5 rocket) that with the same propellants can reach up to a recorded value of 28.1 MPa [5]. Both this pressure values are well above of the Hydrogen and Oxygen critical values of Pc = 1.313 MPa and Pc = 5.043 MPa, respectively. The critical temperatures of Oxygen (Tc = 154.6 K) and of Hydrogen (Tc = 33.2 K)[6] are also evidently overcome in rocket engines.
In the purely supercritical regime, the uid has as described a behaviour of a dense gas and can be treated as a variable density gaseous jet as was tested is previous works[7], [8]. The biggest uncertainty in the study of rocket engines comes when the fuels are injected below the critical temperature. This happens in the cases when fuels are not use to refrigerate the engine or when are used fuels that are in the liquid state at room temperature (also in the examples above only the hydrogen is used to cool the thrust chamber, the oxygen is not warmed before injection and this way is injected with temperature bellow critical, so at transcritical regime). In these cases the area immediately after the injector becomes very important because it's the area where the injected fuels may still retain subcritical temperatures, and this way, obeying to the transcritical regime where the liquid state exist in the form of a compressed liquid. Another question is raised by Negro and Bianchi [9] which is the possibility in fuel refrigerated engines and high pressure injection systems of ash evaporation due to the superheating of fuels. Flash evaporation may appear inside the injection nozzle due to a sudden decrease of the pressure during the injection process and can cause strong variations in the injection process.
Diesel engines are currently following the trend of progressively increasing operating pressures manly due to higher compression ratios and the generalized use of supercharging, a trend mainly motivated by the understanding that increased ambient density relative to the density of the injected fuel results in better mixing and increased rates of combustion. This however leads to operating pressures that commonly exceed the critical pressure of the injected fuel by a factor of two or more [10]. Because so far there isn't an usual practice of heating the diesel fuel before the injection, injection temperatures in diesel engines are clearly subcritical. This makes the diesel injection operation to be between the saturated and transcritical regimes in the beginning of injection. The fuel will then probably enter into the superheated and supercritical regimes as temperatures increase due to combustion. This way, it is possible the existence of fours regimes in diesel engines, a fact that raises great challenges in this kind of injection, especially because in diesel engines may exist the transition from a transcritical regime to a supercritical regime which are by far the less well known conditions up to the present date.
A similar trend observed in diesel engines is also observed in new generation gas turbine en-gines. Gas turbine engines operate at higher and more continuous temperatures than diesel engines while at lower injection and combustion chamber pressures. However, the continu-ous trend of turbine manufactures to increase the operating pressures (and also temperatures) to enhance ef ciency may in the future lead to appearance of transcritical and supercritical regimes in turbines combustion chamber, which will probably make the current, mainly two phase ow, turbine injection models obsolete for these studies.
Focusing on a more recent trend which is the gasoline direct injection systems, it is possible to observe lower operating pressures when compared to diesel engines while higher combustion chamber temperatures. However, as in diesel engines, the recent generalized use of higher compression ratios and supercharging, mainly due to the new engine downsizing trend in the
automotive industry, may be responsible for the achievement of supercritical values of pressure and temperature in a near future. This can be responsible to make the transition of the
classi-cation of the gasoline direct injection from a saturated regime to maybe transcritical or even supercritical regime.
It becomes understandable that critical and around-critical conditions described above appear in everyday real operating conditions of current engines, and following the current trend, it will appear even with greater magnitude in the future. Kim [11] stated in is paper that it has been widely recognized that the comprehensive numerical model could be the ultimate tool for the design analysis of liquid rocket combustion systems. Therefore means to better understand these conditions in order to be able to simulate and model them are of great importance not only for liquid rocket combustion systems, but to all new generation engines design, in the way of reducing development and research costs (by limiting the amount of experimental tests needed), as well as in improving ef ciency and reducing fuel and maintenance costs.
1.2 Droplets Studies
Several authors have been studying not only around-critical point properties of uids but also the injection process in those conditions. One of rst steps in any problem is to study the individual parts of it. This way one of the earliest approaches to the present problem was to study the physical properties of the uids at trans-and-supercritical conditions. In order to perform such study single droplet evaporations at high pressures are usually observed.
The study of single drops has the advantage of allowing the elimination of non-thermodynamic effects from the study such as for example aerodynamic effects resultant of the injection proce-dure. This way becomes easier to distinguish which effects are direct result from the pressure and temperature conditions imposed and how the proximity to the critical point in uences them.
One of the most commonly studied cases for supercritical condition is the one of evaporation and emission of single liquid droplets. This kind of studies has the objective of determine the processes that a liquid droplet encounter when mixing with the ambient gas and also to determine the mixing rate. Knowing the evaporation/emission rate of a liquid droplet is a very important information because this allows to determinate the droplet lifetime, the travelled distance for example in a combustion chamber, the time of the combustion and also the ignition delay, and all of this information is of the most relevance in the project of combustion chambers for engines and their respective injection systems.
Givler S.D. and Abraham J. [10] elaborated a revision about several previous studies conducted in the subjects of vaporization and droplets combustion under supercritical conditions. In their paper they describe the various conclusions achieved. One of the reached conclusions is that, despite its enormous importance for the modelling of combustion in sprays, until the paper's date (1996) there was not any published study about the interaction effects of multiple droplets in supercritical regime combustion. The same is not valid for the study of single droplets. A comparison is made in this work between the subcritical and the supercritical case. One of the conclusions achieved is that the droplet mixture process goes through two different stages. One initial transient stage in which the uid droplet undergoes a temperature increase resulting from the fact of being in a higher temperature environment. The second stage of the process is one where the droplet temperature is constant and uniform, having reached
the thermal equilibrium. At this stage the droplet is in quasi-steady regime at a temperature slightly below the boiling point and all the heat transferred to the droplet will be associated with the evaporation of more uid quantity from the droplet.
These two stages described before are always seen in the subcritical case. It was also veri ed that in the subcritical case, especially under low pressure conditions, the transient stage has a signi cantly small duration when compared with the quasi-steady stage. At these conditions, by neglecting the transient stage, the droplet evaporation rate obeys to the square diameter evaporation law, often simply referred as D2 Law , and is correctly described by the next expression:
d(t)2= d20− βvt (1.1)
Where d0 is the initial droplet diameter, t is the time and βv is the evaporation rate constant which may be shown to be:
βvt =
8ρgsDgs
ρl ln(1 + B) (1.2)
With: ρ = density;
D= normalized droplet diameter (d(t)/d0); B= transfer number.
During these quasi-steady conditions the droplet is referred as being in a wet-bulb state . The subcritical evaporation at low temperature is correctly described by the previous expression, as mentioned before. However, when ambient conditions approach critical values of pressure and temperature is observed that the transient stage suffers an increase in duration. In addition it is also observed that the evaporation begins to occur in this stage and not only in the quasi-steady stage. In opposite to what happens in the quasi-steady stage, in the transient stage the droplet temperature is neither constant nor uniform and the D2Law can't be applied. Therefore, this law doesn't describe the rst stage of the evaporation process and can only be used to describe the second stage. This leads to values increasingly deviating from the experimental values when ambient conditions approach the critical conditions. As a consequence, many works described by Givler and Abraham [10] focused on the study of evaporation/emission to the transcritical and supercritical cases. In this kind of studies, it becomes important to distinguish between those performed in normal gravity conditions and others performed in micro-gravity conditions. The gravity is an important factor for the evaporation/emission studies because it is respon-sible for the buoyancy and convective effects. These effects have great in uence in droplets evaporation/emission rate leading to its rise, and it becomes more dif cult to conclude which physical phenomena are effectively responsible to an evaporation/emission rate variation and the way how it happens. Thus, it's interesting to conduct studies in microgravity conditions where the buoyancy and convective effects are minimized and it is easier to observe the direct changes in evaporation/emission rate caused by ambient pressure and temperature variations
[10], [12].
With microgravity conditions Bellan [1] refers that higher pressures leads to a duration increase of the heating transient stage, which leads to a deviation from the D2linear model. In order to explain this deviation, several studies cited by Bellan [12] were performed with the objective of determining the droplet lifetime. These studies concluded that the temperature rise leads always to a decrease in the droplet lifetime. This is a logic and easy to understand conclusion, but the dependence of the droplet lifetime with pressure variations is not so easily understand-able. It was found that the dependence relatively to the pressure varies with the temperature. So, for a temperature above about 1.2 times the critical temperature (Tr ∼ 1.2) the pressure rise leads to a monotonous decrease of the droplet lifetime. As for temperatures below about 0.8 times the critical pressure (Tr ∼ 0.8) the droplet lifetime increases with the pressure in-crease. Some authors also suggest that there might be a temperature at which the droplets lifetime is independent of pressure (see Bellan [1]). However, it should be pointed out that the studies done in microgravity conditions must be carefully analysed since, even with gravity values as low as 10−2 in parabolic ights and 10−3 for experiences performed in drop towers, the buoyancy and convective effects are still present. Givler and Abraham [10] refer in their work that the experimental observations under conditions of microgravity are inconclusive, but their work was performed 5 years earlier that the one made by Bellan [1].
Harstad and Bellan published in 1998 two papers where are described their numerical studies of droplets behaviour in transcritical and supercritical environments, both in an isolated drop con guration [6] and in a cluster of drops con guration [13].
The rst model [6] was developed for the behaviour of an isolated uid drop of a single com-pound immersed into another comcom-pound in nite, quiescent surroundings at supercritical con-ditions. In this study was modelled an isolated drop of liquid oxygen immersed into gaseous hydrogen environment. The used model is based on the uctuation theory of Keizer that ac-counts for non-equilibrium processes and naturally leads to the most general uid equations by relating the partial molar uxes and the heat ux to the thermodynamic quantities. According to the author nonequilibrium processes must be considered since there is no physical justi -cation for equilibrium. This model accounts for Soret and Dufour effects. The Soret effect is named to the mass ux that separate heavier molecules from lighter molecules is created by the existence of a temperature gradient, on the other hand, the appearance of a heat ux cre-ated by the existence of a concentration gradient is called Dufour effect. These effects depend on thermal diffusion which is generally very small but can be sometimes signi cant when the participating species are of widely differing molecular weights. The grid is time dependent. In this numerical simulation the drop of Oxygen has an initial temperature of 100K and an initial radius of 0.050 mm, the radius of sphere in uence is 1mm. Other drop radius were tested from 0.025 mm until 0.300 mm. The hydrogen environment has temperatures between 500 K and 1000K and were tested pressures between 10 and 80 MPa. The hydrogen is consequently at fully supercritical conditions while the Oxygen start the simulation at transcritical conditions, and as it warms up over the critical temperature passes to supercritical conditions as well. In order to obtain conclusions and perform comparisons with experimental studies thermal conductivity, temperature, mass fraction, density, Lewis number and speci c heat are calculated by the model across the domain of study. One of the rst statement of the author about supercritical conditions is that while in the subcritical situation where the interface is well de ned by a surface there is a sharp change in density, in the supercritical situation there is an arbitrariness in de ning an interface that should be followed in time. This way one is free to choose an interface that wants to follow. The results obtained in this work corroborate the previous
statement since the number of phases were monitored at each time step and at all locations, and for the conditions of the study, only one phase could be found at all times and locations. Relatively to the quasi-steady gas behaviour described before in other studies these authors refer that this assumption is only strictly valid at low pressures where the liquid density is three orders of magnitude larger than that of gas, excluding this way this assumption in transcritical and supercritical conditions.
Comparing the droplet lifetime obtained by other authors for both subcritical and supercritical condition with data obtained in this work [6] it was concluded that, when at subcritical pres-sures, an increase of pressure results in a decrease of droplet's lifetime. However, the opposite happens when supercritical conditions are set, an increase of pressure leads to a decrease of droplet lifetime. These results were obtained by observation of the density over time for dif-ferent ambient pressures. It is also concluded that increasing pressure causes the existence of larger gradients of temperature and density. The practical consequence of these ndings is that increasing turbulence is necessary to mix the reactants at larger pressures. This is how-ever somewhat an opposite conclusion to the understanding exposed in the paper of Givler and Abraham [10] that increased ambient density (and by consequence pressure) relative to the density of the injected fuel results in better mixing. Another interesting conclusion is that the gradients of the mass fraction and density do not coincide, in fact there is a much faster decrease of density than of mass fraction, this indicate that the fast decreasing of density is not caused by the mixing of the liquid Oxygen with the Hydrogen but in fact by an expansion of oxygen that happens as it get warmer. This is even more evidenced when it is noted that the relaxation of temperature and density pro les occurs much faster than that of mass frac-tion. Concerning to the drop size, the main result of increasing the drop size is the delay of drop heating, production of a more uniform LOx distribution at this time, and maintaining the strong density gradient for longer times.The diffusion of LOx is observed to be enhanced at larger temperatures but the difference decreases with increasing pressure. Finally the authors describe the supercritical behaviour as a slow diffusion process. It is also stated in this work that appropriate equations of state with consistent mixing rules and transport properties valid over transcritical/supercritical conditions are required in the study of the conditions present in rocket combustion chambers.
The second model [13] was developed for the behaviour of cluster of drops and includes the interaction induced by drop proximity. This is a relevant study since during atomization process the breakup of jets generate clusters of drops that have a collective behaviour This model is based upon the isolated drop model [6], using the same equations developed for the previous model, but here with boundary conditions calculated using a global cluster model. The calcula-tions for each drop in its sphere of in uence is made using the same exact procedure used in the study of isolated drops [6], for the interstitial region the density is calculated by the equation of state while for the temperature and mass fraction the differential equations are solved using a second order predictor-corrector method. The typical situation studied was a general-vol-ume-shape cluster with a radius of 20 mm, containing 5.92 × 10⁶LOx drops with an initial radius of 0.5 mm and initially at a temperature of 100 K, immersed into a Hydrogen environment with a temperature of 1000 K and a pressure of 20 MPa. In order to obtain results of the effect by the variation of the several conditions of the study, the initial variables were changed along the simulation, and results like temperature, mass fraction, density and sphere of in uence radius are shown and compared. The authors conclude that changing the initial cluster radius has no effects to the simulation, the same however doesn't happens with the variation of the size of drops inside the cluster. The effect of having larger drops in the cluster is the change in the
characteristic time of the diffusion process that dominates at supercritical conditions. In this particular case of increasing droplet radius, its heating is made at a slower rate and this way steeper density gradients are maintain for longer periods. The effects of pressure variation were also tested for a range of pressures between 10 and 80 MPa. A very important conclusion from this study was achieved, unlike in the isolated drop situation where gradients were greater with increasing pressure, with clusters of drops the opposite is observed. The effect of drop in-teraction causes the gradients smear by increasing the cluster volume with increased pressure. Thus, contrary to the case of an isolated drop where increasing pressure over supercritical con-ditions reduces the mixing of different compounds, the presence of cluster of drops in burning sprays tends to render the dependent variables more uniform with increasing pressure. In this respect, clusters of drops are a desirable aspect because they aid the interdiffusion of the re-active components. Authors also concluded that the cluster behaviour is not sensitive to the value of the Nussel number. One important effect of cluster effect according to authors is the accumulation of a non-negligible amount of LOx with decreasing drop interdistance. The effect of drop proximity decreases with increasing pressure, in that the behaviour of the uid droplets in a very dense gas becomes increasingly similar to a pure diffusion process.
Finally, one of the most important conclusions of two works of Harstad and Bellan exposed above is that a strong variation in behaviour exists between an isolated drop and a cluster of drop, so even if some important conclusions can be achieved by the study of isolated drops, not every aspects of it can be generalize to the expected behaviour of a cluster of drops or even less to behaviour of jets.
Zhang et al. [14] conducted a computational investigation using a numerical model that in-cluded the high pressure transient effects, temperature and pressure dependent variable ther-mo-physical properties in the gas and the liquid phases and the solubility of inert species in the liquid phase, for a moving n-heptane droplet evaporation in a zero-gravity nitrogen envi-ronment. The unsteady equations of mass, species, momentum and energy conservation in axisymmetric spherical coordinates are solved using the nite-volume and SIMPLEC methods. The axisymmetric numerical model has been thoroughly validated against the extensive micro-gravity experimental data of Nomura et al. [15], in a work also referenced by Bellan [1] and Givler and Abraham [10].
In this work [15] was noted that in high pressure environments (transcritical and supercrit-ical regimes) the droplet is at a transient phase during all its lifetime, never reaching the quasi-steady phase of constant and uniform temperature. It was also veri ed that the increase of pressure is responsible for a decrease of droplet penetration distance and a rise in evapora-tion/emission rate.
As previously referred, studies of droplets evaporation/emission at normal gravity conditions have reported a problem of convection and buoyancy phenomena interference over the analysis of the direct effects of pressure and temperature on the evaporation/emission rate. However, smaller technical dif culties in the execution of these studies lead to more consistent results between different experiences. Investigations reviewed by Bellan [1] indicate that for low pres-sure environments the emission rate obeys to the D2 Law. However, as the pressure increases, it becomes more dif cult to t the obtained experimental results in the D2 Law. It is known that the convection effects increase with the pressure and it becomes dif cult to understand if the observed variation in emission rate comparatively to the D2 Law is due to the thermody-namic mechanisms, to the uids mechanic (through convective effects) or to the combination of both.
re-markable experimental investigations about droplets supercritical vaporization, by achieving in all ambient conditions quasi-steady droplets vaporization. In agreement with previous stud-ies, they concluded that the vaporization rate increases with ambient pressure. It is however concluded that the vaporization rate achieves a maximum and then decreases with further increases in ambient pressure. The experimental studies conducted with normal gravity by Givler and Abraham [10] agree that a higher ambient pressure corresponds to a vaporization rate increase. The nal conclusions of the previous authors indicate that for subcritical and supercritical conditions with normalized pressure and temperature below two, both transient and quasi-steady phases exist, indicating that for some supercritical conditions the quasi-steady model may be acceptable. However, for supercritical conditions where normalized pressure and temperature are above two all the emission process is made at the transient phase and in this situation the quasi-steady model is not applicable. Finally, it is concluded that for supercritical pressures and temperatures the droplet lifetime decreases when the temperature increases. A numerical investigation of n-heptane droplet evaporation in nitrogen under transient and supercritical conditions, performed by Zhu and Aggarwal [17] reached similar conclusions. It was used a Lagrangian-Eulerian numerical method and were measured the density, latent heat, molar fraction, gas compressibility factor and the droplet lifetime. They concluded that droplet heat up time increases and becomes a more signi cant part of the droplet lifetime when the ambient pressure rises. As the droplet surface reaches a critical mixing point the latent heat of vaporization decreases and drops to zero. They also concluded that the droplet lifetime behaviour it's not linear, and at low and moderate ambient temperature the droplet lifetime increases with pressure. However, at higher pressures, for temperatures of 500 and 700K, the droplet lifetime decreases with pressure. At higher temperatures the droplet lifetime also decreases with increasing pressure. Finally Zhu and Aggarwal [17] concluded that when the droplet surface approaches the critical mixing state, the difference between the gas and liquid phases disappears.
Meng and Yang [18] attempted to develop a uni ed treatment of uid ow over the entire range of thermodynamic states. To do so a model for droplet evaporation was created. In order to cope with transcritical and supercritical conditions a modi ed Soave-Redlich-Kwong equation of state was employed. Good agreement with experimental data was found for the droplet lifetime. Despite showing a complex thermodynamic approach, the investigation offers interesting clues for the calculation of uid properties, in particular the speci c heat.
Fieberg et al. [19] conducted an experimental and numerical work about fuel droplet evap-oration under high pressure and temperature. They studied temperatures between 300K and 500K and pressures between 0.1MPa and 3.7MPa. For the experimental work the Phase Doppler Anemometry (PDA) technique was used and for numerical work the FLUENT 6.0 CFD software. They measured the evaporation time, the surface temperature, the droplet diameter and the drag coef cient. It was also taken into account the effects of interaction between droplets in droplet chains. The conclusions reached in this work are that during the evaporation, the boundary layers increase because of the rapid diameter reduction and the exchange process between droplet surface and the adjacent gas phase slows down. Droplet deceleration in a droplet chain is much smaller compared to a single droplet, indicating that when injecting a group of droplets the penetration length should be much bigger than when injecting only one droplet. However, the burning rate of a single droplet is higher because of the existence of more available oxygen. For the experimental conditions, numerical results show that evapora-tion calculaevapora-tions in engine applicaevapora-tions using quasi-steady modelling of the gas phase are valid even for supercritical conditions and produce acceptable errors compared to a fully transient
calculation agreeing this way with the conclusions achieved by Givler and Abraham [10] that for some supercritical conditions the quasi-steady model is still valid. Since the evaporation takes place in a spray plume, the surrounding gas is cooled below the critical temperature and only a small number of droplets evaporate under supercritical conditions. The effect on the whole spray is thus further reduced.
1.3 Jet Studies
The study of single droplets and clusters of droplets in transcritical and supercritical conditions provides a big amount of information about how the thermodynamic properties of the uid change under these conditions. However, in the process of fuel injection not only thermody-namic properties are involved. In these cases, are also of extreme importance the in uences caused by aerodynamics phenomena which also interact with the different thermodynamic prop-erties. The example given by the works of Harstad and Bellan [6, 13] shows that at the same thermodynamic conditions a single drop can reveal an opposite behaviour from a cluster of drop, demonstrating this way that aerodynamic interactions between drops strongly in uence the general behaviour of a uid. This way trying to understand conditions around the critical point by the simple study single drops and thermodynamic properties is proved to be extremely reductionist.
This last conclusion conducts to the necessity of study of sprays and jets under the conditions around the critical point.
1.3.1 Experimental
The rst approach to obtain information about the behaviour of jets and sprays under condi-tions around the critical point are the experimental studies. Experimental studies are of great importance because are the ones that allow the visualizations of the several phenomena that appear in the ow of interest. In order to visualize the ow in an experimental installation several techniques are possible. The simplest method available is by direct visualization aided by some mean of lighting and then captured by photography. While this is the most obvious solution it offers many limitations and only qualitative information is possible to be obtain. In order to obtain some more useful but yet, mostly qualitative data, another technique is used with the name of shadowgraphy, this is a simple method in which the ow is illuminated with a backlight and the shadow captured by means of photography. It has been shown to be an ef-fective diagnostic tool to investigate single and coaxial jet injections. Due to the huge density gradients of the cryogenic supercritical uids relative to the background gas, it is possible by this method to determine geometrical properties such as spreading angle and potential core length regardless of whether the jet is subcritical or supercritical. Using a short time-exposure light source, more detailed information on features re ecting the interaction of the jet with its environment can be obtained. For instance, geometric properties of the jet surface area and characteristic length scales of the density variations in the mixing layer of the supercriti-cal jet can be revealed [20]. In single components and single phase shadowgraphy can give a very good clue about the density values since as seen in Figure 1.2 the light rays are de ected by the molecules of uid, this way causing dark shadows in the image after passing the uid. Thus darker shadows represent bigger defection of light which means more concentration of molecules and this way higher density. Bigger dif culties with shadowgraphy appears when
trying to study multicomponent and two phase ows.
Figure 1.2: Setup for Shadowgraph without optical components.
A more complex technique of visualization is Spontaneous Raman Scattering. When a medium is irradiated with a light beam, some fraction of the beam is scattered in all directions. If the medium contains particles of molecular dimension, a weak scattered radiation with the same wavelength is observed, called Rayleigh scattering. Raman, in 1928, discovered that the wavelength of a very small fraction of the scattered radiation by certain molecules shifted by an amount dependent upon the chemical structure of the molecules responsible for the scattering. The Raman spectra are obtained by irradiating a sample with a powerful visible monochromatic source, usually a laser beam. The scattered radiation is a very small percentage of the source, as a result, detection and measurement is generally dif cult with some exceptions. The scat-tered light is of three types, Stokes, anti-Stokes, and Rayleigh. The Rayleigh component has exactly the same frequency as the monochromatic light beam and is much more intense than the other two components. The wavelengths of the peak lines of the other two components are however independent of the wavelength of the excitation source, but speci c to the scat-tering molecule. This way, in multicomponent ows, Raman scatscat-tering allows the detection of each individual component. This property of the Raman diagnostics is an important advantage when compared to the visualization techniques such as shadowgraphy when analysing mixing processes during a two-component coaxial injection. Another very important and useful char-acteristic of the Raman scattering is that the Raman signal strength at ambient conditions is proportional to the molecular number density [20]. Raman scattering is this way shown to be a very complete and useful visualization tool that allows the user to obtain the chemical com-position and it's density in any part of the ow, adding much more information when compared with other visualization techniques.
Other ow visualization techniques are possible for use, like the case of Planar Laser-Induced Fluorescence (PLIF) which, when combined with Particle Image Velocimetry (PIV) allows simul-taneously the measurement of a uid velocity eld and species concentration. Information about the ow can also be obtained by the use of probes, but this solution has always the
inconvenient of disturbing the original ow.
Newman and Brzustowski were the rst to observe how an injected uid behaves near the critical point in their paper of 1971 [21]. They experimentally tested the injection of liquid CO2 into a test chamber with different mixtures ratios of gaseous CO2/N2 ranging from 0% to approximately 80% of CO2 in composition. The chamber temperature was ranging from 295.15 K to 333.15 K (critical temperature of CO2 is 304.15K) and pressure from 6.31 MPa to 9.06 MPa corresponding to reduced pressures between 0.856 and 1.228. The liquid CO2 was injected with velocities between 2.0 and 4.0 m/s through an injector with a diameter of 0.66 mm and at a temperature of 295.15 K. Photography, shadowgraphy, and lming were used in order to obtain results of mean axial velocity and jet spreading angle. It was observed that for both subcritical and supercritical conditions the increase of gas density causes a ner spray, this way, an increase of the chamber pressure causes a reduction in size of droplets. These, in the limit, become so small that the liquid phase evaporates within the eld of view. An important conclusion obtained in this earlier work was the reduction of the surface tension that authors described to be linked to the increase of temperature, however they also state that the in uence of temperature in surface tension is smaller when the pressure is lower. The reduction of the surface tension is suggested to be the major contribution to the increase atomization ef ciency. The authors describe the difference in evaporation between a system at subcritical pressures and another at supercritical. They state that at subcritical pressure the liquid cannot gasify directly suffering this way a boiling process in which all the droplet rst approach saturation temperature and then start evaporating. A different process is described to happen at supercritical pressure, in this case the liquid as it reaches critical temperature directly gasi es. It is questioned whether one can still refer to the supercritical ow eld as a spray, as the extremely small droplets caused by a very low surface tension result in a ow situation similar to that of a continuum rather that a heterogeneous liquid-gas mixture. However, the authors continue to admit the existence of atomization near critical pressures. Some quantitative conclusions were also obtained, it was seen that the rate of decay of the nondimensional mean axial velocity decreases with the increase of the density ration (ρl/ρg). The jet spreading angle decreases with the increase of density ratio and nally all the jet parameters seemed to be independent of the initial jet velocity.
In order to study the in uence of the critical and supercritical conditions in the fuel injection is also important to collect information about the behaviour of a jet in subcritical conditions in order to establish a control for comparison. In 1988 Papamoschou and Roshko [22] conducted an experimental study concerning turbulent shear layers in supersonic ow, a study that later would became one very important references for authors studying fuel injection. The main focus of this study was shear-layers and growth rates in supersonic gases, however subsonic conditions were also analysed in order to compare them with compressible ow. In this ex-periment was used a two-stream, blow-down supersonic, intermittent wind tunnel. Tests had durations between 1.5 and 2.0 seconds. The visualization was made by means of photography with back illumination and was used a pitot probe in order to measure pressure, with the Mach number being calculated by the Rayleigh Pitot formula. Were used in the experiment N2, Ar and He gases in order to modify density ratio (ω) between 0.24 and 4.4, also the Mach num-ber was varied between 0.2 and 3.4. Most of the conclusions achieved in the study concern supersonic conditions and comparisons with the subsonic case, thus, with less relevance for the study of critical and supercritical injection. But also several results are presented for the general case of jet ows. Results of visualization and pressure pro les allow the identi cation of spreading rates in the shear-layers. Pitot-thickness data is used to calculate the turbulent

![Table 3.5: Coef cients and Exponents of the Residual Fluid Thermal Conductivity Equations for N 2 [65] i N i t i d i l i 1 1.511 2 2.117 -1.0 3 -3.332 -0.7 4 8.862 0.0 1 0 5 31.11 0.03 2 0 6 -73.13 0.2 3 1 7 20.03 0.8 4 2 8 -0.7096 0.6 8 2 9 0.2672 1.9 10](https://thumb-eu.123doks.com/thumbv2/123dok_br/18824645.927596/105.892.243.686.137.592/table-cients-exponents-residual-fluid-thermal-conductivity-equations.webp)