Evaluation of food intake, weight and body composition in children with
cerebral palsy
Avaliação da ingestão alimentar, peso e composição corporal em crianças com
paralisia cerebral
DOI:10.34117/bjdv6n11-051
Recebimento dos originais: 03/10/2020 Aceitação para publicação: 04/11/2020
Lidiana de Souza Holanda
Master’s degree in Child and Adolescent Health
Federal University of Pernambuco (UFPE), Recife, Pernambuco, Brazil E-mail: lidianaholanda79@gmail.com
Margarida Maria de Castro Antunes
Doctoral degree in Child and Adolescent Health
Federal University of Pernambuco (UFPE), Recife, Pernambuco, Brazil; Adjunct professor, Department of Maternal-Child Health and Postgraduate Program in Child and Adolescent Health,
UFPE
E-mail: margarida.mmcastro@gmail.com
Fabiana Cristina Lima da Silva Pastich Gonçalves
Doctoral degree in Child and Adolescent Health
Federal University of Pernambuco (UFPE), Recife, Pernambuco, Brazil; Adjunct professor, Department of Nutrition, UFPE
E-mail: fabiana_pastich@yahoo.com.br
Bruna Merten Padilha
Doctoral degree in Nutrition from Postgraduate Program in Nutrition
Federal University of Pernambuco (UFPE), Recife, Pernambuco, Brazil. Adjunct professor, School of Nutrition, Federal University of Alagoas (UFAL), Maceió, Alagoas, Brazil
E-mail: bruna48@hotmail.com
Maria Lúcia Diniz Araújo
Doctoral degree in Nutrition from Postgraduate Program in Nutrition Federal University of Pernambuco (UFPE), Recife, Pernambuco, Brazil
E-mail: mldinizaraujo@hotmail.com
Leila Virgínia da Silva Prado
Doctoral degree in Nutrition from Postgraduate Program in Nutrition Federal University of Pernambuco (UFPE), Recife, Pernambuco Brazil
E-mail: leilaprado84@gmail.com
Poliana Coelho Cabral
Doctoral degree in Nutrition from Postgraduate Program in Nutrition
Federal University of Pernambuco (UFPE), Recife, Pernambuco, Brazil; Associate Professor, Department of Nutrition and Postgraduate Program in Child and Adolescent Health, UFPE
ABSTRACT
Aim: We investigated food intake, weight and body composition evaluation in children with cerebral
palsy.
Method: A case-series study was conducted involving 53 children with mild to moderate motor
impairment. Food intake was estimated and bioimpedance was used to determine body composition, with the calculation of the free fat mass index and fat mass index (FMI). The anthropometric profile was determined using z-scores of the following indices: height-for-age (zH/A), weight-for-age (zW/A) and body mass index-for-age (zBMI/A).
Results: Height deficit was found in 7.5% of the children. Excess weight was found in 20.8% (zW/A)
and 30.2% (zBMI/A). The prevalence of underweight was 7.5% (zW/A) and 5.7% (zBMI/A). Excess fat mass was found in 77.4%. No associations were found between excess fat mass or fat-free mass and excess weight or calorie intake. Height was positively correlated with age, mobility and zH/A. FMI was positively correlated with age and height. Lipid intake was positively correlated with age, height and FMI.
Conclusion: The nutritional status and food intake of the children analyzed in the study was similar
to that of children without neurological disease, possibly due to the lower degree of motor impairment.
Keywords: Cerebral Palsy, Nutritional Status, Food Intake, Body Composition, Anthropometry. RESUMO
Objetivo: Investigamos a ingestão alimentar, o peso e a avaliação da composição corporal em
crianças com paralisia cerebral.
Método: Foi realizado um estudo de série de casos envolvendo 53 crianças com deficiência motora
leve a moderada. A ingestão alimentar foi estimada e a bioimpedância utilizada para determinar a composição corporal, com o cálculo do índice de massa gorda livre e índice de massa gorda (IMG). O perfil antropométrico foi determinado por meio de escores z dos seguintes índices: altura para idade (zH / A), peso para idade (zW / A) e índice de massa corporal para idade (zBMI / A).
Resultados: O déficit de altura foi encontrado em 7,5% das crianças. Excesso de peso foi encontrado
em 20,8% (zW / A) e 30,2% (zBMI / A). A prevalência de baixo peso foi de 7,5% (zW / A) e 5,7% (zBMI / A). Excesso de massa gorda foi encontrado em 77,4%. Não foram encontradas associações entre o excesso de massa gorda ou massa livre de gordura e o excesso de peso ou ingestão de calorias. A estatura correlacionou-se positivamente com a idade, mobilidade e zH / A. O IMF foi positivamente correlacionado com a idade e a altura. A ingestão de lipídios correlacionou-se positivamente com idade, altura e IMG.
Conclusão: O estado nutricional e o consumo alimentar das crianças analisadas no estudo foram
semelhantes aos de crianças sem doenças neurológicas, possivelmente pelo menor grau de comprometimento motor.
Palavras-chave: Cerebral Palsy, Estado nutricional, Ingestão de alimentos, Composição do corpo,
Antropometria.
1 INTRODUCTION
Growth variables and body composition are significantly altered in patients with cerebral palsy (CP). Alterations in body composition vary in accordance with the degree of motor impairment.1
With regard to food intake, individuals with CP have similar caloric and macronutrient intake as children with typical development.2 It is therefore necessary to evaluate body composition and food
intake for the determination of the nutritional status of such individuals and identify situations of risk in order to plan health promotion and disease prevention actions.
The aim of the present study was to evaluate food intake, weight and body composition in children with mild to moderate CP.
2 MATERIALS AND METHODS
2.1 STUDY AND PARTICIPANTS
A case-series study was conducted between February and August 2016 at three centers for the follow up of children with CP. Children with severe motor impairment, congenital malformation unrelated to CP, those with chromosome, heart or respiratory diseases, those with hearing or seeing impairment, and those submitted to surgery of the musculoskeletal system or botulinum toxic injection in the previous six months were excluded from the study.
The clinical characterization included the type of CP (classified as spastic or other type) and degree of motor impairment based on the Gross Motor Function Classification System (GMFCS).3
2.2 NUTRITIONAL ASSESSMENT
The anthropometric evaluation involved the determination of weight, measured height and estimated height, the former two of which were performed following the recommendations of the Brazilian Ministry of Health.4 Weight was determined using a portable electronic scale (Filizola
Personal Line, São Paulo, Brazil) with a capacity of 180 kg and precision of 100 g. Height was measured using a portable stadiometer (Cardiomed® WCS, Curitiba, Brazil) with a maximum capacity of 216 cm and precision of 1 mm. Children who could not walk were weighed while being held by an accompanier and the child’s weight was determined by subtracting the weight of the accompanier from the total weight of the two individuals. In such cases, height was estimated based on the height to the knee, which was determined using bone calipers (Cescorf, Porto Alegre, Brazil) with the child in the supine position and the knee flexed at 90°. Height was then estimated using a specific equation for patients with motor disabilities aged two to 12 years: height (cm) = (2.69 x height to knee) + 24.2.5
The growth curves recommended by the World Health Organization6,7 were used for the comparison of the weight and height measures with the aid of the WHO AnthroPlus® program, version 3.2.2. The following indices were used: height for age (H/A), weight for age (W/A) and body mass index for age (BMI/A). These indices were used to classify the children based on z-scores: short H/A (ZH/A < -2 z-scores), underweight (ZW/A and ZBMI/A < -2 z-scores) and ideal range (ZW/A and ZBMI/A -2 and ≤ +1 z-scores). Independently of age, ZW/A and ZBMI/A > +1 were used for
the classification of overweight. All measurements were made three times and the mean was calculated from the two closest measurements.
2.3 BODY COMPOSITION
Electrical bioimpedance was determined using the Maltron BF-906 analyzer (Maltron, United Kingdom) with four surface electrodes and a frequency of 50 Hz in alternating current. The child was placed in the supine position on a non-conductive surface with arms and legs in abduction at 45º. Two electrodes separated by a distance of 5 cm were positioned on the dorsum of the right hand (third metacarpus and wrist) and two were placed on the dorsum of the right foot (third metatarsus and ankle). The children were evaluated barefoot with minimal clothing and the removal of all metallic accessories. To ensure the accuracy of the reading, the guardians were instructed to follow some prior procedures based on Heyward & Stolarczyk.8
Total body water was estimated based on the measures of impedance and height with the aid of equations that have been validated for patients with CP.9 Fat-free mass (FFM) was determined by
dividing total body water by specific hydration factors for sex and age group.10 Fat mass (FM) was
determined by subtracting FFM from body weight. Due to the height deficit common to children with CP, FFM and FM were adjusted for height following the model proposed by Wells & Cole (2002).11 The division of these two measures by height squared (FFM/height2 and FM/height2) determined the fat-free mass index (FFMI) and fat mass index (FMI). The percentage of fat mass (%FM) was determined by the following equation: %FM = (FMI/weight) x 100.
FFMI reference values were used to compare the body composition of the children with CP to that of healthy children.12 Excess FM was diagnosed using the criteria proposed by Lohman (1987),13 in which rates higher than 18% and 25% for boys and girls, respectively, were classified as excess fat.
2.4 FOOD CONSUMPTION
The evaluation of calorie and macronutrient intake was performed using a 24-hour log. The Dietary Reference Intakes proposed by the US Food and Nutrition Board in 200214 were used to estimate the prevalence of inadequacies with regard to calorie, protein and carbohydrate intake. A second 24-hour log from a random selection of 20% of the children was used to determine intra-individual variations in food intake.
The adjustment of the distribution of calorie, protein and carbohydrate intake was performed with the removal of the effect of intra-individual variability using the method proposed by Iowa State University.15,16 The prevalence of inadequate calorie, protein and carbohydrate intake corresponded to the proportion of individuals whose intake was below the estimated energy requirement and
estimated average requirement.14 Calorie and nutrient intake was estimated with the aid of the NutWin software program. Excessive calorie intake was calculated based on the mean need of the participants + 2 standard deviations (SD).
As there is no mean estimated lipid requirement (only adequate intake), it was not possible to estimate the proportion of inadequate intake. Thus, the evaluation was performed using the acceptable distribution range as reference.14
The age groups recommended for the Dietary References Intakes are one to three years and four to eight years.14 Therefore, the sample was subdivided into two groups based on the age range
of the children in the present study (three years and four to seven years).
2.5 STATISTICAL ANALYSIS AND ETHICAL ASPECTS
Statistical analysis was performed using the Statistical Package for the Social Sciences (SPSS for Windows version 13.0, SPSS Inc., Chicago, IL, USA). The Kolmogorov-Smirnov test determined that all data demonstrated Gaussian (normal) distribution. Thus, Pearson’s correlation coefficients were calculated for the determination of correlations between variables. The chi-square test was used to investigate associations between excessive calorie intake and both excess weight and body fat. A p-value < 0.05 was considered indicative of statistical significance.
This study received approval from the Human Research Ethics Committee of Universidade
Federal de Pernambuco, Brazil (certificate number: 63607416.7.0000.5208). The guardians received
clarifications regarding the objectives and procedures of the study and those who agreed to the participation of their children signed a statement of informed consent authorizing the publication of the results.
3 RESULTS
Fifty-three children (mean age: 4.6 ± 1.2 years) participated in the study, 36 of whom were in the four to seven-year-old age group and 32 were boys. A total of 73% of the families had an income of 0.5 times the Brazilian monthly minimum wage and 79.2% did not receive any government benefits. The mother was the main caregiver in 88.7% of cases and 57.2% of mothers had a high school education or higher.
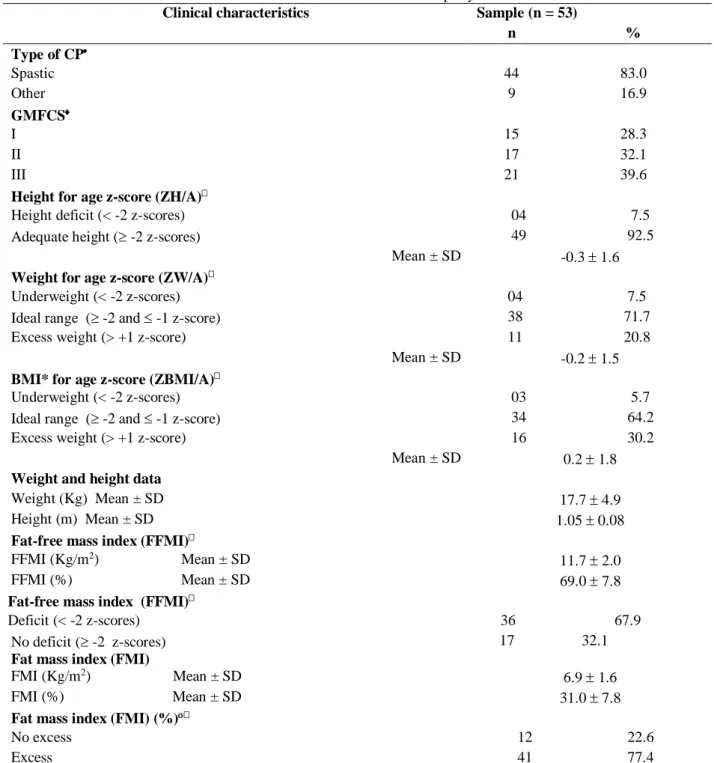
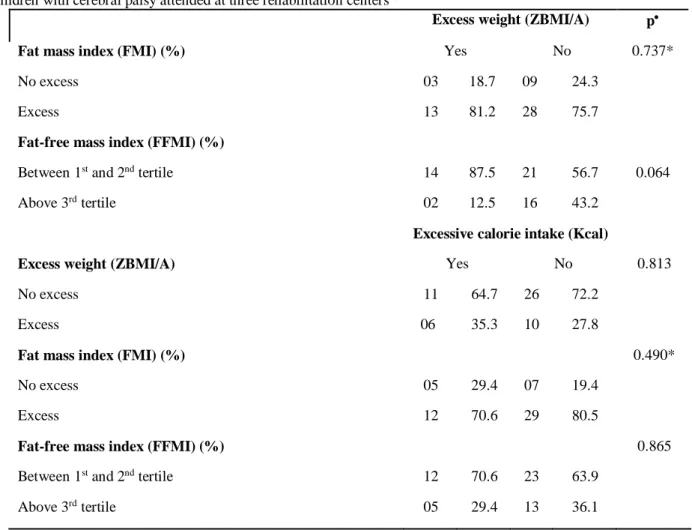
Table 1 displays the clinical and nutritional characteristics of the sample. Table 2 shows that there was no statistically significant association between excess weight and excess FM or FFM. Moreover, no significant association was found between excessive calorie intake and excess weight, FM or FMM.
Table 1 – Clinical and nutritional characteristics of children with cerebral palsy attended at three rehabilitation centers
CP: cerebral palsy; GMFCS: Gross Motor Function Classification System; *BMI: body mass index. Excess > 18% for
boys and > 25% for girls; No statistically significant difference between sexes
Clinical characteristics Sample (n = 53)
n % Type of CP Spastic 44 83.0 Other 9 16.9 GMFCS I 15 28.3 II 17 32.1 III 21 39.6
Height for age z-score (ZH/A)
Height deficit (< -2 z-scores) 04 7.5
Adequate height ( -2 z-scores) 49 92.5
Mean ± SD -0.3 1.6
Weight for age z-score (ZW/A)
Underweight (< -2 z-scores) 04 7.5
Ideal range ( -2 and -1 z-score) 38 71.7
Excess weight (> +1 z-score) 11 20.8
Mean ± SD -0.2 1.5
BMI* for age z-score (ZBMI/A)
Underweight (< -2 z-scores) 03 5.7
Ideal range ( -2 and -1 z-score) 34 64.2
Excess weight (> +1 z-score) 16 30.2
Mean ± SD 0.2 1.8
Weight and height data
Weight (Kg) Mean ± SD 17.7 4.9
Height (m) Mean ± SD 1.05 0.08
Fat-free mass index (FFMI)
FFMI (Kg/m2) Mean ± SD
11.7 2.0
FFMI (%) Mean ± SD 69.0 7.8
Fat-free mass index (FFMI)
Deficit (< -2 z-scores) 36 67.9
No deficit ( -2 z-scores)
Fat mass index (FMI)
17 32.1 FMI (Kg/m2) Mean ± SD
6.9 1.6
FMI (%) Mean ± SD 31.0 7.8
Fat mass index (FMI) (%)
No excess 12 22.6
Table 2 – Excess fat mass and fat-free mass according to occurrence of excess weight and excessive calorie intake among
children with cerebral palsy attended at three rehabilitation centers
Excess weight (ZBMI/A) p
Fat mass index (FMI) (%) Yes No 0.737*
No excess 03 18.7 09 24.3
Excess 13 81.2 28 75.7
Fat-free mass index (FFMI) (%)
Between 1st and 2nd tertile 14 87.5 21 56.7 0.064
Above 3rd tertile 02 12.5 16 43.2
Excessive calorie intake (Kcal)
Excess weight (ZBMI/A) Yes No 0.813
No excess 11 64.7 26 72.2
Excess 06 35.3 10 27.8
Fat mass index (FMI) (%) 0.490*
No excess 05 29.4 07 19.4
Excess 12 70.6 29 80.5
Fat-free mass index (FFMI) (%) 0.865
Between 1st and 2nd tertile 12 70.6 23 63.9
Above 3rd tertile 05 29.4 13 36.1
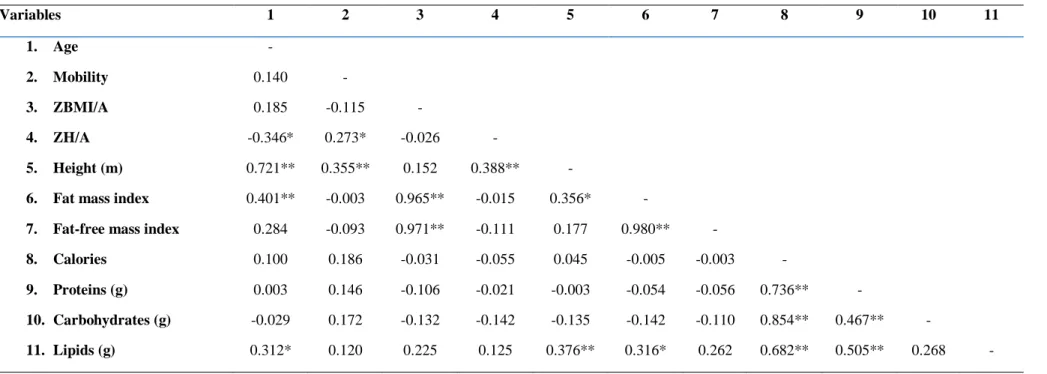
Table 3 – Correlation matrix for anthropometric, body composition and dietary variables among children with cerebral palsy attended at three rehabilitation centers Pearson’s
correlation test; *significance level p < 0.05; ** significance level p < 0.01
The data in Table 3 show that there was collinearity in the following pairs of variables: ZBMI/A and FMI (r = 0.965), ZBMI/A and FFMI (r = 0.971) as well as FMI and FFMI (r = 0.980). ZH/A was negatively correlated with age and positively correlated with mobility. Height was positively correlated with age, mobility and ZH/A. FMI was positively correlated with age and height. With regard to food intake variables, only lipids demonstrated positive correlations with age, height and FMI.
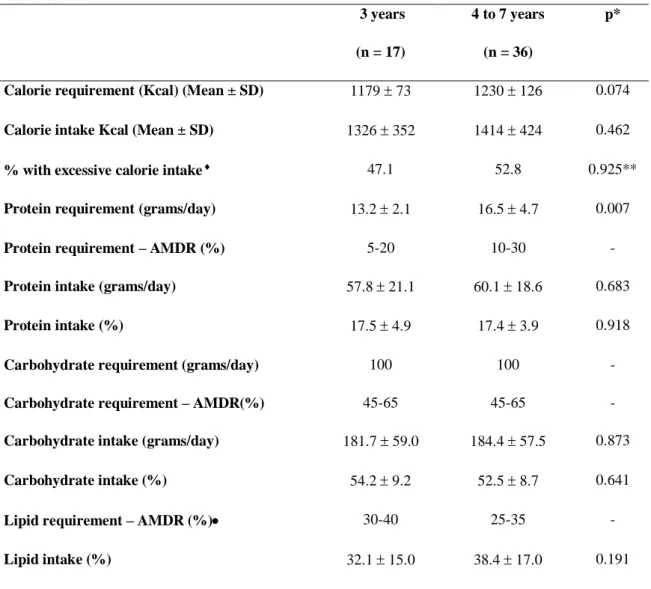
Table 4 shows that there were no statistically significant differences in calorie and macronutrient intake between the three-year-old and four-to-seven-year-old age groups. However, a statistically significant difference was found with regard to protein requirement, which was higher in the children aged four to seven years (p = 0.007). No significant difference was found with regard to protein intake, but intake was well above the requirement. These data demonstrate that calorie and macronutrient intake was similar in the sample independently of age group.
Variables 1 2 3 4 5 6 7 8 9 10 11 1. Age - 2. Mobility 0.140 - 3. ZBMI/A 0.185 -0.115 - 4. ZH/A -0.346* 0.273* -0.026 - 5. Height (m) 0.721** 0.355** 0.152 0.388** -
6. Fat mass index 0.401** -0.003 0.965** -0.015 0.356* -
7. Fat-free mass index 0.284 -0.093 0.971** -0.111 0.177 0.980** -
8. Calories 0.100 0.186 -0.031 -0.055 0.045 -0.005 -0.003 -
9. Proteins (g) 0.003 0.146 -0.106 -0.021 -0.003 -0.054 -0.056 0.736** -
10. Carbohydrates (g) -0.029 0.172 -0.132 -0.142 -0.135 -0.142 -0.110 0.854** 0.467** -
In the three-year-old group, 32.1% had inadequate calorie intake, 0.70% had inadequate protein intake and 0.20% had inadequate carbohydrate intake. Among the four-to-seven-year-old children, 29% had inadequate calorie intake, 0.40% had inadequate protein intake and 0.10% had inadequate carbohydrate intake. These results demonstrate calorie and macronutrient intake well above the needs of the two groups.
Table 4 – Calorie and macronutrient intake according to estimated energy requirements, requirements in grams and
acceptable macronutrient distribution range (AMDR%) among children with cerebral palsy attended at three rehabilitation centers 3 years (n = 17) 4 to 7 years (n = 36) p*
Calorie requirement (Kcal) (Mean ± SD) 1179 73 1230 126 0.074
Calorie intake Kcal (Mean ± SD) 1326 352 1414 424 0.462
% with excessive calorie intake 47.1 52.8 0.925**
Protein requirement (grams/day) 13.2 2.1 16.5 4.7 0.007
Protein requirement – AMDR (%) 5-20 10-30 -
Protein intake (grams/day) 57.8 21.1 60.1 18.6 0.683
Protein intake (%) 17.5 4.9 17.4 3.9 0.918
Carbohydrate requirement (grams/day) 100 100 -
Carbohydrate requirement – AMDR(%) 45-65 45-65 -
Carbohydrate intake (grams/day) 181.7 59.0 184.4 57.5 0.873
Carbohydrate intake (%) 54.2 9.2 52.5 8.7 0.641
Lipid requirement – AMDR (%) 30-40 25-35 -
Lipid intake (%) 32.1 15.0 38.4 17.0 0.191
* Student’s t-test ** chi-square test intake above mean of calorie requirement + 2 SD = more than 1325 Kcal (3 years)
and more than 1482 Kcal (4 to 7 years) no estimated average requirement reference for lipids
4 DISCUSSION
The nutritional status of the children with CP was similar to that reported in the III Pesquisa
Estadual de Saúde e Nutrição (III PESN [Third State Health and Nutrition Survey]) conducted in the
state of Pernanbuco, Brazil in 2006,17 which revealed height deficit in 7.7% of children less than five
years of age. In the present study, height deficit was found in 7.5% of the children. The data in the survey on W/A (3.0%) and BMI/A (1.9%) reveal that the problem of childhood malnutrition in
Pernambuco is practically at the control threshold (2.3%). The data in the present study on W/A (7.5%) and BMI/A (5.7%) show that underweight is a problem with these children, demonstrating that the process of nutritional transition is occurring, but at a slower rate in children with CP less than five years of age.
The III PESN17 revealed that 8.8% of children less than five years of age in the state of Pernambuco had excess weight based on BMI/A + 2 z-scores. Using the same cutoff point, the prevalence in the present study was 9.8%. As the prevalence in a healthy population should not surpass 2.3%, the problem of excess weight in the children with CP is worrisome and reflects what is occurring in the child population as a whole. In contrast, Pascoe et al. (2016)18 found a lower
prevalence rate of excess weight among children with CP compared to those with typical development. However, studies conducted in the United States,19 Korea20 and China21 found no
differences in the prevalence of excess weight among children with CP compared to children in general. This lack of a difference may be explained by the fact that the individuals in the studies cited belonged to the group with lower motor impairment.
The prevalence of excess weight (BMI/A +2 z-scores) in the literature ranges from 5.8% to 16.5%.19,20,21 This variation may be due to the methodological differences in the studies. Nonetheless, all these rates surpass the expected prevalence in a healthy population (2.3%).
Children with CP, especially those with more impairments, demonstrate lower linear growth.22 However, this was not confirmed in the present investigation, as the prevalence of short height was similar to that reported in the state survey (III PESN).17 Moreover, a positive correlation was found between age and height, whereas a negative correlation was found between age and ZH/A, demonstrating that the children gained height with age, but not enough to maintain them on the ZH/A curve.
In recent years, an increase has been found in excess weight and body fat in less impaired children with CP who are relatively inactive.19,20 In the present sample, besides the high frequency of excess weight (30.1% above the +1 z-score), 77.4% exhibited excess body fat, indicating that this problem affects even children classified in the ideal range for BMI. It is noteworthy that no association was found between excess weight and body fat, possibly due to the homogeneity of the sample in terms of body composition. In contrast, Walker et al. (2015)23 found that children with
moderate CP had lower levels of FFM compared to those with mild CP.
No correlations were found between mobility and anthropometric variables. This finding may have been due to the homogeneity of the sample in terms of mobility.
The findings demonstrate that the majority of the children exhibited lean mass deficit, which, according to the literature, may be directly related to inadequate linear growth as well as the depletion
of muscle and atrophy due to disuse.23 Factors such as the suppression of growth hormone as well as reductions in muscle sarcomeres, fiber size and muscle capacity for longitudinal and transverse growth may further aggravate this condition.24
No differences in body composition were found according to the degree of mobility. However, the literature reports that children with mild CP have more FFM and a lower percentage of body fat compared to individuals with more severe CP.1,23 A recent study found that children with CP on all
levels of mobility had quantities of excess fat and FFM below the mean in comparison to normal children, but weight and BMI were similar.1 The same study reports a positive correlation between
calorie intake and FFM, especially in less impaired children, which is in agreement with data described by Walker et al. (2012),2 suggesting the hypothesis that children with a higher level of physical activity have greater FFM and, therefore, more energy consumption due to the greater need. However, this was not confirmed in the present study, as demonstrated by the lack of a correlation between these variables.
With regard to food intake, no correlations were found between calorie intake or macronutrient intake (with the exception of lipids) and anthropometric variables (ZBMI/A, FMI and FFMI). This lack of correlation may have been due to the inherent bias of food intake measurement techniques, with the possible underestimation of calorie and macronutrient intake. A previous study found that children with CP on all levels of mobility demonstrated similar anthropometric variables, body composition, calorie intake and macronutrient intake compared to children with typical development.2
The results also reveal quite homogeneous food intake in the sample, as mean calorie and macronutrient intake was similar between the two age groups and above their requirements. Mean calorie intake above the requirements is also demonstrated by the fact that excessive calorie intake was found in nearly 50% of the sample. Moreover, protein and carbohydrate intake corresponded to threefold and twofold the requirements, respectively. This high intake could explain the high prevalence of excess weight encountered. However, no statistically significant association was found between excess weight and the occurrence of excessive calorie intake. It is possible that the small sample size impeded the determination of such an association. The finding with regard to the high-protein diet is in agreement with data reported in some studies.2,25 Moreover, there were no cases of
inadequate protein or carbohydrate intake. With regard to lipids, it was not possible to determine inadequacy due the absence of estimated average requirement values.
Among 16 studies published between 2003 and 2013 analyzed in a systematic review on food intake among Brazilian children,26 four reported calorie intake above the requirements and three
reported deficient calorie intake. However, it is difficult to compare results regarding excessive calorie intake with the present findings due to methodological differences in the evaluation of intake.
The prevalence of inadequate calorie intake was close to 30%. In a study with a similar methodology performed with data from the Second State Health and Nutrition Survey conducted in Pernambuco in 1997, Fidelis & Osório27 found high percentages of inadequate calorie intake (55.2% among children aged four and five years). As these data are from 20 years ago, the prevalence of inadequacy should currently be much lower, perhaps around the 30% found in the present study.
The findings demonstrate that the food intake of the children with CP in the present study did not differ significantly from that of children with typical development. However, other investigations found that children with CP had lower intake than children in general and that this situation was further aggravated by the increase in the degree of motor impairment.2,25 Another possible explanation for the findings is that there is no justification for a reduction in calorie intake among the children in the present study, as none had any problems related to chewing or swallowing and all fed themselves in an independent manner. The 30% prevalence rate of inadequate calorie intake may be associated with the unfavorable socioeconomic status of some families, although the majority of mothers had a good level of schooling.
The limitation of the present study was the use of a convenience sample from three rehabilitation centers, which implies a reduction in the possibility of extrapolating the findings to the population of children with CP in general.
5 CONCLUSION
The nutritional status and food intake of the children with CP in the present study were similar to those of children with no neurological impairment, possibly due to the fact that the children evaluated did not exhibit severe motor impairment. Further studies are needed to investigate what parameters and reference standards would be more adequate for the nutritional assessment of less impaired children with cerebral palsy. Investigations with quantitative and qualitative evaluations of food intake in the population are also needed, as such studies are scarce in the literature.
ACKNOWLEDGMENTS
The authors are grateful to the Associação de Assistência à Criança Deficiente (AACD [Association for Aid to Disabled Children), the Perrone Foundation and the hospital of the Universidade Federal
REFERENCES
1. Oftedal S, Davies PSW, Boyd RN, Stevenson RD, Ware RS, Keawutan P. et al. Body composition, diet, and physical activity: a longitudinal cohort study in preschoolers with cerebral palsy. Am J Clin Nutr. 2017;105(2):368-378. https://doi: 10.3945/ajcn.116.137810
2. Walker JL, Bell KL, Stevenson RD, Weir KA, Boyd RN, Davies PSW. Relationships between dietary intake and body composition according to gross motor functional ability in preschool-aged children with cerebral palsy. Ann Nutr Metab. 2012;61:349–357. https://doi.org/10.1159/000342557
3. Palisano R, Rosenbaum P, Walter S, Russell D, Wood E, Galuppi B. Development and reliability of a system to classify gross motor function in children with cerebral palsy. Dev Med Child Neurol. 1997;39(4):214-223. https://doi.org/10.1111/j.1469-8749.1997.tb07414.x
4. Brasil. Ministério da Saúde. Secretaria de Atenção à Saúde. Departamento de Atenção Básica. Orientações para a coleta e análise de dados antropométricos em serviços de saúde: norma técnica do Sistema de Vigilância Alimentar e Nutricional – SISVAN. Brasília: Ministério da Saúde, 2011. 76p. (Série G. Estatística e Informação em Saúde)
5. Stevenson R, Roberts C, Vogtle L. The effects of non-nutritional factors on growth in cerebral palsy. Dev Med Child Neurol. 1995;37(2):124-130. https://doi.org/10.1111/j.1469-8749.1995.tb11981.x
6. World Health Organization. WHO Child Growth Standards: Length/height-for-age, weight-for-age, weight-for-length, weight-for-height and body mass index-for-age – Methods and development. WHO (nonserial publication). Geneva, Switzerland: WHO, 2006.
7. World Health Organization. WHO. Deonis M, Onyango AW, Borghi E, Siyam A, Nishida C, Siekmann J. Development of a WHO growth reference for school-aged children and adolescents. Bulletin of the World Health Organization 2007:WHO, 2007.
8. Heyward, V; Stolarczyk, L. Avaliação da Composição Corporal Aplicada. 1 ed. São Paulo: Manole. 2000. 241p.
9. Bell KL, Boyd RN, Walker JL, Stevenson RD, Davies PSW. The use of bioelectrical impedance analysis to estimate total body water in Young children with cerebral palsy. Clinical Nutrition.2013;32:579-584. http:// 10.1038/ejcn.2013.223
10. Fomon SJ, Haschke, F, Ziegler EE, Nelson SE. Body composition of reference children from birth to age 10 years. Am J Clin Nutr.1982;35(5):1169-1175. http:// 10.1093/ajcn/35.5.1169
11. Wells JCK, Cole TJ. Adjustment of fat-free mass and fat mass for height in children aged 8 years. J Obes Relat Metab Disord. 2002;26(7):947-952.
12. Laurson KR, Eisenmann JC, Welk GJ. Body fat percentile curves for U.S. children and adolescents. Am J Prev Med. 2011;41(4):87-92.
13. Lohman TG. The use of skinfold to estimate body fatness on children and youth. JOPERD. 1987;58(9):98-103. https://doi.org/10.1080/07303084.1987.10604383
14. Institute of Medicine. Dietary reference intake for energy, carbohydrate, fiber, fat, fatty acids, cholesterol, protein, and amino acids. Washington: The National Academies Press; 2002.
15. Guenther, PM.; Kott OS.; Carriquiri, AL. Development of an approach for estimating usual nutrient intake distributions at the population level. J Nutr. 1997;127(6):1106-1112. http:// 10.1093/jn/127.6.1106
16. Carriquiri, AL. Assessing the prevalence of nutrient inadequacy. Public Health Nutr. 1999;2(1):23-33.
17. III Pesquisa Estadual de Saúde e Nutrição (PESN). Situação Alimentar, nutricional e de saúde no estado de Pernambuco: contexto socioeconômico e de serviços. Departamento de Nutrição-UFPE, Instituto Materno Infantil de Pernambuco e Secretaria Estadual de Saúde de Pernambuco, 2008.
18. Pascoe J, Thomason P, Graham HK, Reddihough D, Sabin MA. Body mass index in ambulatory children with cerebral palsy: a cohort study. J Paediatr Child Health. 2016; 52(4):417-421. https://doi.org/10.1111/jpc.13097
19. Rogozinski BM, Davids JR, Davis RB, Christopher LM, Anderson JP, Jameson GG. et al. Prevalence of obesity in ambulatory children with cerebral palsy. J Bone Joint Surg Am. 2007;89(11):2421-2426.
20. Park ES, Chang WH, Park JH, Yoo JK, Kim SM, Rha DW. Childhood obesity in ambulatory children and adolescentes with spastic cerebral palsy in Korea. 2011;42(2):60-66. http:// 10.2106/JBJS.F.01080
21. Wang F, Cai Q, Shi W, Jiang H, Li N, Ma D. et al. A Cross-sectional Survey of Growth and Nutritional Status in Children With Cerebral Palsy in West China. Pediatr Neurol. 2016;58:90-97. https://doi.org/10.1016/j.clnesp.2018.05.002
22. Stevenson RD, Conaway M, Chumlea WC, Rosenbaum C, Fung EB, Henderson RC. et al. Growth and health in children with moderate-to-severe cerebral palsy. Pediatrics. 2006;118(3):1010-1018.
23. Walker JL, Bell KL, Stevenson RD, Weir KA, Boyd RN, Davies PS. Differences in body composition according to functional ability in preschool-aged children with cerebral palsy. Clin Nutr. 2015;34(1):140-145.
24. Mathewson MA, Lieber RL. Pathophysiology of Muscle Contractures in Cerebral Palsy. Phys Med Rehabil Clin Am. 2015;26(1):57-67. http://doi. 10.1016/j.pmr.2014.09.005
25. Sangermano M, D’Aniello R, Massa G, Albano R, Pisano P, Budetta M. et al. Nutritional problems in children with neuromotor disabilities: an Italian case series. Ital J Pediatr. 2014;40-61. https://doi: 10.1186/1824-7288-40-61
26. Carvalho CA, Fonsêca PCA, Priore SE, Franceschini SCC, Novaes JF. Consumo alimentar e adequação nutricional em crianças brasileiras: revisão sistemática. Rev Paul Pediatr. 2015;33(2):211-221. http://dx.doi.org/10.1016/j.rpped.2015.03.0020103-0582/
27. Fidelis CM, Osório MM. Dietary intake of macro and micro-nutrients by children under five years of age in the State of Pernambuco, Brazil. Rev Bras Saúde Matern Infant. 2007;7(1):63-74. http://dx.doi.org/10.1590/S1519-38292007000100008