15ª Conferência da Associação Portuguesa de Sistemas de Informação (CAPSI 2015) 02 e 03 de Outubro de 2015, Lisboa, Portugal
ISSN 2183-489X
DOI http://dx.doi.org/10.18803/capsi.v15.17-35
17 Bruno Padinha, ISCTE-IUL – University of Lisbon, Portugal, [email protected]
Henrique O’Neill, ISCTE-IUL – University of Lisbon, Portugal, [email protected]
Abstract
With the growing, pervasive use of information systems (IS) by most organizations, particularly companies in technology-intensive businesses like banking, questions arise as to the effective success of those systems, how to measure it and, most of all, what influences it. User satisfaction, even if not an end goal of IS organizations, is frequently used as a measure of that success and it has been empirically shown to correlate with other more direct measures. The research reported here looked at what influences user satisfaction, particularly what characteristics of information systems and their development processes tend to result in higher user satisfaction, in the specific case study of a Portuguese bank, which conducts a comprehensive survey every year to measure the satisfaction of its thousands of IS users regarding its numerous information systems. Additional primary data was collected to characterize the information systems and their development processes, which, once structured and standardized alongside the user satisfaction survey results provided the basis for a quantitative analysis of the relationships between IS success, measured by user satisfaction, and its antecedents, using correlation and multiple linear regression techniques. The significant relationships are analyzed and the conceptual model’s results discussed in light of prior theory on the subject. Several implications for the practice and research communities are finally identified. Keywords: information systems success; information systems design; user satisfaction; banking information systems.
1.
INTRODUCTION
It is quite common nowadays for companies and governmental organizations to use information systems (IS)1 to automate activities and support their business activities. These systems enable organizations to
become more effective and efficient in delivering products and services to their customers and have become therefore intrinsic to the businesses themselves, as is the case of many high-tech enabled industries like banking and telecommunications, which could not exist in their modern form without extensive use of information systems. Banks and other financial services institutions are a case in point, spending between 5% and 9% of their operating income in information technology (IT) [Gopalan et al. 2012]. A direct contribution of IT assets and capabilities to the increase of productivity and general performance of businesses
1 The expression Information System, as applied here, means a specific application of Information Technology to some strict set of functional needs of a company or organization such as the Bank, for a certain business process or function. Throughout the text, groups of these information systems are sometimes referred to as an application, the term that the (studied) Bank’s IT management employs when communicating to the users to measure their satisfaction. Other authors deal with the ambiguity of the expression with a broader definition of Information System, such as “[…] either some aspect of an application of information technology (IT), one individual application, a group of applications (including those of an entire organization), or an application of one type of IT.” [Seddon 1997].
15ª Conferência da Associação Portuguesa de Sistemas de Informação (CAPSI 2015) 18 across many sectors of the economy has been reported [Bharadwaj 2000; Farrell et al. 2002]. For example, a study of public banks in the US concluded that “a firm’s IT capability is crucial for its competitive advantage” [Lin 2007].
As a result, bank employees are frequent users of information systems, which give them access to customers, products and services information, and allow them to process transactions of all kinds. The systems are usually heterogeneous, based on different technologies, with various user interfaces and functionalities and differing integration levels of the captured and processed information [Heidmann 2010].
Because system use is usually compulsory for users, it happens that they exhibit varying levels of satisfaction regarding each system, according to how they perceive it or not as an efficient, effective tool for accomplishing their tasks and responsibilities. In general, this user satisfaction is derived both from how each information system supports them in the fulfillment of their day-to-day activities, as well as, in a broader sense, from how easy the system is to learn and use, how quickly and responsively it performs the needed calculations and other information processing tasks and how effective the information systems department is at developing, operating and maintaining the organizations’ information systems, among other factors [Al-Maskari et al. 2010].
For the information systems department of such a large and complex organization as the typical bank, the user satisfaction is very important to measure and monitor, not only because users are their immediate, internal customers, but also because it has been shown that it is usually an acceptable and objectively- measurable proxy for the success of the IS organization [Sedera et al. 2005].
If user satisfaction measures the success of the information systems of an organization, a natural question arises, then, of what can management do to increase it in a significant and sustainable way?
It is immediately apparent that for the most part, user satisfaction cannot be changed directly, since it is based on a subjective perception, but rather it has to be influenced via the more objective characteristics of the information systems and the IS organization that provides them, such as their technical, their development processes and the organizational and governance models of the entities that manage the information systems of an organization.
Many of the decisions in these areas are, understandably, also not trivial. Management has to analyze and decide upon information systems’ topics like those and hope to make the right decisions regarding their influence on the ultimate success of the information systems, which will be patent in user satisfaction as well as in actual benefits accrued from their usage.
The research reported here comprised the study of a specific case, that of a Portuguese bank, which has numerous information systems and whose management is keen on conducting a yearly appraisal of the satisfaction of its users (just referred to as “the Bank” for confidentiality).
15ª Conferência da Associação Portuguesa de Sistemas de Informação (CAPSI 2015) 19 Throughout the years, questions have arisen as the Bank observes the ups and downs of user satisfaction with each of its main information systems and attempts to identify their root causes, in the hope of reinforcing the positive ones and eliminating or at least minimizing the negative ones. While the Bank’s IS management attempts to identify and isolate the reasons that lead to the evolution of user satisfaction, there had never been a systematic and objective search for its antecedents.
That was an important factor driving the execution of this study, since the increasing challenges of providing more IT and IS services, with a budget that is regularly expected to decrease, require a comprehensive understanding of what leads to users satisfaction and therefore, ultimately, to IS success. This research looked at the case study of this bank in light of the existing knowledge in the field of Information Systems Research, in particular the findings regarding user satisfaction, information systems adoption and success and its antecedents. The main objectives were, in summary, to increase the understanding of the relationship between satisfaction and the characteristics of information systems and their development processes in the specific case of this Bank. With that in mind, the problem was formulated as follows: Which characteristics of information systems and their development processes influence user satisfaction?
2.
METHODS
2.1. Research design
Given the stated problem and research objectives already presented above, the approach chosen was that of a case study, which has benefited from the long-term relationship of the author as a consultant with the Portuguese bank that was the object of the study. This research initiative was conceived as descriptive, leaning essentially on the collection and analysis of quantitative data.
Focusing on a specific case study allowed for a deep analysis of the details of the Bank’s information systems, eliciting rich information on their characteristics, the Bank’s development processes and the ultimate user satisfaction with the applications, as well as ensuring that information was interpreted in the correct context, an important tenet of the case study method.
2.2.
Object of the studyThe Bank is a medium-sized financial institution operating in the Portuguese Market since the early 20th century, with net assets of 13 billion euros and close to 700 branches at the end of 2013.
The group includes the core banking operating units as well as specialized companies operating in related businesses. In addition, there are a number of corporate and shared service centers providing centralized support functions like marketing, legal and IT.
The Information Systems and Information Technology shared service center fulfills the role of an IS department of the Bank and other group companies, providing the hardware, software and services that
15ª Conferência da Associação Portuguesa de Sistemas de Informação (CAPSI 2015) 20 enable the use of information technology by the business units. That center was therefore the main source of data for this study, and is henceforth referred to as “the Bank’s IS Department” or simply “the IS Department”.
2.3.
Theoretical and conceptual frameworkThe relevant literature was reviewed, starting with the seminal papers on the key topics of information systems success, user satisfaction, technology acceptance and software development, then proceeding to include their references and subsequent references, as well as other research and documentation found via keyword search for specific topics. Several important theoretical and conceptual constructs emerged from this review, which informed the subsequent design and field work.
The idea for this research came from the practice of the Bank’s IS Department to measure the users’ satisfaction every year with a comprehensive survey. This prompted the question of what can management do to increase that satisfaction, which could be informed by an analysis of processual determinants that were likely to have a positive or negative influence in the user’s satisfaction. Satisfaction, therefore, took the place of dependent variable and a quest ensued to identify suitable independent variables to test. Even though user satisfaction is a perception, therefore a subjective measure, the research strived to collect and analyze real, objective measures like training and testing approaches.
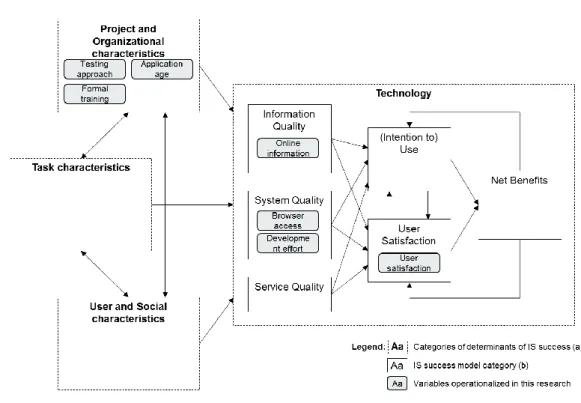
In order to design a conceptual model for this research consistent with the theory and which can be applied to the case study, a preliminary interview took place with the Bank’s IS Department leadership foridentifying which data was available to operationalize variables that corresponded to the concepts and constructs in the literature, particularly the D&M model [DeLone et al. 1992; DeLone et al. 2003] and its more recent taxonomy of IS success determinants [Petter et al. 2013]. This lead to the identification and subsequent collection and standardization of data related to the main variables and constructs, which are grouped according to those models and associated research in Figure 1. Based on the collected data, the simpler conceptual model for this study was then designed, as presented in Figure 2.
15ª Conferência da Associação Portuguesa de Sistemas de Informação (CAPSI 2015) 21 Figure 1 – Collected variables shown in light of theoretical research and models (sources: (a) [Petter et al. 2013], (b)
[DeLone et al. 2003])
15ª Conferência da Associação Portuguesa de Sistemas de Informação (CAPSI 2015) 22
2.4.
Data collectionOnce the conceptual basis was established, research then proceeded with the collection of data related to the user satisfaction as well as the characteristics of the Bank’s information systems and their development processes which could serve to operationalize the dependent and independent variables in the research model.
The collected data covers a time span of five years, from 2008 to 2012, which existed thanks to the Bank’s commitment to regularly monitor its IS business processes and annually measure the corresponding user satisfaction.
The Bank’s IS Department conducts three yearly satisfaction surveys: an IS user satisfaction survey, a management IS satisfaction survey and an internal IS employee satisfaction survey. All of these are issued electronically to the Bank’s employees, with the responses being collected anonymously and analyzed by an external entity. The first of those surveys was used as the source of information for operationalizing the dependent variable in this research. It has consistently high response rates, above 40%.
The set of responses to those surveys over a five year period (2008 through 2012) was used as data for the dependent variable, The user satisfaction surveys considerably resemble some of the most widely used instruments for measuring satisfaction found in the literature review [Bailey et al. 1983; Doll et al. 1988] and which have been empirically validated [Melone 1990]. They have three main sections, covering (i) the user’s satisfaction with the Bank’s information systems, (ii) the IS Department’s provision of services and (iii) the importance of those systems and services to the user. The data collection for the Satisfaction variable focused on the first o these sections.
Although some changes are made every year to the surveys, mainly to add questions related to newly introduced systems or services and to remove those which are no longer in use, the majority of the items related to the main banking applications have been regularly included in the surveys for at least a majority of the years included in the research. Each question in each questionnaire was associated, whenever possible, to a main application in the information systems inventory already collected, and coded numerically.
The user satisfaction survey questions ask the respondents’ to rate their satisfaction with each main application developed and operated by the Bank’s IS department. The responses are recorded in the form of a 4-point Likert-type item, a commonly used approach for measuring satisfaction [Bailey et al. 1983; Carifio et al. 2007; Melone 1990]. The employed scale has an even number of points which prevents indecisive responses, for which the users are asked to select the “Don’t know” option instead.
Although the same Likert-type scale was used in all the questionnaires, the coding of the responses was not exactly the same in each year. Therefore, carefully recoding of the survey responses was undertaken in a spreadsheet program and then all the responses were consolidated into a single satisfaction variable source file, carefully mapping each question to the appropriate application.
15ª Conferência da Associação Portuguesa de Sistemas de Informação (CAPSI 2015) 23
While Likert-type scales comprised of multiple items are commonly used for measuring user satisfaction, the use of single-item Likert-scales has also been published, as was the treatment of such variables as continuous, in fact widely used in many instruments to measure user satisfaction [Hayes 1998], and several authors back their use, if carefully applied, as continuous or, at least, ordinal variables [Botelho et al. 2011; Göb et al. 2007]. The operationalization of the variable for user satisfaction regarding each application in each year was achieved by averaging the valid responses from all users to the relevant question in that year’s questionnaire. The median was also calculated as an additional measure of satisfaction, but later discarded since it proved to be too limited in range for many analyses and did not yield significantly different results for the remaining ones.
While the dependent variable data came directly from those yearly user satisfaction surveys, the operationalization of the independent variables required the collection of and manipulation of data from many sources in order for it to be in a format that was compatible with the user satisfaction data, for which the approach will now be described.
An obstacle that had to be overcome in the data collection process was the level of detail at which the information systems in the Bank are analyzed and recorded: each of the Bank’s main applications is comprised of one or more underlying systems, each of them fulfilling a specific role. The Bank’s IS Department management provided an exhaustive inventory of these underlying systems, including key characteristics (names and short functional descriptions), vendors, types of technologies used, launch dates, how they were developed and to which main application they belong to.
While in the user satisfaction surveys’ questions, global application names are referred to, many other sources of information record the data at the underlying system level of detail. Since satisfaction was the driver for this research, in the cases in which data was collected at the system level of detail, it was aggregated in some way for all the systems which are associated with a specific application.
The IS Department regularly executes large-scale projects, which develop new features or even replace entire existing systems and applications altogether, as well as smaller-scale initiatives dealing with features requested by the end-users, and other smaller application maintenance initiatives.
Information was gathered on the projects and requests that were executed throughout the period in analysis, namely which ones contributed to the development of each system and application, how many person-days were employed, when did the activities take place and some of the methodological approaches undertaken.
Although some effort was spent trying to elicit additional information regarding these projects, sadly no other structured data could be obtained about the software development life-cycle, since the main change that was introduced at the Bank in this period, which was the level 2 CMMI certification of the development processes, was achieved precisely in 2007, prior to the projects under analysis taking place, which means that all of the projects for which data has been collected were implemented already following the new process model.
15ª Conferência da Associação Portuguesa de Sistemas de Informação (CAPSI 2015) 24
In total, 96 main projects, 142 user requests and 2,020 maintenance initiatives that took place from 2008 to 2012 were analyzed and either associated with the systems and applications that they dealt with or discarded if they did not directly affect the applications being studied. Each project was individually mapped to each of the Bank’s applications’ underlying systems and then finally aggregated for each of the main applications.
After all the information was collected and processed, tables summarizing and relating the various items were prepared and submitted for validation by the management of the IS Department of the Bank, in order to have an additional measure of confidence on the collected and processed data.
By combining the information on the applications and systems, on one hand, and projects, requests and initiatives, on the other, the independent variables where operationalized, grouped according to their ability to measure key concepts from the literature: (1) Project and Organizational characteristics and (2) application characteristics. In some cases, dummy variables were coded to represent the presence or absence in an application of certain characteristics in its underlying systems. For example, there were two alternative dummy codings related to the execution of formal acceptance tests for each underlying system associated with a certain application, the first one following a more conservative approach (1 only if formal acceptance tests took place for all underlying systems) and the second one a laxer approach (1 if any system went through testing). As described later, in the Results section, a correlation significance test led to the selection of the more robust of these two approaches. For convenience in some analysis, person-years were derived by accumulating 12 months of 21 days of 8 hours of work.
The final case file was then built by combining the independent variables with the appropriate lines in the application satisfaction case file.
2.5. Analysis of variable behavior and inter-relationships
After all the information was collected, validated, standardized and consolidated into a single case file, analysis started with descriptive measures of the dependent and independent variables: central tendency measures and dispersion measures. The evolution of satisfaction and of the independent variables over time was thus analyzed, as a whole, as well as per main application.
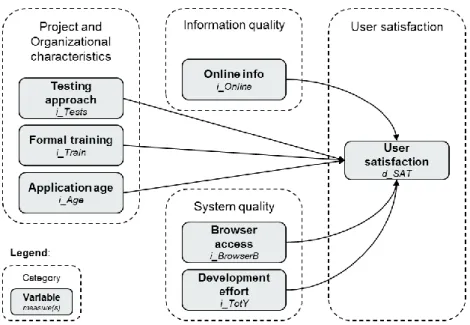
The next step focused on evaluating the correlation between the candidate independent variables and the dependent variable, User Satisfaction, after which some variables were considered for discarding and others were selected to be applied for operationalizing the conceptual model (Figure 2). This was required due to the already mentioned fact that there were several possible approaches to coding some of the literature concepts from the collected data. The final variables used to operationalize the conceptual model are shown in Figure 3.
15ª Conferência da Associação Portuguesa de Sistemas de Informação (CAPSI 2015) 25 Figure 3 – Variables used to operationalized the conceptual model
A number of linear regression models were then evaluated, taking into account the usual requirements on the data for this kind of analysis [Laureano 2011; Pestana et al. 2008]:
Several regression models were evaluated, each focusing on testing the relationship between User Satisfaction and one or more of the groups of variables in the conceptual model. Due to the number of cases containing all the relevant variables, in some instances only a few variables from each group could be tested, since regression analysis requires at least 10-15 cases per dependent variable [Stevens 1996].
The actually calculated models are listed in Table 1. Model #1 was created to test the influence in User Satisfaction of variables from the Project and Organizational (P&O) characteristics group, Model #2 analyzed the influence in User Satisfaction of Information Quality (IQ) and System Quality (SQ) and Model #3 looked after the influence in User Satisfaction of all three variable groups (P&O, IQ and SQ). If any non-significant variable was identified in any of the main models, a variant model, without that variable, was also created (#2b and #3b).
Model Dependent Variable Independent Variables
#1 Satisfaction (d_SAT) Testing approach (i_Tests) Formal training (i_Train) Application age (i_Age)
#2 Satisfaction (d_SAT) Online information (i_Online) Browser access (i_BrowserB) Development effort (i_TotY)
#2b Satisfaction (d_SAT) Online information (i_Online) Browser access (i_BrowserB)
#3 Satisfaction (d_SAT) Application age (i_Age) Online information (i_Online) Browser access (i_BrowserB) Development effort (i_TotY)
#3b Satisfaction (d_SAT) Application age (i_Age) Online information (i_Online) Development effort (i_TotY)
15ª Conferência da Associação Portuguesa de Sistemas de Informação (CAPSI 2015) 26 After running each model, its significance was checked, as was the strength of its explanatory ability, then each variable’s significance was checked as well and only then were the variables coefficients analyzed, in order to understand the strength and direction of the influence of each independent variable in the dependent variable.
3.
RESULTS
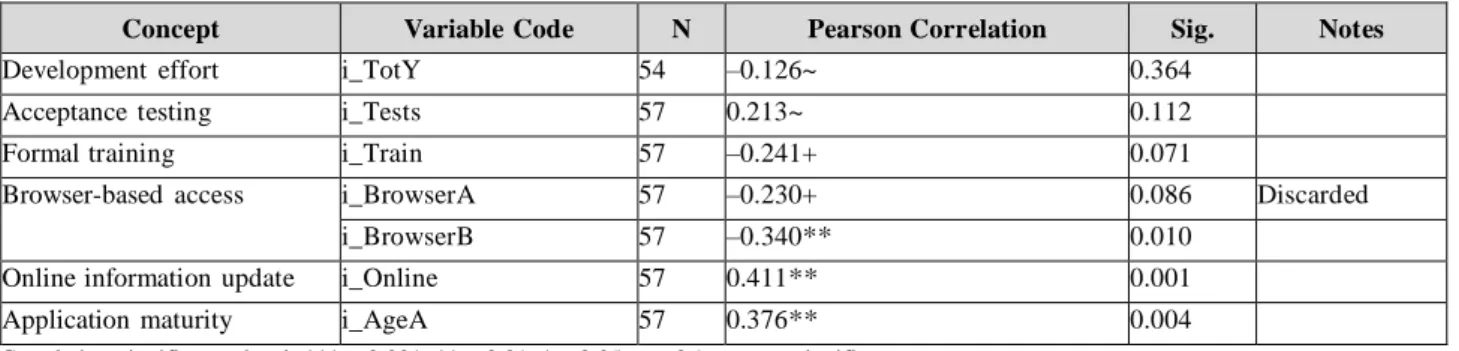
A correlation analysis performed between the dependent variable and each of the independent variables, summarized in Table 2, provides a preliminary evaluation of the relationships between the variables and the selection of those that shall be included in the subsequent analysis.
Concept Variable Code N Pearson Correlation Sig. Notes
Development effort i_TotY 54 –0.126~ 0.364
Acceptance testing i_Tests 57 0.213~ 0.112
Formal training i_Train 57 –0.241+ 0.071
Browser-based access i_BrowserA 57 –0.230+ 0.086 Discarded
i_BrowserB 57 –0.340** 0.010
Online information update i_Online 57 0.411** 0.001
Application maturity i_AgeA 57 0.376** 0.004
Correlation significance level: *** < 0.001, ** < 0.01, * < 0.05, + < 0.1, ~ = not significant
Table 2 – Analysis of correlation with Satisfaction – results and decisions
It emerges that several variables are significantly correlated with user satisfaction: the type of access to the application, whether the information in the information system is updated online or not, how old the underlying systems are and, with a weaker significance, whether formal classroom-training took place. Some other candidate independent variables proven not to be significantly correlated with the dependent variable but were still kept for subsequent analysis, to account for possible suppressor effects [Pandey et al. 2010].
The only discarded variable at this stage was one of the two alternate codings of the related to the type of user interface access provided to the users of the applications (i_BrowserA and i_BrowserB), since it became apparent from this analysis that the later, laxer approach, seemed to yield a stronger relationship with satisfaction of the user than the the former, more conservative approach.
The following step dealt with quantifying the eventual influence that each independent variable may have upon User Satisfaction, via linear multiple regression models.
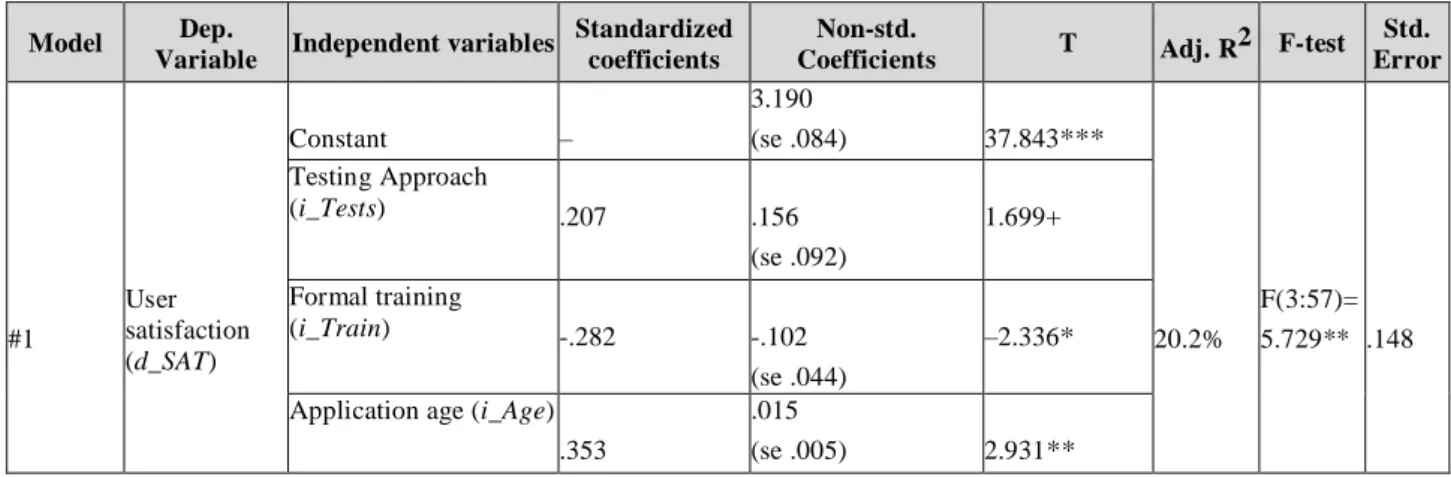
The first model, Model #1, focused on variables in the conceptual model (cf. Figure 3) which are associated with Project and Organizational characteristics. Its results are summarized in Table 3.
15ª Conferência da Associação Portuguesa de Sistemas de Informação (CAPSI 2015) 27
Model Dep.
Variable Independent variables
Standardized coefficients
Non-std.
Coefficients T Adj. R2 F-test
Std. Error #1 User satisfaction (d_SAT) Constant – 3.190 (se .084) 37.843*** 20.2% F(3:57)= 5.729** .148 Testing Approach (i_Tests) .207 .156 (se .092) 1.699+ Formal training (i_Train) -.282 -.102 (se .044) –2.336* Application age (i_Age)
.353
.015
(se .005) 2.931**
Correlation significance level: *** < 0.001, ** < 0.01, * < 0.05, + < 0.1, ~ = not significant se = standard error
Table 3 – Results of Model 1 – Influence of Project and Organizational variables in Satisfaction
The model appears to have a good fit (F statistic is significant), i.e., it is better at explaining variance in User Satisfaction than pure guesses. In fact, the Adjusted R2 shows 20.2% of the variance in user satisfaction is accounted for by that of the model’s dependent variables.
All the independent variables are significant (i.e. their variance effectively predicts some of the variance in User Satisfaction). In particular, the coefficients show there is a +.156 increment of Satisfaction for each unit increment in the Testing Approach variable (Formal Training and Application Age remaining constant). Similarly, there is a +.015 increment of User Satisfaction for each additional year of Application Age, all other variables remaining constant. Finally, the independent variable Formal Training has a negative influence on User Satisfaction, which decreases by -.102 for each unit decrease of that independent variable, et ceteris paribus.
Application Age is the variable with the strongest influence in User Satisfaction, with a change of one standard deviation in this variable resulting in a change of +.353 standard deviations in User Satisfaction. The second strongest influencer is Formal Training (-.282 standard deviations), followed by Testing Approach (+.207 standard deviations).
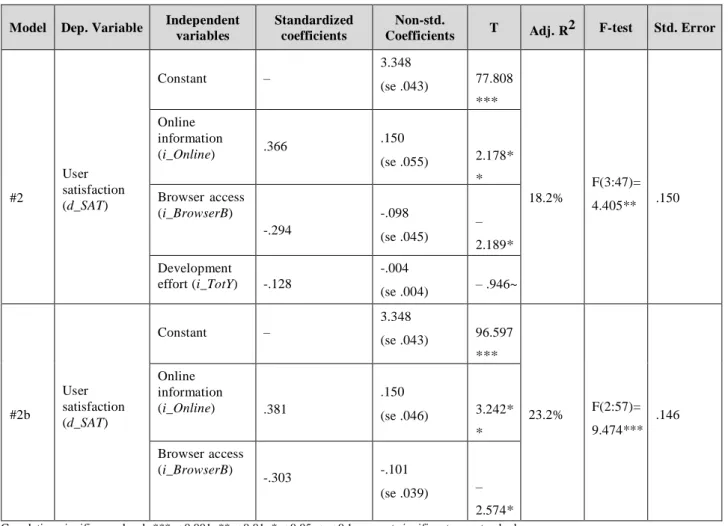
A second model, Model #2, was developed to focus on the variables in the conceptual model (cf. Figure 3) which are associated with Information Quality and System Quality. The results are summarized in Table 4. This model appears to also have a good fit, accounting for 18.2% of the variance in User Satisfaction. However, one variable, Development Effort, is not significant, which renders the entire model not significant. As explained in section 3.7, in these cases, a variant model was also estimated, removing the non-significant variable. The results are shown as Model #2b in Table 4.
This variant model also has an even better fit, accounting for 23.2% of the variance in User Satisfaction. All its independent variables are significant, which means their variance effectively predicts some of the variance in User Satisfaction. There is a +.150 increment of User Satisfaction for each unit increment in the Online Information
15ª Conferência da Associação Portuguesa de Sistemas de Informação (CAPSI 2015) 28
variable, Browser Access remaining the same. Conversely, the Browser Access variable has a negative influence on User Satisfaction, with each unit increment of the former leading to a change of -.101 in the later, et ceteris
paribus.
Model Dep. Variable Independent
variables
Standardized coefficients
Non-std.
Coefficients T Adj. R2 F-test Std. Error
#2 User satisfaction (d_SAT) Constant – 3.348 (se .043) 77.808 *** 18.2% F(3:47)= 4.405** .150 Online information (i_Online) .366 .150 (se .055) 2.178* * Browser access (i_BrowserB) -.294 -.098 (se .045) – 2.189* Development effort (i_TotY) -.128 -.004 (se .004) – .946~ #2b User satisfaction (d_SAT) Constant – 3.348 (se .043) 96.597 *** 23.2% F(2:57)= 9.474*** .146 Online information (i_Online) .381 .150 (se .046) 3.242* * Browser access (i_BrowserB) -.303 -.101 (se .039) – 2.574*
Correlation significance level: *** < 0.001, ** < 0.01, * < 0.05, + < 0.1, ~ = not significant se = standard error
Table 4 – Results of Model 2 – Influence of Information and System Quality variables in Satisfaction
Online Information is the variable with the strongest influence in User Satisfaction, with a change of one standard deviation in this variable resulting in a change of +.381 standard deviations in User Satisfaction, whereas Formal Training accounts for -.303 standard deviations.
A third and final model, Model #3, was developed to include variables in the conceptual model (cf. Figure
3) which belong to all main groups. Due to the previously mentioned limitation in the number of variables
that can be included in linear regression models like these, only the Application Age variable from the first group was used, since Model #1 had shown it to be the strongest influencer of user satisfaction. The results are summarized in Table 5.
15ª Conferência da Associação Portuguesa de Sistemas de Informação (CAPSI 2015) 29
Correlation significance level: *** < 0.001, ** < 0.01, * < 0.05, + < 0.1, ~ = not significant se = standard error
Table 5 – Results of Model 3 – Influence of P&O, IQ and SQ variables in Satisfaction
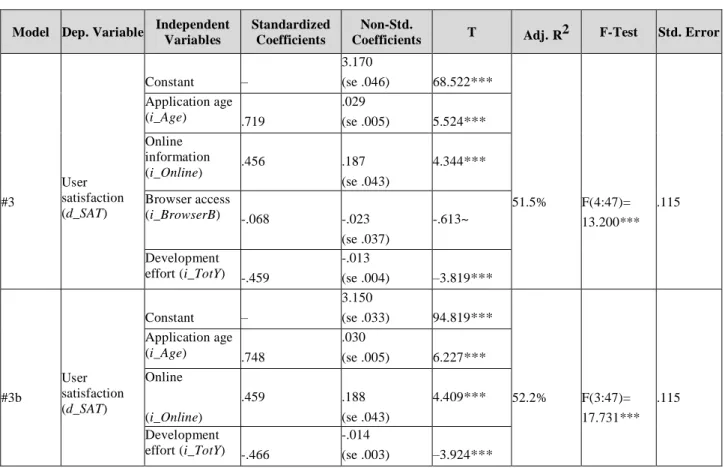
The model appears to have a good fit, with an Adjusted R2 showing that 51.5% of the variance in User Satisfaction can be accounted for by that of the dependent variables included in it. However, here too, one variable (Browser Access) is not significant, which renders the model itself not significant. Once more, a variant model was estimated, removing that variable. Its results are shown as Model #3b in Table 5.
This variant model also has a good fit, accounting for 52.2% of the variance in User Satisfaction. All its independent variables are significant (i.e. their variance effectively predicts more than half of the variance in User Satisfaction). In particular, there is a +.188 increment of User Satisfaction for each unit increment in the Online Information variable, Development Effort and Application Age remaining constant. Similarly, there is a +.030 increment of User Satisfaction for each additional year of Application Age, all other variables remaining constant. Finally, the independent variable Development Effort has a negative influence on User Satisfaction, which decreases by -.014 for each unit decrease of that independent variable, et ceteris paribus.
Application Age has the strongest influence in User Satisfaction, with a change of one standard deviation in this variable resulting in a change of +.748 standard deviations in User Satisfaction. The second strongest influencer of User Satisfaction in this model is Development Effort (-.466 standard deviations), followed closely by Online Information (.459 standard deviations).
Model Dep. Variable Independent
Variables
Standardized Coefficients
Non-Std.
Coefficients T Adj. R2 F-Test Std. Error
#3 User satisfaction (d_SAT) Constant – 3.170 (se .046) 68.522*** 51.5% F(4:47)= 13.200*** .115 Application age (i_Age) .719 .029 (se .005) 5.524*** Online information (i_Online) .456 .187 (se .043) 4.344*** Browser access (i_BrowserB) -.068 -.023 (se .037) -.613~ Development effort (i_TotY) -.459 -.013 (se .004) –3.819*** #3b User satisfaction (d_SAT) Constant – 3.150 (se .033) 94.819*** 52.2% F(3:47)= 17.731*** .115 Application age (i_Age) .748 .030 (se .005) 6.227*** Online (i_Online) .459 .188 (se .043) 4.409*** Development effort (i_TotY) -.466 -.014 (se .003) –3.924***
15ª Conferência da Associação Portuguesa de Sistemas de Informação (CAPSI 2015) 30
3.1.
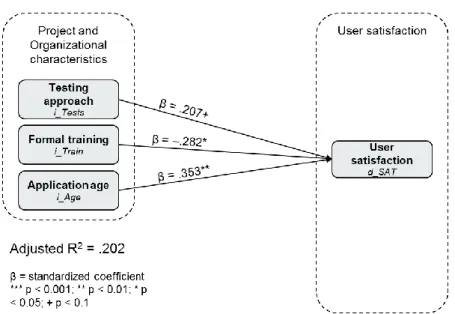
Summary of the resultsIn summary, as shown in Figure 4, Model #1, which deals with project and organizational characteristics, suggests that, all other things remaining equal:
The higher the age of the underlying systems, the higher the satisfaction that users derive from the system;
Similarly, the higher the involvement of end-users in acceptance testing, the higher the user satisfaction that is ultimately derived from the system once it goes into production; and
Conversely as requirements for formal, class-based training increase, user satisfaction decreases and vice-versa.
Figure 4 – Multiple linear regression findings for Model #1
As summarized in Figure 5, Model #2b, which looks at information and system quality, adds that, all else being equal:
The higher the online availability of information within the system, the higher the user satisfaction; and
On the other hand, the more access to the information system is achieved via a web browser instead of through specific client or terminal applications, the lower the user satisfaction.
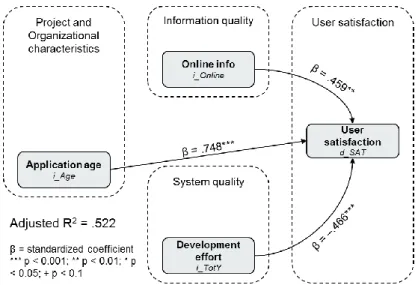
Finally, as illustrated in Figure 6, Model #3b, reinforces the above notions for application age and online information and adds that, et ceteris paribus:
15ª Conferência da Associação Portuguesa de Sistemas de Informação (CAPSI 2015) 31 The information systems with a higher total effort employed in their development and maintenance
tend to have lower user satisfaction
Figure 5 – Multiple linear regression findings for Model #2b
Figure 6 – Multiple linear regression findings for Model #3b
4.
DISCUSSION
This study aimed to deepen the understanding of the antecedents of user satisfaction with information systems, a proxy for IS success, particularly focusing on the characteristics of said information systems and their development processes that may have influence in user satisfaction. The previously presented results will now discussed in light of those objectives, grouped according to the organization of the theoretical and conceptual research models in Figure 1 and Figure 2.
15ª Conferência da Associação Portuguesa de Sistemas de Informação (CAPSI 2015) 32
4.1.
Project and organizational characteristics as antecedents of user satisfactionWithin the scope of this case study, the most relevant project/organizational characteristic that appears to be a strong predictor of user satisfaction is age (years since earliest underlying system of an application was introduced at the Bank). If there is a causal relationship between the two, it is likely to be in the sense that age influences satisfaction (since age, by its very nature, cannot be influenced by another variable), consistent with the findings of previous research related to the learning curve and the maturity effect in the life-cycle of most information systems [Sedera et al. 2004].
Another positive influencer of user satisfaction in this group is one of the aspects related to involvement of the users in the development of information systems, the testing approach. This corroborates the notion that the more end-users are involved at all stages of an information system’s development, the more likely is the success of that information system, measured by the user’s satisfaction, also consistent with prior research [Guimaraes et al. 1996].
The other aspect of end-user involvement, which deals with the enrollment of the users in formal, class- based training prior to usage of the system commences, has proven to be negatively correlated with user satisfaction. While one would intuitively expect more training to lead to higher user satisfaction [Guimaraes et al. 1996], there is also considerable support for the opposite in the relevant literature, mostly due to it the being contingent on factors like technical complexity and task inter-dependency [Sharma et al. 2007].
4.2.
Technology: information and system quality measures as antecedents of user satisfactionThe measure of Information Quality employed in this research, Online Information (provision by an information system of access to online, up-to-date information), has been shown by more than one of the regression models to positively influence user satisfaction. This relationship is in line with several previously published research results which have shown that information quality is a key antecedent of user satisfaction and IS success [DeLone et al. 2003; Gable et al. 2008; Gorla et al. 2010].
Conversely, both System Quality measures have proven to be negative predictors of user satisfaction in this case study, all other parameters being equal.
The first of those is the provision of a user interface via a web browser, which may lead to positing that the other user interfaces are preferred by users to the detriment of those designed to be accessed via a web browser. While interpreting these results, one has to bear in mind that the negative nature of this relationship is solely due to the arbitrary choice of coding of this characteristic of the information systems in a dummy variable. Had the choice been to code, not the characteristic of “Browser-based access” but rather the characteristic of “Dedicated-client access”, then the influence of the variable would have resulted in the opposite sign (i.e., positive).
15ª Conferência da Associação Portuguesa de Sistemas de Informação (CAPSI 2015) 33 Regarding the second measure, Development effort (total number of person-years employed in development and maintenance of the system), it may seem counter-intuitive that it is related to lower user satisfaction. Nevertheless, it may be that the causal relationship is in the inverse sense, i.e., that applications for which user satisfaction is low tend to have more development and maintenance work as an attempt to solve the issues that are leading to lower user satisfaction. Some anecdotal cases (e.g. New Local System) concur to this idea, since performance issues led to a significant effort overrun in an attempt to solve them.
4.3.
Implications for researchThe reported findings support the notion that user satisfaction in this case study is a proxy of Information Systems success, since it was shown to be significantly influenced by several variables which can be seen as its antecedents. This is consistent with previous research [Iivari 2005; Petter et al. 2008].
Among those antecedents, the maturity of the information system stands out as a relevant predictor of user satisfaction, as does the online nature of the information within it. These conclusions lead to the proposal of two hypotheses as suggestions for future research.
Hypothesis 1 (H1): The maturity of an information system positively influences its users’ satisfaction. Hypothesis 2 (H2): Users exhibit more satisfaction towards online updated information systems than towards those with batch-based update of information.
Conversely, support was found for the idea that training is not in itself a stand-alone measure for increasing user-satisfaction. This suggests that understanding of the moderators of training’s influence on IS success in the same or a similar scope as that of this case study would provide an interesting research path.
Finally, evidence was found that, at least in this case study, browser-based user interfaces are generally associated with lower user satisfaction. This could be a manifestation of the effect of some of the shortcomings of this kind of user interfaces (e.g. response times) which have been shown to decrease user satisfaction [Hoxmeier et al. 2000)], and which could perhaps be confirmed by further research.
4.4.
Implications for practiceThe most natural application of this study’s conclusions to the practice of Information Systems management is by the actual Bank which was studied, given that, even if the results cannot be generalized, they are, by their nature, fully applicable to the subject.
It is apparent from the conclusions that there may be a case to be made for decreasing the rate of introduction of new systems at the Bank, increasing the existing trend to have online information systems and dedicating more resources to the crafting of the applications in a way that less formal user training is required.
Further, the Bank could look to eliciting more detailed information on the nature of the effort employed in the development and maintenance of its information systems, since this may prove useful to understand the
15ª Conferência da Associação Portuguesa de Sistemas de Informação (CAPSI 2015) 34 direction of an eventual causal inverse relationship between person-years spent on an application and user satisfaction.
These conclusions may also apply to other similar organizations, since many of them are supportive of previous research and general practice, but naturally careful examination of the context would be required a priori.
4.5.
LimitationsThe use of the Bank’s user satisfaction surveys as a source for the user satisfaction data, even if a comprehensive and invaluable one, instead of an instrument that was purposely designed to support this research, has limited the ability to further explore other dimensions of the users’ perceptions in addition to their effective satisfaction with the Bank’s information systems.
In addition, the quantitative nature of the analysis techniques in the research design limited the ability to explore in-depth some subjects which require a more subjective approach or that cannot be structured to fit the dependent variable as operationalized here.
REFERENCES
Al-Maskari, A., and Sanderson, M. 2010. "A review of factors influencing user satisfaction in information retrieval," Journal of the American Society for Information Science and Technology (61:5), pp 859-868.
Bailey, J. E., and Pearson, S. W. 1983. "Development of a Tool for Measuring and Analyzing Computer User Satisfaction," Management Science (29:5) May, pp 530-545.
Bharadwaj, A. S. 2000. "A resource-based perspective on information technology capability and firm performance: an empirical investigation," MIS quarterly), pp 169-196.
Botelho, M. d. C., Calapez, T., and Ramos, M. 2011. "The effect of shape: comparing different presentations of response," Proc. 58th World Statistical Congress).
Carifio, J., and Perla, R. J. 2007. "Ten Common Misunderstandings, Misconceptions, Persistent Myths and Urban Legends about Likert Scales and Likert Response Formats and their Antidotes," Journal of Social Sciences (3:3), pp 106-116.
DeLone, W. H., and McLean, E. R. 1992. "Information Systems Success: The Quest for the Dependent Variable," Information Systems Research (3:1), pp 60-95.
DeLone, W. H., and McLean, E. R. 2003. "The DeLone and McLean Model of Information Systems Success: A Ten-Year Update," Journal of Management Information Systems (19:4), pp 9-30.
Doll, W. J., and Torkzadeh, G. 1988. "The Measurement of End-user Computing Satisfaction," MIS quarterly (12:2), pp 259-274.
Farrell, D., Mendonça, L., Nevens, M., Manyica, J., Lal, S., Roberts, R., and others 2002. "How IT Enables Productivity Growth - The US experience across three sectors in the 1990s," McKinsey Global Institute, San Francisco.
Gable, G. G., Sedera, D., and Chan, T. 2008. "Re-conceptualizing information system success: the IS- impact measurement model," Journal of the Association for Information Systems (9:7), pp 377-408. Gopalan, S., Jain, G., Kalani, G., and Tan, J. 2012. "Breakthrough IT banking," in McKinsey on Business
Technology, M. a. Company (ed.), McKinsey & Company: India.
Gorla, N., Somers, T. M., and Wong, B. 2010. "Organizational impact of system quality, information quality, and service quality," The Journal of Strategic Information Systems (19:3), pp 207-228. Guimaraes, T., Yoon, Y., and Clevenson, A. 1996. "Factors important to expert systems success a field
15ª Conferência da Associação Portuguesa de Sistemas de Informação (CAPSI 2015) 35 Göb, R., McCollin, C., and Ramalhoto, M. F. 2007. "Ordinal methodology in the analysis of Likert scales,"
Quality & Quantity (41:5), pp 601-626.
Hayes, B. E. 1998. Measuring Customer Satisfaction: Survey Design, Use, and Statistical Analysis Methods, (ASQ Quality Press.
Heidmann, M. 2010. "Overhauling banks' IT systems," in McKinsey Quarterly, McKinsey & Company: Frankfurt, Germany.
Hoxmeier, J. A., and DiCesare, C. Year. "System response time and user satisfaction: An experimental study of browser-based applications," Proceedings of the Association of Information Systems Americas Conference, Citeseer2000, pp. 10-13.
Iivari, J. 2005. "An empirical test of the DeLone-McLean model of information system success," SIGMIS Database (36:2), pp 8-27.
Laureano, R. M. S. 2011. Teste de hipóteses com o SPSS: O meu manual de consulta rápida, (Edições Sílabo: Lisbon, Portugal.
Lin, B.-W. 2007. "Information technology capability and value creation: Evidence from the US banking industry," Technology in Society (29:1) 1//, pp 93-106.
Melone, N. P. 1990. "A theoretical Assessment of the User-Satisfaction Construct in Information Systems Research," Management Science (36:1), pp 76-91.
Pandey, S., and Elliott, W. 2010. "Suppressor variables in social work research: Ways to identify in multiple regression models," Journal of the Society for Social Work and Research (1:1), pp 28-40.
Pestana, M. H., and Gageiro, J. N. 2008. Análise de dados para ciências sociais: a complementaridade do SPSS, (5th edition ed.) Edições Sílabo: Lisbon, Portugal.
Petter, S., DeLone, W., and McLean, E. 2008. "Measuring information systems success: models, dimensions, measures, and interrelationships," European Journal of Information Systems (17:3), pp 236-263. Petter, S., DeLone, W., and McLean, E. R. 2013. "Information Systems Success: The Quest for theIndependent
Variables," Journal of Management Information Systems (29:4), pp 7-62.
Sedera, D., and Gable, G. G. Year. "A factor and structural equation analysis of the enterprise systems success measurement model," Association for Information Systems2004.
Sedera, D., and Tan, F. Year. "User Satisfaction: An Overarching Measure of Enterprise System Success," Pacific Asia Conference on Information Systems, Association for Information Systems, Bangkok, Thailand, 2005, pp. 963-976.
Sharma, R., and Yetton, P. 2007. "The contingent effects of training, technical complexity, and task interdependence on successful information systems implementation," Mis Quarterly), pp 219-238. Stevens, J. 1996. Applied multivariate statistics for the social sciences, (Lawrence Erlbaum: Mahwah, New