Visual Efficiency Detection Index: A New Composite Measure of Visual Search C. Kovesdi, B. K. Barton & L. Rice
University of Idaho [email protected]
Abstract
Visual search is an important component of our interaction with our surroundings, allowing us to successfully identify external cues that impact our spatial navigation. Previous research has established fixation duration, fixation count, saccade velocity, and saccade amplitude as important indices of visual search. We examined the Visual Efficiency Detection Index (VEDI) comprising multiple aspects of visual search performance into a single measure of global visual performance. Forty participants, 10 adults ages 22-48, and children ages 6, 8, and 10, completed tests of working memory and visual search in response to stimuli relevant to pedestrian decision making. Results indicated VEDI statistically relates to established indices of visual search in relation to their interpretability for human performance. The VEDI was also sensitive to developmental differences in visual search performance, suggesting insight to its utility in the developmental psychological literature.
1.Introduction
Our visual sense provides us with a constant flow of information as we navigate throughout our daily lives. Much of our goal-directed behavior involves visual information, which we use as cues for accurate execution of spatial tasks (Land & Hayhoe, 2001). For example, we commonly use visual cues to compliment the various perceptual demands presented by tasks such as physical locomotion, wayfinding, and driving (Hosking, Lui, & Bayly, 2010; Karatekin, 2007; Lappe, Bremmer, & ven den Berg, 1999; McCarley et al., 2004). The degree to which we can efficiently search, detect, and use visual information also can affect our safety during such tasks.
Researching how we detect and process visual information based from some internal goal requires multiple measures of visual search. Four common indices used to understand visual search are saccade velocity, saccade amplitude, fixation duration, and
fixation count (Karatekin, 2007). Each of these indices are important, but must be
somewhat laboriously combined to yield a holistic understanding of visual search. Our goal was to examine the various information-processing trends in these four indices and then examine the utility of a composite measure, the Visual Efficiency Detection Index (VEDI), as a more readily interpretable global index of visual search. Before we define
the components of VEDI, we first must define other such visual search indices commonly used in visual search research.
Fixation duration is the temporal delay between each eye movement (Karatekin, 2007). Notably, fixation duration has been used as an indicator for cognitive processing ability where longer fixation durations have been suggested to be an indicator of greater information-processing. For instance, fixation durations increase when continuously reading, suggesting some cost of cognitive processing with a passage’s context in relation to the current text within foveal vision (McConkie, 1983). Drivers who are presented a secondary cognitive task concurrent to driving also have longer fixation durations when searching the traffic environment (Hosking, Lui, & Bayly, 2010; McCarley et al., 2004).
Fixation count is defined as the frequency of pauses between saccades. Fixation counts are dependent on the number of saccades present on a given task. The use of fixation count can vary by context regarding the nature of a given task. In time sensitive tasks such as change detection, smaller numbers of fixations needed to spot a difference would lead to greater visual search performance (McClarey, Vais, Pringle, Irwin, & Strayer, 2004). Measuring fixation count can also be useful when specifying particular areas of interest in a given scene where the number of fixations can be used to determine one’s allocation of visual selective attention (Underwood, Chapman, Brockehurst, Underwood, & Crundall, 2003).
Saccade velocity is the rate of spatial saccadic displacement within the environment over time. Greater velocities are an indication of more efficient visual information-processing ability (Karatekin, 2007). Research suggests that saccade velocity yields a negative relationship with one’s attentional allocation ability (Fischer & Weber, 1993; Spantekow, Krappmann, Everling, & Flohr, 1999).
Saccade amplitude is the extent of an eye movement, or distances between fixations through space. Saccade amplitude is typically measured in visual angles. Applied human factors research has used saccade amplitude to measure mental workload for a given task since the extent of amplitude is negatively correlated with increased mental workload and has been thought of as a measure of one’s attentional window (Karatekin, 2007). For instance, experienced drivers have shown to have greater horizontal variance within their visual search. Visual search variance has also shown to decrease as roadways become increasingly demanding (Chapman, Underwood, & Roberts, 2002; Crundall & Underwood, 1998). In another example, radar operators showed smaller saccade amplitudes when the number of targets sought exceeded 4 objects (Van Orden, Limbert, Makeig, & Jung, 2001).
Clear evidence of developmental differences in visual search exists (e.g. Barton, 2006; Tolmie, Thomson, Foot, McLaren, & Whelan, 1998; Whitebread & Neilson, 2000). Children are often not as capable as adults in seeking objects in their visual field. Middle childhood, in particular, appears to be a developmental period during which visual search skill undergoes a rather dramatic shift toward adult capability (Barton, 2006). Developmental research has found that visual search behavior becomes more systematic, more exhaustive, more strategically focused, and more rapid as children develop (Day, 1975). Specific components of visual search highlight this developmental trend. For example, goal-oriented saccadic velocity improves between ages 9 and 15 and continues to increase until age 25 (Klein, 2001).
The measures we described have previously been used separately to analyze the results of visual search in naturalistic environments. Although very accurate and statistically sound, inclusion of a composite measure may help form a more comprehensive model of naturalistic visual search and aid in interpretation. This may be particularly useful when assessing visual search aimed at detecting specific cues during goal-directed behavior. The VEDI score could be more interpretable since all of the information provided is integrated within a single output measure rather than multiple indicators. Our goal was to develop the VEDI to enhance interpretability of existing measures, rather than to replace measures we know are already useful.
The VEDI score provides many values over using measures such as reaction time and saccade amplitude alone. The score of reaction time provides merely action implementation data, which infers the assumption that visual search efficiency correlates with the efficiency of an action outcome. Saccade Amplitude provides data regarding eye movement behavior, inferring that the search behavior relates to information-processing ability per fixation. In comparison, the VEDI score combines the goal-driven action to the goal-driven visual search behavior in a systematic fashion that compares such performance on a defined environment.
Aims
Knowledge of visual processes can be enhanced by using multiple indices, which provides a more complete picture of visual search patterns (Shadish, Cook, & Campbell, 2002). The primary goal of this study was to examine the utility of the VEDI as a global performance index for visual search. The VEDI was examined in terms of statistical properties (i.e., distributional characteristics) and comparisons with other empirically grounded visual search measures. We expected a greater VEDI score to indicate more sophisticated visual search and correlate with other measures of visual search performance accordingly. VEDI scores were also expected to be sensitive to developmental differences in visual search efficiency. Specifically, we expected VEDI scores to show an increase in concordance with children’s development across middle childhood.
2.Method Sample
A sample of 10 adults ages 22-48 (M = 29; SD = 9.78), and children ages 6 (n = 10), 8 (n = 10), and 10 (n = 9), were recruited from the surrounding community. Our samples were chosen from specific age groups with known developmental differences in visual search based on other empirical research (Barton, 2006; Tolmie et al., 1999; Whitebread & Neilson, 2000). In particular, Barton (2006) highlighted the parallel between developmental changes in visual attention and corresponding pedestrian behaviors during middle childhood (i.e., ages 6-10). We selected children from three, non-overlapping age levels within middle childhood in order to capture developmental differences. The protocol was approved by the University’s Institutional Review Board. Measures and Procedure
First, participants completed the Snellen Index to obtain visual acuity binocularly. Participants were instructed to stand exactly 20 feet from the Snellen chart. Participants who were below 20/40 visual acuity were still allowed to participate, but were not recorded in data analysis.
Change-blindness task. Immediately following the visual acuity screening,
visual search performance was measured using the change blindness (CB) flicker paradigm using a computer (Rensink, 1997). All images yielded a display field of view (DFOV) of approximately 13.7 tall and 22 visual angle degrees wide. The CB task presented a static-framed traffic scene in perspective of being at a street corner. Image durations were 500ms for scenes followed by a 200ms mask. This cycle ended once the change was detected or if 30 seconds passed.
Participants were presented with 30 images captured in real pedestrian settings. Pedestrian-related images were used for two primary reasons. One, traffic scenes are complex naturalistic environments essential for purposes of using VEDI. And two, traffic scenes yield a wide exposure to different populations allowing for an intuitive search goal regardless of geographical location, experience, or age. Prior to beginning the CB task, participants were instructed that they would be looking for objects that would affect the safety of their decision to theoretically cross the street in the displayed scene.
There were three types of changes (one per image): traffic lights changing, walk signals changing, and vehicles changing position. Changes were equally weighted by location (left vs. right visual fields) and center versus peripheral to their central field of view (FOV). The images containing these changes were presented in 5 randomized blocks. Participants used the mouse to move the cursor to a suspected change and a left-click to indicate they found the change within a specific region of a scene. Each presentation of a street image and the participant’s response by mouse click constituted one trial upon successful change detection.
Change detection measures and oculometrics. The CB task provided reaction
time (RT) and false alarms (FA) for each trial. Reaction time was the time in seconds that elapsed from the onset of each trial to the time the participant indicated they had detected the change. False alarms were instances in which the participant indicated by mouse click that a change had occurred, when in fact no change was present in that area of the scene.
Eye movements were tracked using an Applied Science Laboratories (ASL) D6 desktop-mounted eye tracking system recording at 60 Hz. Several visual search indices were derived from the raw eye tracking data: fixation number, fixation duration, saccade amplitude, and saccade velocity. A fixation was defined by a set of criteria that eliminates extraneous gaze points caused from system jitter. The criteria used were implemented as the system default settings similar to prior research (Maltz & Shinar, 1999). The first criterion denoted that every 6 gaze points or eye data per sixtieth of a second were defined as one fixation if the gaze points were located within 1-degree of each other. From this, the second criterion denoted that any additional set of 6 gaze points must yield at least a 1-degree change from the previous 6 gaze points. The final criterion denoted that all gaze points outside of this 1-degree area were disregarded. Saccadic information was also obtainable through ASL’s gaze point algorithm. Saccade duration was obtained by the latencies between each defined fixation. Saccade amplitude was measured through ASL’s coordinate system, which assigns spatial coordinates across the entire monitor display. In addition, the ASL D6 remote optics utilizes a head tracker that integrates head distance from the monitor in addition to the coordinates on the monitor to derive saccade amplitude in visual angle.
Composition of VEDI. The VEDI contains three essential performance
parameters for weighting global visual search efficiency in a given goal-oriented visual search task that is undefined spatially within a two-dimensional plane. These parameters include average reaction time, average saccade amplitude, and horizontal radius of the
scene. Moreover, the emphasis of goal-oriented visual search is stressed since the
composition of these three parameters are modeled within the framework that there is a particular time-sensitive goal to be sought that is not spatially known. For instance, the change blindness research is usually undergone by displaying a change in a scene commonly using a flicker-paradigm (Rensink, O’Regan, & Clark, 1997). Here the participant is aware of the goal to search and detect a change (or target) within a scene that is spatially unknown once aware. Another example could be modeling search performance for a radar operator visually searching for targets in a display. In both cases, reaction time and visual search extent are two performance parameters weighted for efficient detection. The following section will elaborate on average reaction time, average saccade amplitude, and the horizontal radius of a visual plane regarding their conceptual roles in the VEDI composition.
Target detection from a scene is typically scored by the temporal latency from the start of a trial to successful detection. The reciprocal of reaction time was used to weight quicker reaction time as more efficient concurrently with visual search extent in the VEDI model. Quicker detection times infer greater efficiency for processing necessary information from a scene to adequately detect some change or visual target from a scene.
During goal-oriented search, saccades are used to allocate visual attention specific regions of space when processing detailed environmental information. During a visual search task that does not explicitly notify the viewer of a target’s specific spatial coordinates, greater saccade amplitude is advantageous since more visual space can be covered per saccade. And as mentioned, previous research has shown a relationship with saccadic amplitude and mental workload in a variety of domains (Chapman, Underwood, & Roberts, 2002; Crundall & Underwood, 1998; Karatekin, 2007; Van Orden, Limbert, Makeig, & Jung, 2001). However, using a raw saccade amplitude measure for a composite score lacks an essence of standardization if used to compare search performance across different scenes. Comparing saccadic amplitudes for two tasks with different environmental boundaries may yield very different indices of visual search performance. For example, judging search performance for a visual scene that is roughly twice the area of another visual scene but yields the same average saccadic amplitude may show qualitative differences of the scene that go unnoticed without standardizing a measure that takes into account these environmental differences.
A performance measure must then have some parameter of the physical environment to relate saccade performance in order to compare task performance. The VEDI score uses the radius of the horizontal plane to construct a concentric circle for a particular scene. Visual search performance is modeled by taking the difference of the scene’s circumference to the constructed circumference of a viewer’s average visual search extent by using the average saccade amplitude for a radius. Creating a circular region of space to compare visual search creates a more natural means for comparing visual search since the range of motion of the human eye is inherently bounded by its spherical shape. Whence, a scene’s horizontal plane is used since terrestrial visual search
patterns posit a horizontal bias to construct a circumference of the natural scene (Torralba, Oliva, Henderson, & Castelhano, 2006).
The advantage of using a standard such as the horizontal plane’s radius to weight search performance allows comparison of multiple viewers in a particular scene. A second advantage is that using a standard as such gives directionality to interpreting the results. If a viewer’s search extent exceeds the environmental circumference, then the viewer’s motives for search defied the goal of the search task. The VEDI result would yield a negative value denoting that one’s visual attention was allocated outside of the search task’s visual parameters.
The VEDI scale in this experiment was modeled with the formula: VEDI = {[(RTj + 1)-1/ (2πrT - 2πrj)] x 100}. The addition of 1 was included after RTj to account for the fidelity of the experimental software used. See appendix for a more in-depth theoretical discussion of VEDI. Here, rj is the average saccade amplitude and rT is the radius (11 degrees in our study) of the scene’s horizontal plane. The computation for 2πrT was a constant value of 69.12 degrees since all images were of equal area. The composition of a concentric circle was constructed for human visual search extent, as 2πrj, to model the average visual area needed before another fixation was required to process additional visual information. Finally, RTj was the grand mean detection time. Scores for VEDI range from 0 to 1 provided that RT is recorded in 1-second units. Higher scores indicated greater visual search efficiency. Higher scores were attributable from lower reaction times or greater saccade amplitude.
Analyses
Analyses proceeded in two steps. First, Pearson correlations were examined between all indices of visual search, between VEDI scores, and other indices of visual search within each age level. Second, age differences in all indices of visual search were examined in a MANOVA. All statistical analyses were conducted SPSS version 19.0. Time intervals of 200ms with missing data were denoted as eye blinks from our ASL eye tracking system and were not incorporated in oculometric data.
3. Results
Pearson correlations were examined between all indices of visual search, also specifically between VEDI scores, and other indices of visual search within each age range (Table 1A, 1B). All variables were related to the VEDI score at least at one level of age. False alarms were significantly and negatively related to VEDI in children. As visual search efficiency increased the number of false alarms decreased. VEDI scores were related to visual search indices such as larger saccade amplitude and saccade velocity. Saccade amplitude was significantly and negatively related to VEDI, for the six year olds. Saccade velocity and fixation duration were significantly positively skewed for the older populations, primarily ten year olds. Fixation count was negatively skewed and significant to VEDI for the younger populations, primarily six and eight year olds. Reaction time was significantly related to VEDI for all groups.
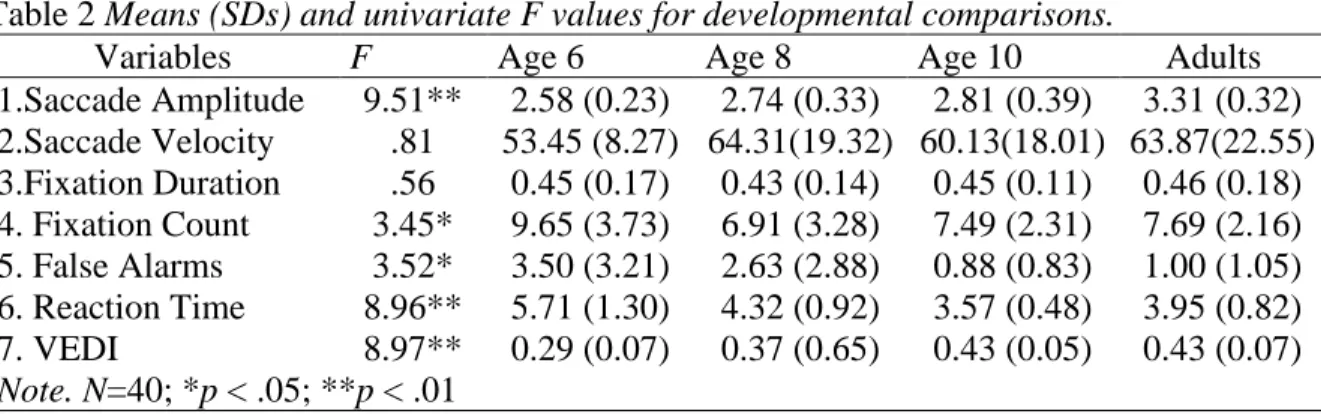
Age differences in each index of visual search were examined in a MANOVA. A significant multivariate main effect was found, F (7, 26) = 2.59, p < .01, Wilks’ Lambda = .21, partial η2 = .41. Significant univariate results were found for five of the seven indices of visual search (see Table 2). Tukey HSD post hoc tests revealed developmental
differences in saccade amplitude, fixation counts, false alarms, reaction times, and VEDI scores. Saccade amplitude for all children was significantly lower than those of adults. Six-year-olds’ fixation counts were significantly larger than those of 10-year-olds and adults. False alarms were significantly more frequent among 6-year-olds than adults, but did not differ significantly from other children. Reaction times were significantly longer for 6-year-olds than older children and adults. Finally, VEDI scores indicated significantly lower visual search efficiency for 6-year-olds than 10-year-olds and adults. Overall, the pattern of results indicates that the youngest children differed significantly from the oldest children and adults on many indices of visual search. Results also demonstrated sensitivity of the VEDI score to developmental differences in visual search.
Table 1A Pearson correlations between visual search indices,
Variables 2 3 4 5 6 7 1.Saccade Amplitude .17 -.04 -.20 -.21 -.25 .38 2.Saccade Velocity .32 -.16 -.25 -.36* .45** 3.Fixation Duration .07 -.05 -.06 .12 4. Fixation Count .58** .65** -.77** 5. False Alarms .62** -.61** 6. Reaction Time -.96** 7. VEDI Note. N=40; *p < .05; **p < .01
Table 1B Pearson correlations between VEDI scores across levels of age
Variables Age 6 Age 8 Age 10 Adult All
1.Saccade Amplitude .81** -.51 .35 -.08 .38* 2.Saccade Velocity .02 .07 .79** .63 .45* 3.Fixation Duration -.31 .29 .62** .52 .12 4. Fixation Count -.86** -.91** -.26 -.70* -.77** 5. False Alarms -.56** -.54 -.02 -.28 -.60** 6. Reaction Time -.97** -.97** -.91** -.98** -.96** 7. VEDI Note. N=40; *p < .05; **p < .01
Table 2 Means (SDs) and univariate F values for developmental comparisons.
Variables F Age 6 Age 8 Age 10 Adults
1.Saccade Amplitude 9.51** 2.58 (0.23) 2.74 (0.33) 2.81 (0.39) 3.31 (0.32) 2.Saccade Velocity .81 53.45 (8.27) 64.31(19.32) 60.13(18.01) 63.87(22.55) 3.Fixation Duration .56 0.45 (0.17) 0.43 (0.14) 0.45 (0.11) 0.46 (0.18) 4. Fixation Count 3.45* 9.65 (3.73) 6.91 (3.28) 7.49 (2.31) 7.69 (2.16) 5. False Alarms 3.52* 3.50 (3.21) 2.63 (2.88) 0.88 (0.83) 1.00 (1.05) 6. Reaction Time 8.96** 5.71 (1.30) 4.32 (0.92) 3.57 (0.48) 3.95 (0.82) 7. VEDI 8.97** 0.29 (0.07) 0.37 (0.65) 0.43 (0.05) 0.43 (0.07) Note. N=40; *p < .05; **p < .01 4.Discussion
Visual search skills are very important for many aspects of daily life. Several useful indices of visual search exist (e.g. Fischer & Weber, 1993; Spantekow, Karatekin, 2007; Krappmann, Everling, & Flohr, 1999), allowing scientists to gauge an individual’s search skills in relation to a given stimulus. Our goal was to develop and test a composite measure of visual search efficiency that will complement existing measures and aid in interpretation of visual search skills. The VEDI was significantly related to reaction time, false alarms, saccade velocity, saccade amplitude, fixation duration, and fixation count incorporating elements of these established measures into one composite measure usable for goal-oriented visual search.
The utilization of VEDI is designed to bridge multiple goal-oriented visual search measures together to allow for a holistic comparison of search performance. VEDI’s core value is its integration of perceptual information-processing characteristics with action implementation to assess performance. That is, VEDI was theoretically modeled to compare visual search performance within some designated environmental parameter defined by its search goal while simultaneously incorporating detection time for a specific target in a single value. Obtaining this global search index can allow researchers to compare performance from multiple performance indicators simultaneously to test the construct of visual search performance, which requires multiple indices.
We provide an example of how VEDI can be used. If a research experiment investigating change blindness only measured reaction time, only action implementation data is obtained. Hence, it still remains unknown if a participant detected the target from random chance based on one’s onset fixation over the target or if the detection time truly measured visual search performance.
If a research experiment measured only eye movements during a change blindness task, the oculometrics obtained may not truly reflect information processing of the target sought in the scene. In other words, a participant could theoretically search for a target and fail to consciously detect it but still show efficient search parameters from oculometric data. Although oculometric data can provide some form of temporal information based on the temporal intervals of its indices recorded, a participant must never the less consciously detect the target to be successful (e.g. Rensink, O’Regan, & Clark, 1997). A second concern with this example is that it assumes that the participant is always engaged in goal-oriented search. Such assumptions can lead to inaccurate interpretation if oculometrics do not reflect some weighting that accounts for the
boundaries set in a search environment. Saccade amplitude may be show efficient search characteristics; however, this measure does not account for search patterns that may have been outside of the scene’s boundaries defying the underlying search task goal.
Measuring action implementation with perceptual behaviors independently to measure visual search assumes that each measure is correlated with one another. Separate indicators fail to explicitly account for the task’s underlying search goal or take into account DFOV. For instance, measuring saccades across different search tasks with different DFOV will yield qualitatively different interpretations, yet go unaccounted for in the measure. The VEDI index accounts for DFOV, eye movements, and detection times with an underlying search goal into a single index providing a richer indication of search efficiency. Previously used visual search measures can then be used to systematically evaluate search performance guided by VEDI.
VEDI allows for a systematic evaluation of visual search; VEDI’s utility is not intended to replace other composite measures. For instance, Rantanen and Goldberg (1999) investigated the role of mental workload on one’s visual field. The computational measure used in Rantanen and Goldberg mathematically weighted the shape of one’s visual field to an ellipse. Rantanen and Goldberg’s measure compared the area and shape of one’s visual field to an assumed non-cognitively taxed visual field. This measure’s goal was to examine the underlying difference in area and shape of visual search when presented a cognitive task, dissimilar VEDI’s goal.
Worth noting, both the computational model used in Rantanen and Goldberg (1999) and VEDI use the same theoretical basis that greater saccade variance in the horizontal plane when under cognitive workload posits higher information-processing ability. As Rantanen and Goldberg’s measure aims to investigate the area and shapes of one’s visual field during cognitive interference, VEDI integrates perceptual behavior with action implementation performance to provide a holistic understanding of visual search.
Several limitations of our study should be mentioned. First, VEDI was modeled in a static environment with changes presented via flicker paradigm. Future research should consider implementing VEDI in a dynamic environment with a constant DFOV. A dynamic environment will present greater complexity and higher task demand, which may sharply define both individual and developmental differences in visual search efficiency.
A second limitation is that VEDI assumes that saccadic performance yields equal variance over time. As a result, the current VEDI model uses the mean saccade amplitude to derive the concentric circle. This assumption may be debatable if dynamic scenes are implemented and learning effects occur from exposure of a scene. For instance, visual search for novice drivers have shown to be qualitatively different from expert drivers (Underwood, Chapman, Brocklehurst, 2003; Underwood, 2007). As research illustrates that top-down processing influences the nature of saccade amplitude, a dynamic VEDI model must consider such learning effects and its influence in the model’s assumptions.
A third limitation that is that if search extent equals the environmental scene’s circumference, then VEDI will be undefined since the denominator of the model will equal zero. Such as case would be highly unlikely and could be easily detected by reviewing the raw scores for reaction time and saccade amplitude. In any case, VEDI’s
utility for comparing search to the environment’s boundaries provides standardization and directionality that can be used for evaluating search task performance.
A fourth limitation is sample size with each age group. Due to constraints imposed by the local population, data were collected from approximately ten individuals within each age group in our study. Developmental differences may very well be strong within the visual efficiency domain and thus easily captured with small samples, and future reports may establish an effect size of developmental differences. However, we must also mention that larger samples may guard against the possibility of finding results based on individual differences between participants as much as developmental differences between age groups.
Fifth, and perhaps a consideration for future research, additional screening measures might be used. For example, anxiety related to participation in an eye tracking study might alter children’s performance on complex tasks. Another issue might be cognitive and behavioral impairments. Children with attention deficit hyperactivity disorder, for example, may have good visual acuity but show significantly different performance from other children on eye tracking and cognitive tasks. Although our sample did not include any individuals with diagnosed cognitive or behavioral disorders, we feel these might be interesting factors to consider in future work on efficiency of visual search.
Finally, VEDI places an assumption that the horizontal plane is the primary axis of a planar display to weight search performance. Although VEDI uses a theoretical framework to derive this parameter, its utility is only valid for naturalistic scenes that incorporate a horizon. For instance, using VEDI for measuring search performance in a user interface (UI) display may require editing the environmental parameter to fit the experiment’s needs. This example is especially critical since the principle of standardization yields a strong foundation in UI design (Neilson & Molich, 1990; Norman, 1988). In either case, modeling the environmental parameter in VEDI can be interchangeable for experimental purposes.
The VEDI score provides many benefits to the field of visual search. VEDI is a composite measure incorporating four previous indices of visual search with a strong theoretical and practical basis. From our research we observe the benefits of this composite score and its validity as a potential new measure of visual search. The VEDI also provides windows for further research in different aspects of the field, which could prove to be very enhancing to the current knowledge of visual search.
One direction for future research is application of methods used in this study to examination of visual search efficiency in response to dynamic stimuli. For example, the use of video recordings at a street crossing and pedestrian interaction may produce more stable results of the VEDI score. This interaction would establish a ‘real-life’ situation in which the participant may feel more interaction between the tasks and responses, which would yield stronger more accurate results. Another direction is examination of visual search through VEDI scores with other populations. This experiment focused mainly on children and adults with decent vision and no visual or mental drawbacks. Using the VEDI to observe visual search differences among populations with Attention Deficit Hyperactive Disorder could provide interesting results in regards to normal vision patterns. Patients with traumatic brain injuries could also be an interesting population to study. Their visual search patterns, depending on injury severity, could be extremely
varied and could lead to further knowledge of severe brain injuries. Finally, the use of VEDI in usability evaluation investigating eye tracking across a navigational task could use VEDI to evaluate visual search performance across different UI layouts.
5.References
Barton, B.K. (2006). Integrating selective attention into developmental pedestrian safety research. Canadian Psychology, 47(3), 203-210.
Chapman, P., Underwood, G., Roberts, K. (2002). Visual search patterns in trained and untrained novice drivers. Transportation Research Part F, 5, 157-167.
Crundall, D.E., & Underwood, G. (1998). Effects of experience and processing demands on visual information acquisition in drivers. Ergonomics, 41(4), 448-458.
Day, M.C. (1975). Developmental trends in visual scanning. In H.W. Reese (Ed.),
Advances in child development and behavior (Vol. 10, pp. 153-193). New York:
Academic Press.
Eye TrackerSystem (Version 3.01) [Computer software]. Bedford, MA: Applied Science Laboratories.
Fischer, B., & Weber, H. (1993). Express saccades and visual attention. Behavioral and
Brain Sciences, 16, 553–610.
Hosking, S.G., Liu, C.C., & Bayly, M. (2010). The visual search patterns and hazard responses of experienced and inexperienced motorcycle riders. Accident Analysis
and Prevention, 42, 196-202.
Karatekin, C. (2007). Eye tracking studies of normative and atypical development.
Developmental Review, 27, 283-348.
Klein, C. (2001). Developmental functions for saccadic eye movement parameters derived from pro- and antisaccade tasks. Experimental Brain Research, 165, 1-17. Lappe, M., Bremmer, F., & van den Berg, A.V. (1999). Perception of self-motion from
optical flow. Trends in Cognitive Science, 3(9), 329-336.
Land, M.F., & Hayhoe, M. (2001). In what ways do eye movements contributes to everyday activities? Vision Research, 41(25-26), 3559-3665.
Maltz, M., & Shinar, D. (1999). Eye movements of younger and older drivers. Human
Factors, 41(1), 15-25.
McClarey, J.S., Vais, M.J., Pringle, H., Irwin, D.E., & Strayer, D.L. (2004). Conversation disrupts change detection in complex traffic scenes. Human Factors, 46(3), 424- McConkie, G.W. (1983). Eye movements and perception during reading. In K. Raynor
(Ed.), Eye movements in reading. New York: Academic Press.
Neilson, J., & Molich, R. (1990). Heuristic evaluation of user interfaces. CHI ‘90
Proceedings.
Norman, D.A. (1988). The design of everyday things. New York: Harper & Flow. Rantanen, E.M., & Goldberg, G.H. (1999). The effect of mental workload on the visual
field size and shape. Ergonomics, 42(6), 816-834.
Rensink, R.A., O’Regan, K.J., & Clark, J.J. (1997). To see or not to see: The need for attention to perceive changes in scenes. Psychological Science, 8, 368-373. Sadish, W.R., Cook, T.D., Campbell, D.T. (2002). Experimental and quasi-experimental
Spantekow, A., Krappmann, P., Everling, S., & Flohr, H. (1999). Event-related potentials and saccadic reaction times: Effects of fixation point offset or change.
Experimental Brain Research, 127, 291–297.
Tolmie, A.K., Thomson, J.A., Foot, H.C., McLaren, B., & Whelan, K.M. (1998).
Problems of attention and visual search in the context of child pedestrian behavior.
Road Safety Report No. 8. London: Department of the Environment, Transport & the Regions.
Torralba, A., Oliva, A., Castelhano, M., & Henderson, J.M. (2006). Contextual guidance of attention in natural scenes: The role of global features on object search.
Psychological Review, 113(4), 766-786.
Underwood, G., Chapman, P., Brockehurst, N., Underwood, J., & Crundall, D. (2003). Visual attention while driving: Sequences of eye fixations made by experienced and novice drivers. Ergonomics, 46(6), 629-646.
Underwood, G. (2007). Visual attention and the transition from novice to advanced driver. Ergonomics, 50(8), 1235-1249.
Van Orden, K.F., Limbert, W., Makeig, S., & Jung, T. (2001). Eye activity correlates of workload during a visuospatial memory task. Human Factors, 43(1), 111-121. Whitebread, D., & Neilson, K. (2000). The contribution of visual search strategies to the
development of pedestrian skill by 4-11 year-old children. British Journal of
Figure 1.
Schematic representation of the proposed CB task. Presentation A will be displayed for 500ms followed by a 200ms mask. Next, presentation A’ will be displayed for 500ms followed by another 200ms mask. The (A-Mask-A’-Mask-) sequence will continue until the participant detects the change between A and A’ or if 30 seconds pass.
Running head: VISUAL EFFICIENCY DETECTION INDEX
Appendix Visual Efficiency-Detection Index (VEDI)
o RTj = grand mean for reaction time.
An action (execution) response based on a specific spatially defined goal.
o T = the horizontal radius of an environmental plane.
Defines the environmental parameter that will compare visual search for the task.
o j = grand mean for saccade amplitude.
A search behavior (eye movement) based on seeking a defined event/ goal within the environment.
Rationale for T:
Comparing visual search behavior to a set constant explicitly provides a standard to compare performance within a two-dimensional plane.
Horizontal radius is used to define the plane, which allows for a more natural comparison of search.
o Humans exhibit a horizontal gaze bias.
o Without T, any increase in j would show greater visual search efficiency. o However, some searches may be defiant of the given goal’s environmental
parameters. Negative values (T – j) denote defiant visual search behavior.
VISUAL EFFICIENCY DETECTION INDEX
Given that that a defined goal is present, but its location is unknown within a defined set of coordinates, an increase in j shows greater visual search efficiency.
Limits to Changes in T and Comparing across VEDI: o T is a set constant used to weight search behavior.
A change in T will cause a change in weighting search behavior. o T1 = T2 = Tk → VEDI1 = VEDI2 = VEDIk
o T1 ≠ T2 ≠ Tk ┐ VEDI1 = VEDI2 = VEDIk
o T1 ≠ T2 ┐ VEDI1 = VEDI2
o T2 = T3 → VEDI2 = VEDI3
Construction of Search Efficiency Parameters:
o Provided that visual search for a spatially defined goal is an interaction undergone in a three-dimensional parameter set, j and T must be transformed to meet this criteria.
Therefore, j and T must be (X, Y) sensitive. Time must be accounted for.
o RT time to reach goal
o 2πr circular construction of visual search
Circumference is used rather than area since j is an average score. Hence, the information regarding where specifically within T is lost.
j can be thought of as an outline of one’s search behavior.
1 2 3
T
j
VISUAL EFFICIENCY DETECTION INDEX
Introduction of Time:
o Time-of-detection is the third dimension. [(X, Y): (Z)] o Quicker detection time is the preferred outcome. o A conceptual model of this relationship is as follows:
Mathematical Model of VEDI:
VEDI =
o The relationship between action (RT) and visual search behavior (j) posit higher VEDI scores when RT approaches 0 and j approaches similar values as T. Values to Using VEDI over Reaction Time and Saccade Amplitude:
a. Reaction time merely provides action data. One must only assume that visual search efficiency correlates with the efficiency of an action outcome.
b. Saccade Amplitude merely provides eye behavior data. One must only assume that the search behavior relates to a greater efficiency in obtaining the goal of efficient change detection.
c. VEDI combines the goal-driven action measure to the goal-driven visual search behavioral measure in a systematic fashion that compares search performance on a defined set of environmental parameters.
Inefficient VEDI Efficient VEDI
RTj 2πrT - 2πrj RTj 2πrT - 2πrj 2D Plane