Economics Department
Innovation and Economic Growth in Europe in the First Decade of the New
Millennium - Panel Data Analysis of the Lisbon Strategy’s Impact
Susana Diogo
A Dissertation presented in partial fulfillment of the Requirements for the Master’s Degree in Economics
Supervisor:
PhD, Sofia de Sousa Vale, Assistant Professor
Economics Department
Aos meus queridos pais pelo apoio ao longo de toda a vida. Ao meu irmão pela amizade. Ao Daniel pela compreensão e apoio incondicional.
I would like to offer my special thanks to my supervisor Professor Sofia de Sousa Vale, from ISCTE Lisbon University Institute, for all the inspiration and guidance in the dissertation.
Abstract
The objective of Lisbon Strategy was to make the European Union in the most competitive knowledge-based economy in the entire world, capable of ensuring sustainable economic growth with more and better jobs and greater social cohesion.
The strategy highlights the fundamental role of innovation policies so that objectives can be achieved. The reforms include making R&D a top priority, promoting the use of information and communication technologies (ICTs) and increase the investments in education.
What this work proposes is an analysis of the relationship between innovation and economic growth in the first decade of the XXI century using a panel of 14 European Union countries that signed the treaty. The main objective is to quantify the impact of the measures of the Lisbon Strategy in the field of innovation.
Estimations have been carried out using fixed-effects (FE) and Arellano-Bond GMM estimator. The findings suggest that innovation (through R&D, patents, and education) has a small effect in economic growth during the Lisbon Strategy. With FE, the R&D has a small effect in Gross Domestic Product per capita and with GMM the result is negative.
The problem may arise from the time lag between the investments in R&D and education and the emerging of innovation. The economic crisis also contributed to the decrease of investments in innovation and education.
Keywords: Economic Growth, Innovation, Lisbon Strategy, R&D
Resumo
O objetivo da Estratégia de Lisboa é tornar a União Europeia na mais competitiva economia baseada no conhecimento em todo o mundo, capaz de garantir um crescimento económico sustentável, com mais e melhores empregos e maior coesão social.
A estratégia destaca fundamentalmente o papel das políticas de inovação para que os objetivos possam ser atingidos. As reformas incluem fazer da I&D uma prioridade, promover o uso das Tecnologias de Informação e Comunicação (TIC’s) e aumentar os investimentos em educação.
O que este trabalho propõe é uma análise da relação entre inovação e crescimento económico na primeira década do século XXI através de um painel de 14 países da União Europeia que assinaram o tratado. O principal objetivo é quantificar o impacto das medidas da Estratégia de Lisboa em matéria de inovação. As estimativas foram realizadas usando o método de efeitos fixos (FE) e o estimador GMM de Arellano-Bond. Os resultados sugerem que a inovação (através de I&D, patentes e educação) tem um efeito pequeno no crescimento económico durante a Estratégia de Lisboa. Com FE, a I&D tem um pequeno impacto no Produto Interno Bruto per capita e com o GMM o resultado é negativo.
Este resultado poderá ser explicado pelo intervalo de tempo que existe entre os investimentos em I&D e educação e o surgir da inovação. A crise económica também contribuiu para a diminuição dos investimentos em inovação e educação.
Palavras-chave: Crescimento Económico, Inovação, Estratégia de Lisboa, I&D
i
Contents
Sumário Executivo ... iv
1. Introduction ... 1
2. Literature Review: Economic Growth and Innovation ... 3
2.1. Economic Growth ... 3
2.2. Innovation ... 4
2.3. Innovation as an Engine of Economic Growth ... 5
3. The Lisbon Strategy ... 9
3.1. Targets/Objectives in Innovation and Education ... 9
3.2. Lisbon Strategy Results ... 11
3.3. From the Lisbon Strategy to Europe 2020 ... 12
4. Empirical Analysis of the Lisbon Strategy Impact ... 13
4.1. The model ... 14
4.2. Data ... 15
4.3. Statistical Analysis of the Data ... 16
4.4. Empirical Analysis ... 19
4.4.1. Fixed Effects ... 19
4.4.2. Applying Arellano-Bond GMM Estimator ... 22
4.5. Discussion of Results ... 25
5. Concluding remarks ... 27
APPENDIX A: Variables ... 33
APPENDIX B: Summary Statistics ... 34
APPENDIX C: Regression Tables – Fixed Effects ... 38
ii
List of Abbreviations
EPO European Patent Office
EU European Union
FE Fixed – Effects
GDP pc Gross Domestic Product per Capita
GERD Gross Expenditures in Research and Development GMM Generalized Method of Moments
ICT’s Information and Communication Technologies
OECD Organisation for Economic Co-operation and Development R&D Research and Development
SHR Spending on Human Resources TEA Tertiary Educational Attainment TFP Total Factor Productivity
Text Tables
1. The 3 Targets in Europe 2020 --- 13 2. Rankings of countries by GDP, R&D Expenditure and Patents Applications, 2000-2010 --- 16 3. Rankings of countries by GDP, Tertiary educational attainment and Spending on Human Resources, 2000-2010 --- 18 4. Estimation results of the relationship between innovation and economic growth using Fixed Effects and Random Effects --- 20 5. Estimation results of the relationship between innovation and economic growth using Fixed Effects (one lag) --- 21 6. Estimation results of the relationship between innovation and economic growth using Arellano-Bond GMM estimator --- 24
iii
Appendix Tables
1. Definitions and Sources of Variables Used in Regression Analysis --- 33
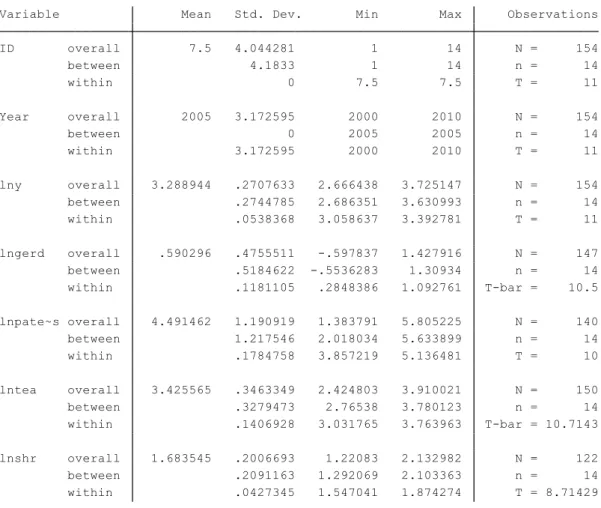
2. Summary Statistics of the Variables --- 34
3. Correlations Table --- 34
4. Fixed Effects Estimation --- 38
5. Random-Effects Estimation --- 38
6: Hausman Test --- 39
7: Fixed Effects Estimation (Lagged Values) --- 39
8. Heteroskedasticity Test --- 40
9. Fixed Effects Estimation (Robust Standard Errors) --- 40
10: Syntax used to obtain estimates of GMM in first difference --- 41
11: GMM Estimation --- 41
Appendix Figures 1. GDP pc --- 35
2. Expenditure on R&D (percentage of GDP) --- 35
3. Patents Application to the EPO --- 36
4. Tertiary Educational Attainment --- 36
iv
Sumário Executivo
O principal objetivo desta tese é examinar a relação que existe entre as políticas de inovação da Estratégia de Lisboa e o crescimento económico dos países que assinaram a estratégia no ano 2000. Para esse fim foram aplicadas várias técnicas econométricas por forma a calcular o efeito das medidas no Produto Interno Bruto (PIB) dos países.
Numa primeira abordagem considerámos as várias teorias económicas que relacionam a inovação e o crescimento, nomeadamente os modelos de crescimento endógeno e modelos empíricos que relacionam a tecnologia e a educação com o PIB per capita.
Posteriormente são apuradas as conclusões da própria União Europeia relativamente ao impacto que a estratégia teve e quais foram os principais problemas na implementação das medidas. Os objetivos não foram cumpridos, mas ainda assim, a EU considerou que a estratégia teve um efeito positivo no crescimento e na competitividade dos países. Por essa razão a estratégia foi renovada para o plano Europa 2020, mantendo os mesmos objetivos.
Neste trabalho para avaliar a relação entre as medidas e o PIB per capita é usado um painel de dados que é composto por 14 países da União Europeia, com dados entre 2000 e 2010. A variável dependente é o PIB per capita medido a preços de mercado e as variáveis explicativas são:
A despesa em percentagem do PIB em I&D
Os pedidos de patentes por mil habitantes
A percentagem de população entre os 30-34 anos com educação terciária
E a despesa em percentagem do PIB em recursos humanos.
O uso de um painel de dados traz inúmeras vantagens para uma análise como esta, nomeadamente porque permite controlar o efeito de variáveis não observadas e permite o uso de mais observações.
Os métodos mais utilizados pelos investigadores em dados de painel são os modelos estáticos de efeitos-fixos e efeitos aleatórios. O modelo de efeitos-fixos supõe que cada país tem as suas próprias características que permanecem constantes ao longo do tempo.
v
Por sua vez o modelo de efeitos-aleatórios pressupõe que essas mesmas características se alteram com o passar dos anos. Para comparar os dois modelos foi utilizado o teste de Hausman, que procura identificar se existe correlação entre os efeitos das variáveis omitidas e os regressores. Como existe essa correlação no painel de dados, o modelo interpretado foi o modelo estático de efeitos fixos.
Contudo, estes métodos nem sempre são os mais indicados para analisar painéis que contenham amostras com um maior número de entidades do que anos, que contenham variáveis dinâmicas ou que tenham variáveis independentes que não são estritamente exógenas.
Para ultrapassar os problemas foi apresentado um modelo de regressão alternativo, o método dos momentos generalizado diferenciado de Arellano-Bond. O modelo de regressão dinâmico proposto incluiu os desfasamentos das variáveis como instrumentos por forma a corrigir os problemas e obter estimações robustas. Sabemos que os instrumentos são adequados com o resultado do teste de Hansen. Na nossa estimação os estimadores foram considerados exógenos pelo que o modelo é válido.
Podemos concluir pelos dois modelos (efeitos- fixos e dinâmico) que não é possível demonstrar uma relação de causalidade entre a aplicação de medidas de inovação e o PIB per capita dos países. Ainda assim verifica-se a importância de algumas das variáveis, nomeadamente a percentagem de pessoas com uma educação superior, que obteve um impacto positivo e significativo em ambos os modelos. Estes resultados foram de encontro a algumas das teorias económicas apresentadas, nomeadamente as que destacam a importância da educação no crescimento económico.
1
1. Introduction
The main objective of this dissertation is to examine the relationship between economic growth and the role of innovation policies from the Lisbon Strategy. This work uses different panel data techniques and the data of 14 European countries from the period between 2000–2010 to investigate if innovation policies lead to increases in Gross Domestic Product per capita (GDP pc), this is, understand if the implementation of this policies produced any results in the economic performance of those countries.
Economic growth is a challenge for modern societies, given its importance in raising standards of living, particularly the GDP pc, which reflects the increase in household’s income. How to increase this growth is the central concern of economic policies. What is the formula for economic growth?
The theoretical and empirical studies are very different and suggest that there is indeed a significant contribution of innovation to economic growth in developed countries but it is difficult to measure this contribution.
First attempt to model this relationship was the neoclassical model of Solow (1956) which made the discussion of the effects of a technological shock in the economic growth of countries possible. But he did not clarify the source of this technological shock.
Later, the innovation began to be introduced in the models as an endogenous variable, often including R&D intensity as a source of technology and innovation.
The R&D may be a good measure of innovation input, but it does not reflect the economic performance that results from it. Often economic models add other variables like the number of patents applications, the number of innovative companies, or even human capital.
The need to innovate emerged from empirical work results and from the general understanding fact that countries that innovate have apparently better economic performances.
In March 2000 the European Union adopted the Lisbon Strategy whose purpose was to making the EU in the most competitive and dynamic knowledge-based economy in the world (European Commission, 2010b). The reforms included making R&D a top priority and promoting the use of information and communication technologies (ICTs). In order to achieve a “smart economic growth” a set of objectives had been established
2
in the field of innovation for the year 2010, such as the increase in public and private expenditures in R&D (to 3 % of GDP), introducing a cost-effective community patent, adapt skills base to the needs of the knowledge society, among others objectives.
In the end the Strategy did not have the expected results and was redesigned for the new plan "Europe 2020" but the aim of approaching 3% of GDP in public and private investment in Research & Development remained.
The purpose of this dissertation is to understand and analyze whether there is indeed some contribution of these objectives (referred to in the Lisbon Strategy as a "target" for innovation) to GDP pc growth of the EU countries that signed the Strategy. More precisely, this work tries to analyze econometrically which variables have more impact on the GDP pc growth of countries, in order to ascertain whether the objectives of the Strategy already have some contribution to their growth performance.
The findings suggest that the impact is not so strong. R&D and patents have a small impact on growth. This result may mean that the strategy does not have the expected contribution or that results are biased because of factors such as countries heterogeneity and the recent economic crisis. Furthermore the innovation activities may have a time lag between the investments (in R&D and education) and the happening of innovation.
The work is organized as follows. Section II discusses the most recent literature on economic growth and innovation. Section III presents the Lisbon Strategy and its objectives. Section IV features the model, the methodology, the data and the estimation results. Finally Section V presents the concluding remarks.
3
2. Literature Review: Economic Growth and Innovation
This section resumes the literature on economic growth and innovation. First discuss the concepts of growth and innovation and present the seminal literature on these subjects. Then we review the main growth models that incorporate education and innovation as growth factors.
2.1.Economic Growth
Economic growth is an essential macroeconomic question and as such it is the subject of attention of many economists. Since Adam Smith or David Ricardo that growth arises as a central problem that requires solutions (growth factors).
Economic growth is usually represented by the expansion of GDP of a country. According to Paul Krugman (2009) the best way to measure economic growth is sustained by real growth in Gross Domestic Product per capita (GDP pc).GDP pc is an important goal of economists because it is associated with the average growth, real incomes and living standards.
The recipe for growth can be varied but the paths of the richest countries seem to have common traits. In accordance with Samuelson and Nordhaus (2005) the main factors for economic progress are:
The availability of Human resources (labor supply, education, discipline, motivation)
The availability of Natural resources (land, minerals, fuels, environmental quality)
The amount of Capital formation (machines, factories, road )
The Technology (science, engineering, management, entrepreneurship).
The economic growth models differ from each other because they discuss about the relative importance of these different factors. For example, Adam Smith and TR Malthus stressed the role of land in growth; while the neoclassical models discuss the role of capital accumulation and technology.
4
The first model of economic growth to incorporate capital accumulation and technological progress was Robert Solow’s neoclassical model that offered a perspective of how the growth process could be described in developed countries.
The technological progress that relates to changes in the production process, to new products or new services, in other words corresponds to innovation, is important for the increase of countries’ living standards. For this reason economists began investigating the sources of technological progress that is, in other words, investigating the sources of economic growth.
In order to find the sources the neoclassical model applied by Solow was expanded in other directions, with the introduction of different production factors. Mankiw et al. (1992), for example, using an augmented Solow growth model with physical and human capital concluded that these variables explain the cross-countries differences in income per capita.
Others models were developed to highlight the importance of education on economic growth as is the case of Nelson and Phelps (1996) and more recently the empirical work of Barro (2001).
The education and population’s skills are a crucial factor in a knowledge based society where workers are needed for research activities and where they should have capacity to absorb these new technologies.
2.2.Innovation
Innovation is not a new phenomenon. Humans have always had a tendency to think about new and better ways of doing things and try to put them into practice (Fagerberg, 2004).
But what is really an innovation? According to Fagerberg (2004, p. 1), "An invention is the first occurrence of an idea for a new product or process, while innovation is the first attempt to carry it out into practice.” The lag between the two can last for several years.
For European Commission (2003) innovation “is the generation, assimilation and successful exploitation of novelty in the economic and social spheres”.
5
In the mid-90s, Europe was not thinking about innovation, but in science and technology. In theory it is common to associate research in science and technology as a narrow path to innovation.
However, to put an invention into practice it is usually necessary to combine different types of knowledge, skills, and abilities. The term innovation should be understood in a broader and more flexible sense including for example, the intellectual property rights, education and instruction, organizational changes and the institutional framework (Lundvall, et al., 2004).
Lundvall (1995) and Freeman (1995) emphasize the importance of a national innovation system, i.e., the network of institutions of public and private sectors which activities and interactions initiate, import, modify and diffuse new technologies. The intensification of globalization (through advances in information technology, communication and transport), the role of transnational corporations in developing research and development (R&D) puts a paradigm shift in innovation moving from a closed innovation to an open innovation system.
In European Union the need to address major global challenges make innovation more important than ever. The problems posed by climate change, energy, food security, health and aging require new and innovative solutions. Efforts were gathered in a joint strategy in order to achieve the desired targets.
2.3. Innovation as an Engine of Economic Growth
In the 1950s and 1960s, the first macro-economic models of growth have emerged, with particular attention to technological progress and human capital. Of all these models, the neoclassical Solow model with technological progress was the most influential of all.
Technology
First, Robert Solow (1956) treats technology as an exogenous variable to explain the sustained growth. In Solow (1957) the production function was decomposed to determine the different contributions of capital, labor and technology. Solow concluded that technological change (the residual) is responsible for the majority of economic
6
growth in the period 1909-1949 in the United States of America (87.5%). The residual, more formally referred to as total factor productivity (TFP), was labeled by Solow as technological change but it could include other factors such as “ slowdowns, speed ups, improvements in education of the labor force and all sort of things”. In conclusion the TFP may contain other elements that are not explained by capital and labor. Solow however does not explain what the leading source of technology is.
The new neoclassical model was the starting point for further empirical analysis of growth.
In later endogenous growth models, investment (particularly in innovation) drives the technological progress. According to these endogenous growth models, pioneered by Romer (1990) technological innovation is created in the R&D sectors using human capital and the existing knowledge stock. Several of these models (Romer, 1990; Grossman & Helpman, 1991; Aghion & Howitt, 1992) identify R&D (the proxy for technology) as a growth engine. Unlike Solow, where technology has a spontaneous generation (exogenous), in these new models to increase the technology it is necessary to mobilize economic resources.
In 1990, Romer emphasized that the growth rate is positively affected by research activities, but his model did not address the obsolescence of products. Aghion and Howitt (1992) created a model based on the creative destruction of Schumpeter (1942) arguing that growth results exclusively from technological progress which in turn results from the competition of innovative companies. Each new product is more efficient than the previous one, emphasizing the role of vertical innovation. More recently Jones and Williams (1998) argued that the optimal investment in R&D is four times greater than the current US investment.
Endogenous growth models that emphasized the role of R&D are based on the idea that innovation is driven by science, that is, it follows a linear model of innovation, where basic research (science and technology) leads to inventions that, by their turn, become innovations. The essence is that the greater the investment in R&D, the greater the ability to innovate and then, the greater economic growth.
These linear models are (in accordance with Pessoa, 2007), empirically supported by the positive correlation that normally exists between spending on R&D as a percentage of GDP (GERD) and the level of development measured by GDP pc. But according to Pessoa, this relationship is not so strong. Although there is, in his work, a positive relationship between the level of development and R&D intensity on OECD countries,
7
the correlation is far from perfect. There will be other factors affecting the level of the country’s development, such as be organization practice, education, among others.
The evolutionary growth theory is formulated due to the dissatisfaction with this point of view (that only the research activities are important), and is inspired in the ideas of Schumpeter. The influence of agents and other factors are considered important in this analysis, not only technology. The institutional, legal and economic environment determines the profitability of investments in innovation (Lundvall, et al., 2004). This interactive model, that has replaced the traditional linear model, sees economic growth as the result of the co evolution of technologies, firm and industry structures, and supporting and governing institutions.
In Europe the local socio-economic conditions (as the amount of knowledge) are important for the assimilation of innovation and its transformation into economic growth. “The potential of a region in terms of economic performance is maximized when an appropriate set of social conditions is combined with local investment in R&D.” (Rodríguez-Poze, et al., 2006).
Education
Some theoretical models and cross-country regressions point out the special role that human capital plays in innovation and the economic growth process (Romer, 1989; Mankiw et al., 1992; Aghion and Howitt, 1992). Human capital may be accumulated in two ways: through learning-by-doing and through formal education. In this work, we will focus attention in education (a target from innovation policy in Lisbon Strategy).
Some of the first studies that investigated the relationship between education and economic growth were led by Nelson and Phelps (1966), who wrote about the importance of the stock of human capital in the ability to absorb technology.
Human capabilities for learning new skills and applying them are the key to absorbing and using new technologies. According to Grossman and Helpman (1994) human capital are a measure of the size of the labor force. With a larger labor force, the economy could either undertake more R&D or more manufacturing.
For Barro (2002), the quantity of schooling is positively related to economic growth rate (an additional year of schooling have an impact of 0.44% in the growth rate) and this educational background would be complementary with new technologies and play an important role for the technological diffusion.
8
More recently some models estimated combined the effect of education and innovation on a country’s economic growth. Normally innovation and education are treated independently but as Nelson and Phelps pointed, education is an input of innovation.
Public spending on education seems to have an impact on the dynamics of innovation, being considered as an engine of growth together with innovation. According to Stadler (2006), who developed a dynamic general equilibrium model of education and innovation, the growth rate is driven by education of the households. Human capital resources devoted to education and R&D appear as engines of growth. So the subsidization of education could lead to faster growth rates of long-term equilibrium.
Other determinants for innovation
R&D and education were considered important for technological progress in endogenous growth theories but the determinants of innovation that are the heart of endogenous growth theories, need data on both the input (R&D) and the output of an innovative activity. More recent works that estimate the contribution of innovation to growth use not only R&D, but also other variables such as education, technology spillovers, institutional quality, patents, and trade liberalization, among others. Ulku (2004), for example, built a model with patents applications, apart from R&D, and the findings suggest that innovation (patents stock) had a positive effect on per capita outputs and competitiveness of both developed and developing countries. Madsen (2010) examined an extended version of conventional growth accounting with data on the OECD countries, and showed that output growth has been predominantly driven by TFP growth. Then he show that in turn the TFP is driven by R&D, knowledge spillovers through the channel of imports and educational attainment.
9
3. The Lisbon Strategy
The Lisbon Strategy was approved in the Lisbon European Council in March 2000, and established a new strategic goal for the European Union by 2010. The aim was to become the most competitive knowledge-based economy in the entire world, capable of ensuring sustainable economic growth with more and better jobs and greater social cohesion (European Comission, 2010b). The term “knowledge” means the inter-linkage of education (including training, qualification, skills) and innovation (including research, information and communication) (Moniz, 2011).
Policies best suited to this inter-linkage were established to prepare for this transition. The objectives are in line with their related areas: economic performance, employment, innovation and education, economic reform, social cohesion and environment. In this work, we will focus only innovation and education.
To do this transition would require a close cooperation between the EU and its members to achieve the desired results.
On the basis of the definition of this strategy was the realization that, to increase their standard of living standard and sustain its social model, it was necessary that the EU increased productivity and competitiveness to face global competition, the technological change and an aging population. Another important target for this strategy was “to support the European Economy in order to eliminate the gaps between Europe and USA” (Marinas, 2010, p. 59).
3.1.Targets/Objectives in Innovation and Education
The economic growth and productivity gains are highly dependent on the technological progress and on the improvement in the quality of labor and capital inputs. A key objective of the Lisbon Strategy has been to speed up the transition towards a knowledge-driven economy, in which education and training, research and innovation contribute efficiently to growth.
According to Ivan-Ungureanu & Marcub (2006) the Lisbon approach implies to accomplish several objectives divided for the following main areas: research, information society and education and training.
10
Research:
Increasing the R&D spending (private and public) to 3% of GDP by 2010. The proportion financed by business should rise to two thirds of that total.
National networking and joint research programs on a voluntary basis around freely chosen objectives and developing an open method of coordination of the national research policies.
Improving the environment for private research investment, R&D partnerships and high-technology start-ups.
Harnessing new and frontier technologies, notably biotechnology and environmental technologies.
Introducing a cost-effective Community patent.
Removing the obstacles against the mobility of researchers, attracting and retaining of high-quality research talent in Europe.
Rolling-out of a world research communications infrastructure. Information Society:
100% of the schools have to be connected to the internet by 2002.
All teachers must have training in digital skills by 2003.
Ensure access to widespread, world-class communications infrastructure and ensure significant reduction in the cost of using the Internet
Create conditions for e-commerce to flourish.
Prevent info-exclusion.
Stimulate e-Government
Support take up of 3G mobile communications and introduction of Internet Protocol version 6
Launch the Galileo Programme Education and training
Achieve a substantial increase in per capita spending on human resources
Promoting life-long learning
Adapt skills base to the needs of the knowledge society (at least 40% of 30-34– year-olds completing third level education).
11 Promote learning of European Union languages and introduce a European
dimension to education and training.
Promote school twinning via the Internet
Acquiring new skills and knowledge are important to adapt the labor force to new technologies, but it is not enough. In Europe it is necessary to improve the capacity for innovating, using the complex networks of innovation. For that reason, the strategy contains measures to improve access to information, to create a European Area of Research and Innovation and to train and educate citizens to live and work in the knowledge society.
Additionally the European Union had hoped to reach with these measures the objective of an average growth rhythm of 3 percent during the decade started in 2000.
3.2.Lisbon Strategy Results
“The initial strategy was gradually transformed into a too much complex structure, with multiple objectives and actions and with an unclear division of responsibilities and different tasks, especially between the EU and the national levels” (European Commission, 2010b). These are the conclusions of the renewal of the strategy in 2005.
The Lisbon Strategy was re-launched with the initiative “Working together for growth and jobs” and defined the top priority areas that include; investment in R&D, investment in people and a new governance structure based on a partnership approach between Member States and EU institutions.
This mid-term review also revealed a new set of dynamics needs to be taken into account in the last years. It is the case of the uncertain economic prospects in Europe and the world and the entry of new countries in 2004 that increased diversity in performance and cohesion (Jones, 2005).
Overall, according to the document of evaluation accomplished by the European Commission (2010b) the Lisbon strategy had a positive effect for the EU, although its main objectives (achieving an employment rate of 70% and allocation of 3% of GDP on R&D) were not achieved in 2010. During the analyzed period the total R&D expenditure (% of GDP) only improved marginally (from 1.82% in 2000 to 1.9% in 2008).
12
The growth rhythm of GDP was also lower than expected, 18 percents lower than the target settled by the Lisbon Strategy. So these key reforms should be better targeted and prioritized.
The results were also affected by the strong economic crisis that had a profound and lasting effect in Europe’s economies and deeply effects in R&D and education investments. Liquidity pressure, difficulties in finding appropriate financing, credit constraint, falls in sales and available cash-flows, and difficulties facing shorter term payments are just some of the factors which can lead some private firms to decrease their investments in R&D.
Although the results were not the expected some studies and reports about the importance and utility of the Lisbon Agenda still reinforce the positive impact it had on European economy. Guerrieri et al (2005), in their model suggest that economic growth is positively affected by technology accumulation and diffusion, and business services play a fundamental role in the process. “The output growth can be significantly increased if the availability of business services and the accumulation of knowledge are enhanced”. The European Commission, (2005) says that “In advanced economies such as the EU, knowledge, meaning R&D, innovation and education, are a key driver of productivity growth. Knowledge is a critical factor with which Europe can ensure competitiveness in a global world”.
For this reason the European Union continued to focus on the same measures.
3.3. From the Lisbon Strategy to Europe 2020
By 2010 the project was redesigned for the plan "Europe 2020"; the targets decreased in number but the essence remained. The aim of approaching 3% of GDP in Research & Development stands, although in the last 10 years it has fluctuated around 1.85% in Europe (Leon and Nica, 2011) and the economic crisis does not stimulate public and private investment in the area.
The Europe 2020 is based on the experience obtained with the previous results of the Lisbon Strategy, keeping its strengths and trying to correct its deficiencies (lack of coordination policies and marked differences between EU countries in terms of pace and scope of the reforms).
13
The new plan also reflects changes in the EU since 2000, especially the urgent need to recover from the economic crisis and pursues the goal of achieving a “smart growth”. It means “strengthening knowledge and innovation as drivers of our future growth. This requires improving the quality of our education, strengthening our research performance, promoting innovation and knowledge transfer throughout the Union, making full use of information and communication technologies and ensuring that innovative ideas can be turned into new products and services that create growth, quality jobs and help address European and global societal challenges” (European Comission, 2010a)
So continues to be important for the European Union the inter-linkage of innovation and education.
Table 2: The 3 Targets in Europe 2020
R&D 3% of the EU's GDP to be invested in R&D
Education
Reducing school drop-out rates below 10% At least 40% of 30-34–year-olds completing third level education
The question is: It is worthwhile to continue the focus on the same objectives?
Leon and Nica (2011) stated that “this new strategy for 2020 will not be fulfilled if the member states will develop themselves after the same pattern”. Concrete action plans are necessary for each Member State and therefore better coordination and political ownership. But so far it is not clear when the strategy will contributed to higher levels of innovation, higher education and qualification levels of labor force (Moniz, 2011) .
4. Empirical Analysis of the Lisbon Strategy Impact
In assessing the ten years of the Lisbon Strategy, what counts ultimately is its impact on growth. However, evaluating this impact is not an easy task, given that economic cycles, external events and as well as countries own policies had a crucial role in the effects of Lisbon Strategy.
14
The Lisbon strategy was not applied in isolation. The Union had 15 Member States in 2000 and today has 27. Similarly, the euro became a currency of global significance, the number of countries in the euro area increased from 12 in 1999 to 16 countries today and the European Union plunged into an economic crisis in 2007.
The European Commission points to a positive result although the goal has not been achieved and renewed the strategy for a new plan, the “Europe 2020”.
The principal objective of this dissertation is to understand if during the 10 years of the Lisbon Strategy, innovation, (i.e. the combination of inputs (R&D) outputs (patents), educational attainment and the spending on human resources and in the information society) econometrically had any impact on GDP pc that is, the variable that measure the growth of this 14 countries.
4.1.The model
The empirical model that motivates the research of the link between innovation variables and economic growth is the following panel framework of 14 countries for 11 years (2000-2010):
(1) In equation (1) above is the gross domestic product at 2005 market prices per head of population and is its lagged value. is a set of regressors including gross domestic expenditure on R&D (GERD), patent applications to the European Patent Office (Patents) and also two variables representing education being the total public expenditure on education as a percentage of GDP (SHR) and tertiary educational attainment (TEA). All variables are expressed in natural logarithms.
The panel data applications utilize a one-way error component model for the disturbances, with
(2)
In equation (2) the denotes the unobservable individual specific effect and denotes the remainder disturbance.
15
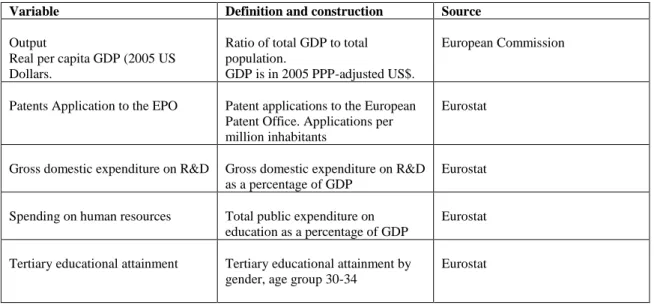
4.2.Data
The empirical model was estimated for the period 2000-2010, including EU-14 members which signed the strategy in 2000 (Austria, Belgium, Denmark, Germany, Greece, Ireland, Italy, France, Finland, Netherlands, Portugal, Spain, Sweden and United Kingdom). Luxembourg is excluded due to lack of data. The panel is “strongly balanced” which refers to the fact that all countries have data for all years.
Data was mainly obtained from the Eurostat Science Technology and Innovation database (Table 1, in Appendix A).
(a) The R&D expenditure is the main measure of the economic input allocated to generate innovation and the principal target for the Lisbon Strategy and also “Europe2020”. The spending on R&D may be in research or development (design, testing, product or process prototypes and pilot plants). However, the variable has some measurement problems associated. The time lag for the effect of R&D activities on growth may vary significantly across countries and the returns from public and private R&D as well (Rodríguez-Pose & Crescenzi, 2006).
(b) Patent data includes all utility patent applications in European Patent Office per million inhabitants. Patents, since they represent ideas themselves, are the closest to direct indicators of knowledge formation. The Patents provide a link between innovation, inventions and the marketplace. A count of patents is one measure of a country’s inventive activity and also shows its capacity to exploit knowledge and translate it into potential economic gains.
(c) The education attainment (the percentage of population in 30-34 that having completed higher education) is used as a measure of the accumulation of skills and the capacity for absorbing knowledge. The target for this measure is 40%.
(d) The spending on human resources is used as a measure of investment in human capital and on ICT’s (through investments in technology and training in schools). The increase on this indicator is a priority for countries in strategy.
16
The model is aimed at understanding the role of different innovation factors proposed by the European Council in the EU-14 after 2000. As presented the model combines inputs (R&D expenditure), outputs (patents) in the innovation process and education factors.
4.3.Statistical Analysis of the Data
This section examines the statistical properties of the data and some stylized facts about the relationships among GDP, R&D expenditure, patent applications and education (tertiary educational attainment and spending on human resources).
Table 2 displays the rankings of the countries in terms of their average levels of GDP, R&D and patent applications. As seen from the table, the highest levels of GDP per capita are in Denmark and Ireland while Greece and Portugal are in the lowest rank.
Table 2: Rankings of countries by GDP, R&D Expenditure and Patents Applications, 2000-20101
Rank GDP R&D Expenditure Patents
1 Denmark 37,77 Sweden 3,71 Germany 280,04
2 Ireland 37,62 Finland 3,51 Sweden 269,10
3 Sweden 32,27 Denmark 2,59 Finland 251,70
4 Netherlands 31,83 Germany 2,57 Netherlands 217,85
5 Austria 29,97 Austria 2,39 Denmark 203,10
6 Finland 29,73 France 2,15 Austria 185,57
7
United
Kingdom 28,95 Belgium 1,94 Belgium 135,04
8 Belgium 28,79 United Kingdom 1,79 France 128,59
9 Germany 27,73 Netherlands 1,78 United Kingdom 92,26
10 France 27,13 Ireland 1,32 Italy 79,53
11 Italy 24,34 Spain 1,15 Ireland 65,17
12 Spain 20,63 Italy 1,14 Spain 27,57
13 Greece 16,99 Portugal 1,06 Portugal 8,46
14 Portugal 14,68 Greece 0,58 Greece 8,36
Sources: GDP (European Commission), R&D and Patents (Eurostat)
1
GDP are in 2005 U.S. dollars, R&D is as percentage of GDP and Patents are in per million people. All series are averaged over 2000–2010.
17
In addition, Austria, Denmark, Finland, Sweden have all higher levels of GDP, R&D Expenditure and Patent applications, which suggests a positive correlation among those variables. On the other hand Portugal, Greece and Spain rank the lowest levels of GDP per capita, R&D expenditure and patents.This also suggests a correlation between the variables. Countries with lower GDP values also have lower levels of R&D and patens.
The exception is Ireland, presenting one of the highest levels of GDP per capita, but also the lowest values for R&D and Patents.
Table 3 in Appendix represents the correlations between the variables, and shows that there exists a positive and higher correlation between GDP pc and expenditure on R&D and between GDP pc and patents.
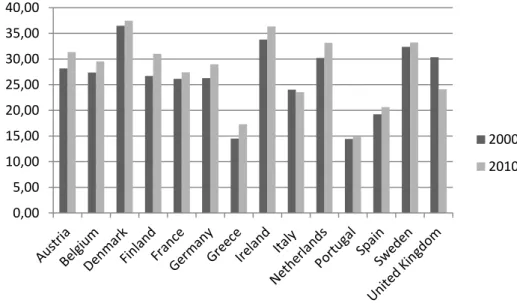
We have to point out that all countries have increased since 2000 their GDP pc as showed in the figure 1 on Appendix B with the exception of United Kingdom, but the growth rhythm was 18 percents lower that the objective settled (3% on average during the decade) (Marinas, 2010). In what concerns the R&D expenditure as a percentage of GDP, all countries improved their conditions during this period. Finland in 2000, had already reached the target of 3% but at the end of 2010 only Sweden and Denmark had reached also the goal (table 2 in Appendix 2).
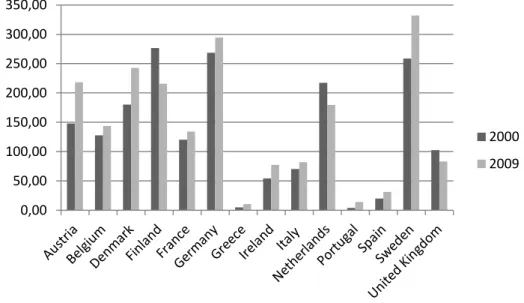
With the exception of the years 2000 to 2002, the number of patent applications filed to the European Patent Office (EPO) increased until 2010. Among the EU Member States, Germany and Sweden had by far the highest number of patent applications to the EPO in 2009. Between 2003 and 2010 the number of patent applications filed to the EPO increased in all Member States except in Finland, the Netherlands and United Kingdom where small decreases were recorded (Figure 3 in Appendix).
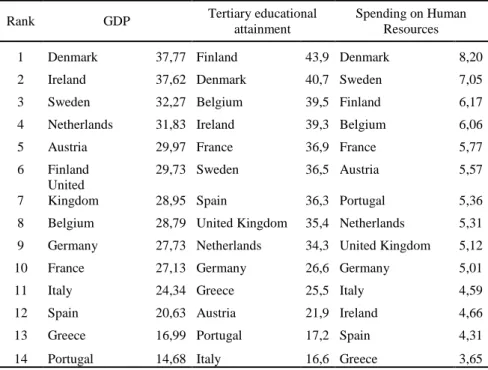
In turn table 3 documents the rankings of the countries in terms of their average levels of tertiary educational attainment and spending on human resources.
When it comes to educational variables we see that the northern countries such as Denmark, Finland and Sweden present the highest ranks in GDP pc and also in education variables.
But the relationship between GDP pc and the variables of education does not seem to follow the same parameters of the previous explanatory variables (R&D and patents). There are countries with low levels of GDP and a good performance in the education variables and contrary results.
Concerning tertiary educational attainment Denmark, Finland, Ireland and Sweden are examples of countries with higher ranks and higher values of GDP pc. In the
18
lowest rank concerning Tertiary Educational Attainment we have Portugal and Italy that present as well low values of GDP pc. There is a possibility of correlation.
Table 3: Rankings of countries by GDP, Tertiary educational attainment and Spending on Human Resources, 2000-20102
Rank GDP Tertiary educational
attainment
Spending on Human Resources
1 Denmark 37,77 Finland 43,9 Denmark 8,20
2 Ireland 37,62 Denmark 40,7 Sweden 7,05
3 Sweden 32,27 Belgium 39,5 Finland 6,17
4 Netherlands 31,83 Ireland 39,3 Belgium 6,06
5 Austria 29,97 France 36,9 France 5,77
6 Finland 29,73 Sweden 36,5 Austria 5,57
7
United
Kingdom 28,95 Spain 36,3 Portugal 5,36
8 Belgium 28,79 United Kingdom 35,4 Netherlands 5,31
9 Germany 27,73 Netherlands 34,3 United Kingdom 5,12
10 France 27,13 Germany 26,6 Germany 5,01
11 Italy 24,34 Greece 25,5 Italy 4,59
12 Spain 20,63 Austria 21,9 Ireland 4,66
13 Greece 16,99 Portugal 17,2 Spain 4,31
14 Portugal 14,68 Italy 16,6 Greece 3,65
Sources: GDP (European Comission), Tertiary educationl attainment and Spending on Human Resources (Eurostat)
The results are different when it comes to Spending on Human Resources (SHR) as a percentage of GDP. We find countries that are simultaneously among those with the higher levels of GDP and with the lowest ranks in terms of SHR, is the case of Ireland (third position in GDP and twelfth in SHR) and we find the opposite case the case, as Portugal (last place in GDP and seven in SHR).
Based on the data between 2000 and 2010, the TEA improved in all countries (see figure 4 in appendix) although some countries have reduced the spending in human resources, like Austria, France, Portugal and Sweden (figure 5).
In terms of targets we have seen in figure 4, that in 2010 only 5 countries (Austria, Germany, Greece, Italy, and Portugal) did not surpassed the target of 40% of population among 30-34 age groups with higher education.
2 GDP are in 2005 U.S. dollars, TEA is a percentage and SHR are as percentage of GDP. All series are
19
4.4.Empirical Analysis
In this section we estimate the impact of our set of variables in GDP pc using a panel data of 14 countries. These estimations of the Lisbon Strategy’s impact have been carried out using fixed-effects (FE) and Arellano-Bond Dynamic Panel GMM estimators (Arellano and Bond, 1991; Roodman, 2006).
The fixed-effects regression analysis, also known as least squares dummy variables (LSDV), accounts for country fixed effects and yields consistent estimators of the coefficients, provided that there is no endogeneity problem and the lagged dependent variable is not included in the analysis (Baltagi, 2011).
The GMM analysis accounts for country fixed effects and yields consistent estimators in the presence of lagged dependent variables. In addition, by including instrumented lagged dependent variable in the analysis, to some extent, GMM accounts for endogeneity problems (Ulku, 2004).
4.4.1. Fixed Effects
The static fixed effects model explores the relationship between a predictor and explanatory variables within an entity (in this case the country.). Each country has its own individual characteristics that may or may not influence the variables and are invariant with time. Those time-invariant characteristics should not be correlated with other individual characteristics.
However, fixed effects may not be the most efficient model to run. A random effects model, for example, give us better P-values and should be run if it is statistically justified. The difference between the two models is that, unlike the fixed effects model, in the RE model the variation across entities is assumed to be random and uncorrelated with the predictor or independent variables included in the model (Wooldridge, 2008, p. 251).
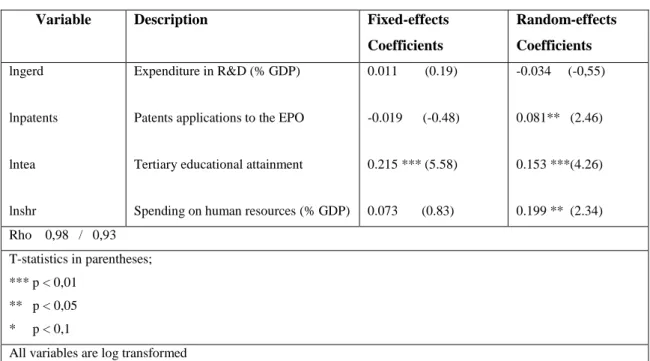
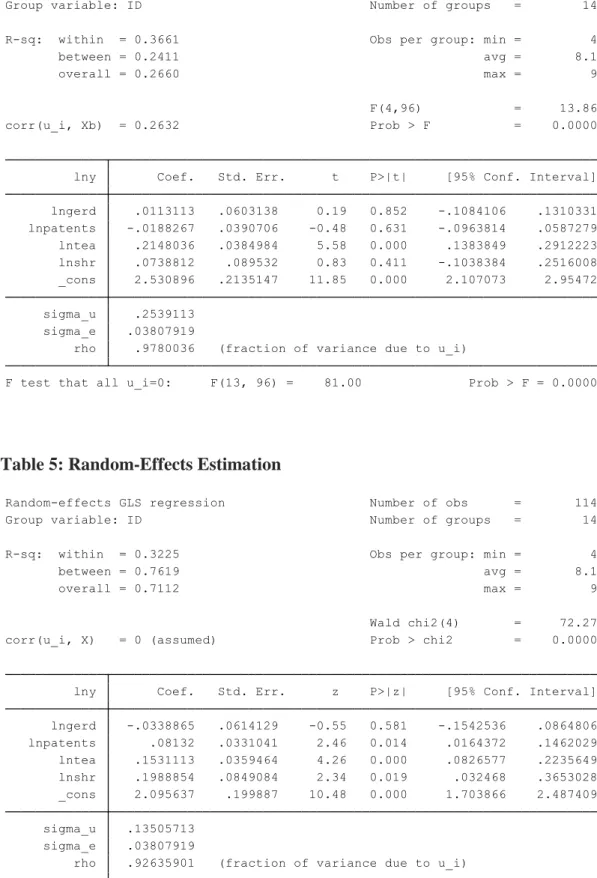
The estimations results on fixed-effects and random-effects models are in table 4 and 5 in Appendix C, and are summarized below in Table 4. The results of FE model confirm the expected relationship between the Gross Domestic Product on the one hand, and expenditure in R&D and education variables, on the other. The variables
20
representing the innovation have the expected signs with exception to the Patents applications. 3
For contrary, the RE results present a negative impact of R&D expenditures in GDP pc and a positive one for patents applications. Instead, the education variables have an identical result with positive and significantly impact.
Table 4: Estimation results of the relationship between innovation and economic growth using Fixed Effects and Random Effects
Variable Description Fixed-effects
Coefficients Random-effects Coefficients lngerd lnpatents lntea lnshr Expenditure in R&D (% GDP)
Patents applications to the EPO
Tertiary educational attainment
Spending on human resources (% GDP)
0.011 (0.19) -0.019 (-0.48) 0.215 *** (5.58) 0.073 (0.83) -0.034 (-0,55) 0.081** (2.46) 0.153 ***(4.26) 0.199 ** (2.34) Rho 0,98 / 0,93 T-statistics in parentheses; *** p < 0,01 ** p < 0,05 * p < 0,1
All variables are log transformed
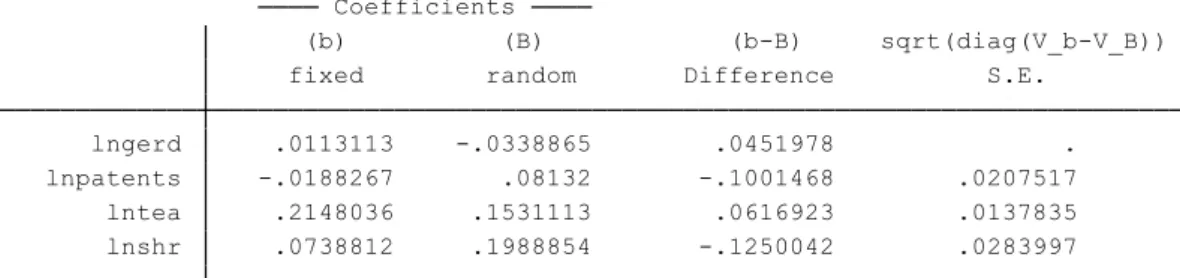
To decide between fixed or random effects, we use the Hausman Test that compares the two models. The null hypothesis is that the individual specific effects are not correlated with the regressors (Baltagi, 2011). If they are (significant P-value lower than 0.05) then it is safe to use fixed effects. If we get an insignificant P-value, however, we should use random effects.
Comparing the coefficient of fixed-effects model with the random-effects model using the Hausman specification test, the conclusion is that it rejects the random effects in favor of the fixed effects estimates at p-value = 0.00 (see table 6 in Appendix C).
Thus, reading the FE results we find that R&D expenditure has a positive but not statistically significant effect on GDP per capita of EU member countries as a group.
3
21
Accordingly, we find that a 1 percent increase in the R&D expenditure would result in a 0.011 percent increase in the average GDP per capita. Similarly, a 1 percent increase in investment in human resources will increase GDP per capita by 0.073 percent and in higher education an impact of 0.215. This last result is consistent with the findings of Barro (2002) that point out the importance of the effect of school quality.
On the other hand, the patent applications have a negative impact on GDP per capita in EU 14 countries.
Unlike the statistical results that seemed to indicate a greater correlation between GDP, R&D and patents applications, when estimate the model, it appears that the education variables will have a greater impact on per capita GDP of the European countries then the others explanatory variables.
The lowest elasticities in the variables that proxy innovation may be related to the time lag for the effect of R&D activities on growth. It takes time to perform research and patenting the results.
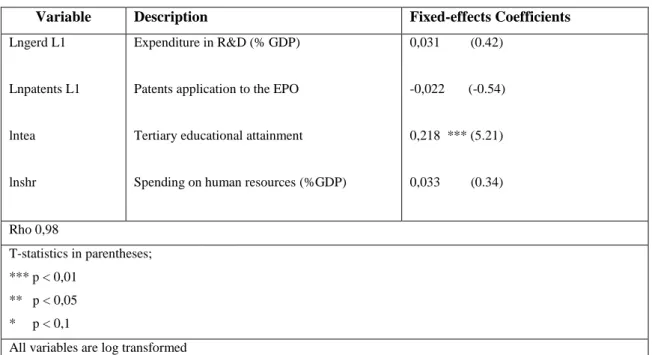
Table 5: Estimation results of the relationship between innovation and economic growth using Fixed Effects (one lag)
Variable Description Fixed-effects Coefficients
Lngerd L1
Lnpatents L1
lntea
lnshr
Expenditure in R&D (% GDP)
Patents application to the EPO
Tertiary educational attainment
Spending on human resources (%GDP)
0,031 (0.42) -0,022 (-0.54) 0,218 *** (5.21) 0,033 (0.34) Rho 0,98 T-statistics in parentheses; *** p < 0,01 ** p < 0,05 * p < 0,1
All variables are log transformed
For experience, when estimating the same model with 1 lag for expenditure on R&D and patents, the elasticities for R&D and Patents rise (table 5). Which suggest that may be one of the causes (see also table 7 in appendix C).
22
Lastly, the standard error component model given by equations (1) and (2) assumes that the regression disturbances are homoskedastic with the same variance across time and individuals (Baltagi, 2011). When heteroskedasticity is present the model will still result in consistent estimates of the regression coefficients, but these estimates will be biased and one should compute robust standard errors for correcting the possible presence of heteroskedasticity.
In order to verify this we perform the modified Wald test for groupwise heteroskedasticity. The null hypothesis of homoskedastic was rejected (with a p-value of 0.00) and it was concluded heteroskedasticity, so the estimator is biased. Table 9 attached in appendix reports the results with robust standard errors that correct the estimator. However, the results remain unchanged.
4.4.2. Applying Arellano-Bond GMM Estimator
The dynamic panel estimators are designed for situations with 1) “small T (time), large N (countries)panels”; 2) a linear function relationship; 3) a single left-hand-side variable that is dynamic; 4) independent variables that are not strictly exogenous, meaning correlated with the past; 5) fixed individual effects; and 6) heteroskedasticity and autocorrelation within individuals (Roodman, 2006).
We use the Arellano-Bond GMM estimator because the panel dataset has a short time (11 years) and a larger country dimension (14). In equation (1) the set of regressors are assumed to be endogenous, because causality may run in both directions. Innovation may influence the GDP pc, but also the performance of GDP may influence the amount of innovation created in the country, because it depends of the economic resources. The time-invariant country characteristics (fixed effects) may be correlated with the explanatory variables and the presence of the lagged dependent variable gives rise to autocorrelation. For these reasons it is advisable to use the dynamic panel estimator.
The generalized method of moments (GMM) methodology that we use, allows us to control country-specific effects and joint endogeneity in a dynamic model of panel data. Other common approach is to use an instrumental variable (IV) estimator. The instrumental variable, z, needs to be correlated with the endogenous variable x, and uncorrelated with the error term. Finding a valid and strong instrument is often very hard.
23
By choosing to employ the difference estimator GMM developed by Arellano and Bond (1991) those problems are addressed more effectively and robust estimates are obtained. In this method, lagged values of the explanatory variables are used as instruments and an over identification test is applied to ensure that there is no bias due to correlation with the error term.
There are two variants of GMM estimators in dynamic panel, the GMM estimator in first difference and the GMM in system. The first conceived initially by Arellano and Bond (1991) consists in taking for each equation the first differences of the equation to be estimated in order to eliminate the specific effects of countries, and then use the values in a lagged level as instruments of these variables at the level of the equation in first difference. The GMM in first differences is more appropriate to a dataset with a small number of countries.
Applying the first-difference transformation:
(4)
This estimation in first-difference does have a weakness. According to Roodman, (2006) it magnifies gaps in unbalanced panels. Since in some variables there are some missing data, when, for example, is missing, then both and are missing in the transformed data. To minimize data loss that are used “orthogonal deviations” (Arellano and Bover, 1995). In this context instead of subtracting the previous observation (as we do in first-difference), is subtracts the average of all future available observations of a variable.
In this estimation, the real GDP is treated as predetermined (has a lag), while the variables GERD and SHR are treated as endogenous (because causality may run in both directions) and the patents and the tertiary educational attainment are classified as strictly exogenous (table 10 in appendix D) in accordance with Mileva, (2007).
The results (table 11, appendix D) display the Hansen J Statistic with a p-value of 0,879 which accept the null hypothesis that “the instruments as a group are exogenous”.
24
Table 6: Estimation results of the relationship between innovation and economic growth using Arellano-Bond GMM estimator
Explanatory variables Description Coefficients t-statistics
lny L1 lngerd lnpatents lntea lnshr Lagged GDP Expenditure on R&D (% GDP)
Patents application to the EPO
Tertiary educational attainment
Spending on human resources (%GDP)
0,831 *** -0.117 0,028 0.044 -0,132** (6.33) (-1.19) (0.63) (1,06) (-1.16) Hansen J Statistic : 0.879 Number of countries : 14 Number of observations: 90 T-statistics in parentheses; *** p > 0,01 ** p > 0,05 * p > 0,1
All variables are log transformed
As the output table above shows we find different results for the explanatory variables elasticities when compared to the results obtained using the FE estimators.
The GMM results indicate that R&D and the expenditure on human resources has a negative effect on GDP per capita, while patents contribute to an increase in GDP pc by 0.028. However this last result is not statistically significant.
With GMM estimator, that concerns endogeneity, the tertiary educational attainment is the only education variable with a positive result. It presents an elasticity of 0.044 that is similar to the FE results
In summary, the variables that we assume endogenous are those with the negative impact on GDP pc.
25
4.5. Discussion of Results
The Lisbon strategy has emerged with the purpose of making the European countries most competitive and with greater economic growth. In this sense a set of measures in the area of research and education were applied.
As we have seen in the literature review there are many the authors that support the idea that there is a higher correlation between the investments in R&D and Economic Growth (Aghion & Howitt, 1992; Grossman & Helpman, 1991; Solow, 1957) and between education and Economic Growth (Barro, 2002; Mankiw et al., 1992). Therefore, we found different patterns of these relationships.
In section 4.1 we have seen the statistical properties of R&D, patents applications, tertiary educational attainment and spending on human resources. Comparing the average GDP, with average values of R&D and patents, we see that countries with higher incomes are the countries with the highest investment in R&D and the highest number of patent applications per million inhabitants. Likewise the countries with the lowest average GDP pc are the countries with the lowest R&D and the lowest number of patent applications per million inhabitants. A positive impact between these variables and GDP pc were expected.
In these 10 years, the countries increased their GDP pc but with a lower growth rhythm. The other variables (R&D, patents) also increased, particularly in countries that already had higher incomes. The measures appear to work for countries that need less.
In the case of tertiary education and spending on human resources, that relationship seems not so linear. As was shown there are countries with lower incomes, but with higher investments in percentage of GDP in education. It was expected a less impact of these explanatory variables in GDP pc.
The estimation in Section 4.3 postulated two hypotheses: (1) that there is heterogeneity in the panel; and, (2) there is endogeneity in different variables of innovation;
To test the first hypothesis we have used the FE estimator and we watch that there was a positive impact of R&D on the economic growth (0.011%) but this result is not statistically significant. This small effect of R&D may be related to the fact that Europe during this period had a poor economic growth and plunged into an economic crisis (although the percentage of GDP devoted to R&D in all countries has increased) and the time lag already mentioned.
26
The patents had a negative result so the country’s inventive activity does not seem to affect GDP pc.
The results depicted the existence of two variables that simultaneously have a positive impact on GDP pc: TEA (0.215 %) and SHR (0,074 %). The education variables, namely the educational attainment has a significant impact on growth, which is in accordance with Barro (2002) that states that an additional year of schooling raises the growth rate by 0,44 % . Then if the quantity of schooling has an impact on GDP pc, it is natural that the percentage of people with higher education also has. The SHR also has a positive impact, then investing in human resources and in ICT’s are important for economic growth.
Using the GMM estimator to test our second hypothesis the result was less strong: the patents applications have a positive impact of 0.028% and the tertiary educational attainment of 0.044%. The educational attainment continues to have a major impact but this time the R&D activities have a negative impact on GDP pc.
This result may be weaker, for several reasons. First, as well as in FE results it is possible that these results on R&D and patents suffer from the existence of a time lag between the implementation of R&D and the emergence of innovation (as estimated with a lag indicates). Secondly, Europe during this period experienced several transformations (enlargement to 24 countries, the introduction of the euro) and suffers in 2007, as already noted, one of the biggest crisis that caused a decrease in investments and in liquidity of countries.
But maybe might also like to say that in European Countries in these 10 years, the strategy had not the pretended impact due to several problems already described. For example, the structure’s complexity, the lack of coordination policies, marked differences between EU countries (in terms of pace and scope of the reforms) as well as economic crisis.
Finally and in accordance with Marinas (2010) the estimations may also reflect the failure in achieving the settled targets. The reason was the heterogeneity between the north and south countries (the differences in the institutional, legal and economic environment may determine the profitability of investments in innovation) and the time lag for the effect of R&D activities on growth varies significantly across countries.
In general the results with FE are in accordance with the authors that emphasized the role of R&D and education for technological progress. With GMM this relation is not so precisely.
27
5. Concluding remarks
The purpose of this dissertation was to explore the impact of the implementation of the Lisbon Strategy on the economic growth of the European countries that signed this treaty.
The treaty consists in an implementation of a set of variables that are considered important for the “knowledge society”. It is the case of innovation variables (R&D and patents) and education.
The knowledge-based economy is characterized by the need for continuous learning of codified information and the competences to use this information given that neither patent nor R&D data capture the full range of innovation and R&D activities.
Therefore the European knowledge society also includes an increased investment on education and vocational training, not only in research, science and technology. Education and training have a vital role to play in providing people with competences and qualifications which respond to labor market requirements.
The effect of R&D activities and education already has been tested over the years in various models. What empirical studies reveal is varied but the principal authors, who some already mentioned, indicate a great importance of R&D on technological progress and thus economic growth.
Education is also an important component of innovation. The authors point to this fact and the reports of the European Union are also clear in highlighting this approach. That knowledge accumulated through investment in R&D, innovation, education and lifelong learning, is a key driver of long-run growth.
The methodology of this study was based on a panel data of 14 countries that signed the strategy in 2000, and it intended to investigate if Innovation and Education lead to increases in Gross Domestic Product per capita (GDP pc).
From what it is reflected in the statistical analysis, seem to have a correlation between higher incomes and the investments in R&D and patents. These countries with higher incomes already reach the target of 3 % of GDP in R&D (Denmark, Finland and Sweden). The R&D expenditure seems to perform better in countries with more income, i.e., it results only in countries that are already developed. Marinas, (2010) states that Lisbon Strategy can be considered relevant for the economic growth of the already developed countries, while for the others the growth has been the result of other factors.