Diogo Alves Figueiredo
Licenciado em Ciências de Engenharia e Gestão Industrial
Applying the User-Centered Design
approach for Prototyping the Interfaces
of an Intelligent Emergency
Management System
Dissertação para obtenção do Grau de Mestre em Engenharia e Gestão Industrial
Orientador: Professora Doutora Isabel Maria do
Nascimento Lopes Nunes, Professora Associada com
Agregação, Faculdade de Ciências e Tecnologia da
Universidade Nova de Lisboa
Co-orientador: Contra-Almirante Doutor Mário José
Simões Marques, Comandante, Escola Naval, Instituto
Universitário Militar
Júri:
Presidente: Prof. Doutora Maria Celeste Rodrigues Jacinto Arguente: Prof. Doutora Teresa Romão
Vogal: Prof. Doutora Isabel Maria do Nascimento Lopes Nunes Março 2019
iii
Universidade Nova de Lisboa Faculdade de Ciências e Tecnologia
Applying the User-Centered Design approach for Prototyping the Interfaces of an Intelligent Emergency Management System
Diogo Alves Figueiredo
Licenciado em Ciências da Engenharia e Gestão Industrial
Dissertação para obtenção do Grau de Mestre em Engenharia e Gestão Industrial
Orientadora: Professora Doutora Isabel Lopes Nunes,
Professora Associada com Agregação, Faculdade de Ciências e Tecnologia da Universidade Nova de Lisboa
Co-orientador: Contra-Almirante Doutor Mário José Simões
Marques, Comandante, Escola Naval – Instituto Universitário Militar
v
Applying the User-Centered Design approach for Prototyping the Interfaces of an Intelligent Emergency Management System
Copyright © Diogo Alves Figueiredo, FCT/UNL e UNL
A Faculdade de Ciências e Tecnologia e a Universidade Nova de Lisboa têm o direito, perpétuo e sem limitações geográficos, de arquivar e publicar esta dissertação através de exemplares impressos reproduzidos em papel ou de forma digital, ou por qualquer outro meio conhecido ou que venha a ser inventado, e de a divulgar através de repositórios científicos e de admitir a sua cópia e distribuição com objetivos educacionais ou de investigação, não comerciais, desde que seja dado crédito ao autor e editor.
vii
Acknowledgements
Firstly, I would like to thank the Portuguese Navy and the Ministry of Defense, for
providing students such as myself the opportunity to be part of once in a lifetime
projects of a greater scope.
I must thank the naval cadets that volunteered, the Naval Academy and CITAN for
providing all the support for this study’s tests; and also, Pedro Mendonça that shared the
technology and know-how that allowed this study to go one step further.
I would also like to thank all the Commanders at Naval Staff’s Plans Division
(DIVPLAN) that integrated me into their workspace and whose amazing spirit made me
feel very welcomed throughout my internship.
I must also thank both my supervisors Professor Doctor Isabel Lopes Nunes and Rear
admiral Doctor Simões-Marques for their availability, guidance, support, wisdom and
strength that helped me push through this lengthy process, and without whom this
dissertation wouldn’t be at all possible.
To my “brothers” António, Mário and Rodrigo for all the good times we lived and will
continue to live.
And lastly to my parents, for giving me all the chances to succeed and unwavering
support. For enduring my lows and keeping me grounded in my highs, never letting me
forget where I come from. I love you.
ix
“The most worth-while thing is to try to
put happiness into the lives of others.”
xi
Abstract
In today’s disaster management context, decision-making and information management is a crucial aspect, given the complexity of the tasks the decision-maker has, as well as the sheer influx of information coming in at any given time. As such there is a need to develop a system that can aid both the decision makers in the command post but can also collect the information gathered by the responders on the field. This system should also aid the decision maker by providing counselling according a set of rules, giving the system an intelligent aspect. Thusly THEMIS is born, an intelligent system to support decision making in crisis scenarios.
As any given system must have an interface, the usability and user experience are a concern, but given the nature of crisis scenarios, this aspect of user interfaces becomes much more critical. It is in this context that this dissertation’s goal becomes clear: design and test the interface prototype of an emergency management intelligent system, following the User-Centered Design framework.
With this goal in mind, the steps of the framework were followed, by beginning to understand the user, the context of use, resulting in understanding the user’s needs. From here, the system requirements emerged, and paper prototyping began. After validation with experts and possible users, the interfaces were prototyped digitally for both the desktop and mobile system applications. This was followed by usability tests, using the Cognitive Walkthrough method, the System Usability Score and the User Experience Questionnaire. In order to complement the testing phase, eye tracking data was gathered during the desktop version’s usability tests, which gave further insight about user behaviour.
As such, it was concluded that prototypes scored highly both for usability and user experience, and there was an overall improvement on the various versions of both the desktop and mobile apps. The tests with eye tracking also allowed to identify a few issues that otherwise couldn’t be detected, namely key items the users were missing on the interfaces.
Keywords: User-Centered Design; Cognitive Walkthrough; THEMIS; Disaster Management;
xiii
Resumo
No contexto de gestão de emergências atual, a tomada de decisão e a gestão da informação são aspetos cruciais, dado a complexidade das tarefas que o decisor tem, bem como a quantidade de informação que chega a qualquer altura. Assim, há uma necessidade de desenvolver um sistema que possa assistir tanto os decisores no posto de comando, mas também possa recolher a informação dada pelos operacionais no terreno. Este sistema deve também ajudar o decisor providenciando aconselhamento de acordo com um determinado conjunto de regras, dando ao sistema uma vertente inteligente. Assim nasce o THEMIS, um sistema inteligente de apoio à decisão para cenários de crise.
A interação com este sistema é feita através das suas interfaces, cuja usabilidade e experiência do utilizador são uma preocupação, dada a natureza dos cenários de crise, pelo que a conceção das interfaces é um processo muito crítico.
É neste contexto que o objetivo desta dissertação se torna claro: desenhar e testar um protótipo de interface de um sistema inteligente de apoio à decisão para gestão de emergências, seguindo o framework User-Centered Design, para aplicações desktop e móvel.
Com este objetivo em mente, os passos deste framework foram seguidos, começando por entender o utilizador, o contexto de utilização, resultando num entendimento das necessidades do utilizador. Daqui, emergiram os requisitos do sistema, que guiaram a prototipagem em papel. Após validação com especialistas e possíveis utilizadores, as interfaces foram prototipadas digitalmente para ambas as aplicações desktop e móvel. Isto foi seguido por testes de usabilidade, utilizando a metodologia Cognitive Walkthrough, o System Usability Score e o User Experience Questionnaire. Para complementar a fase de testes, foram recolhidos dados recorrendo ao eye tracking durante os testes da versão desktop, o que deu uma perspectiva adicional sobre o comportamento dos utilizadores.
Ambos os protótipos atingiram pontuações elevadas tanto para usabilidade como para a experiência do utilizador, e houve uma melhoria geral nas várias versões das aplicações, tanto de desktop como móvel. Os testes com eye tracking também permitiram identificar alguns problemas que doutro modo não poderiam ser detetados, nomeadamente elementos chave que faltavam nas interfaces.
Palavras chave: User-Centered Design; Cognitive Walkthrough; THEMIS; Gestão de
xv
Table of Contents
1 Introduction ... 1
1.1. Context of the dissertation ... 3
1.2. Objectives ... 3
1.3. Methodology... 3
1.4. Structure of the dissertation ... 3
2 Literature review ... 5 2.1. Disaster management ... 5 2.2. THEMIS ... 6 2.3. User-Centered Design ... 6 2.4. User experience ... 9 2.5. Usability testing ... 9 3 Methodology ... 13
4 Interface prototypes development ... 15
4.1. Phase 1 of UCD - Understand and specify the context of use ... 15
4.1.1. Context of use ... 15
4.1.2. Types of users ... 15
4.2. Phase 2 of UCD - Specifying the user requirements ... 16
4.2.1. Users’ needs ... 16
4.2.1.1. System administration ... 16
4.2.1.2. Operation preparation ... 17
4.2.1.3. Operation execution ... 17
4.2.1.4. Operation analysis ... 18
4.2.2. System functional requirements definition ... 19
4.2.2.1. Use cases ... 19
4.2.2.1.1. System administration. ... 20
4.2.2.1.2. Set up a new operation. ... 20
4.2.2.1.3. Check location and status of incidents and brigades. ... 21
4.2.2.1.4. Validate system recommendations. ... 21
4.2.2.1.5. Manually parameterize orders... 22
4.2.2.1.6. Input information on behalf. ... 23
4.2.2.1.7. Receive orders from PCT. ... 24
4.2.2.1.8. Report status to PCT. ... 24
4.2.2.1.9. Register people. ... 25
4.2.2.1.10. Look up and consult procedures and technical documentation. ... 25
4.2.2.1.11. Check the operation’s history of events. ... 26
4.2.2.1.12. Generate forms or documents, based on the system’s data. ... 26
xvi 4.2.3. System requirements ... 27 4.2.3.1. System administration ... 27 4.2.3.2. Operation preparation ... 28 4.2.3.3. Operation execution ... 29 4.2.3.4. Operation analysis ... 31
4.3. Phase 3 of UCD - Produce design solutions to meet user requirements ... 31
4.4. Digital interface design ... 34
5 Phase 4 of UCD - Evaluate the design against requirements... 35
5.1. Task success ... 38
5.2. Efficiency (Task time)... 38
5.2.1. Desktop application... 38
5.2.2. Mobile application ... 46
5.3. Efficiency (Number of clicks) ... 51
5.3.1. Desktop application... 51
5.3.2. Mobile application ... 53
5.4. Efficacy (Errors) ... 55
5.4.1. Desktop application... 55
5.4.2. Mobile application ... 56
5.5. System Usability Scale ... 58
5.5.1. Desktop application... 58
5.5.2. Mobile application ... 58
5.6. User Experience Questionnaire ... 58
5.6.1. Desktop application ... 59
5.6.2. Mobile application ... 60
5.7. Eye tracker ... 63
6 Conclusions and suggestions for future work ... 71
6.1. Conclusions ... 71
6.2. Suggestions for future work ... 71
Appendix A – All developed personas (Portuguese) ... 77
COMANDANTE DO POSTO DE COMANDO EM TERRA ... 77
CHEFE DA EQUIPA DE RECONHECIMENTO ... 78
CHEFE DA EQUIPA MÉDICA ... 79
CHEFE DA EQUIPA DE BUSCA E SALVAMENTO... 80
CHEFE DA EQUIPA TÉCNICA - MECÂNICA ... 81
Appendix B - Paper desktop prototype ... 82
Appendix C – Used questionnaires (Portuguese) ... 88
Appendix D – Initial version of the prototypes ... 114
xvii
Appendix D.2 – Desktop interface prototype for operation execution ... 132
Appendix D.3 – Mobile interface prototype for operation execution ... 152
Appendix E – Final version of the prototypes ... 161
Appendix E.1 – Desktop interface prototype for operation preparation ... 161
Appendix E.2 – Desktop interface prototype for operation execution ... 174
xix
List of Figures
Figure 1.1 - Means used for situational awareness and disaster management at the command
post. ... 2
Figure 1.2 - High-level concept of project THEMIS (Simões-Marques, Correia, Teodoro & Nunes, 2018b). ... 2
Figure 2.1 – Disaster Management Cycle. ... 5
Figure 2.2 - User-Centered Design ... 7
Figure 3.1 – Used methodology steps, based on the UCD framework. ... 13
Figure 4.1 - Example of a persona (written in portuguese). ... 19
Figure 4.2 - System administration use case. ... 20
Figure 4.3 - New operation set up use case. ... 20
Figure 4.4 - Checking location and status of incidents and brigades use case. ... 21
Figure 4.5 - System recommendation validation use case... 22
Figure 4.6 - Manual order parameterization use case. ... 23
Figure 4.7 - Information on behalf input use case. ... 23
Figure 4.8 - PCT orders reception use case. ... 24
Figure 4.9 - PCT status report use case. ... 24
Figure 4.10 - People registration use case. ... 25
Figure 4.11 - Procedures and documentation search and use use case. ... 25
Figure 4.12 - Operation's history of events consulting use case. ... 26
Figure 4.13 - Forms and documents generation use case. ... 26
Figure 4.14 - User communication use case. ... 27
Figure 4.15 - Map with the location of various entities. ... 32
Figure 4.16 - Map icon’s pop-ups. ... 33
Figure 4.17 - Incident types and new order pop-ups. ... 33
Figure 4.18 – Response team types filtering pop-up. ... 34
Figure 5.1 - First version of the desktop interface for the status table menu. ... 36
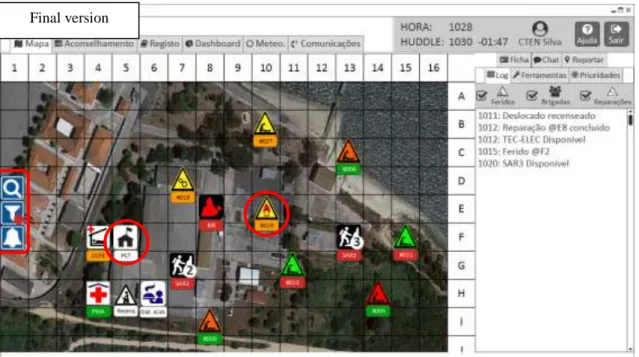
Figure 5.2 - Final version of the desktop interface for the status table menu. ... 37
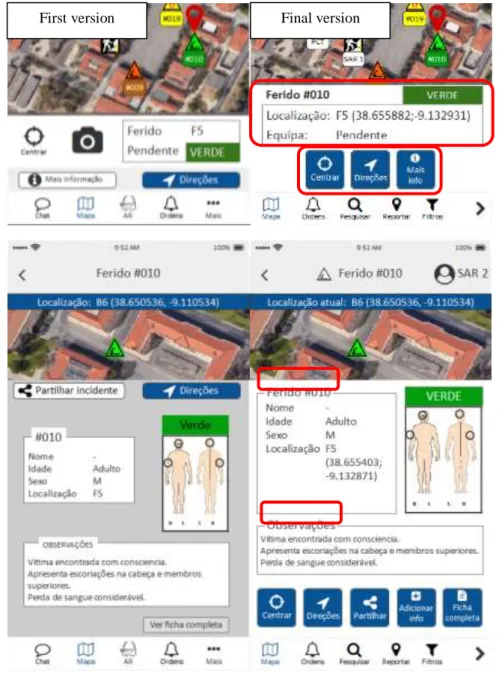
Figure 5.3 - First version of the mobile map interface. ... 37
Figure 5.4 - Final version of the mobile map prototype. ... 37
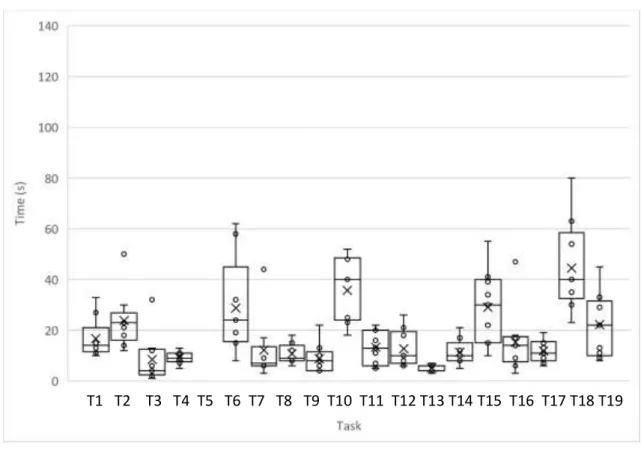
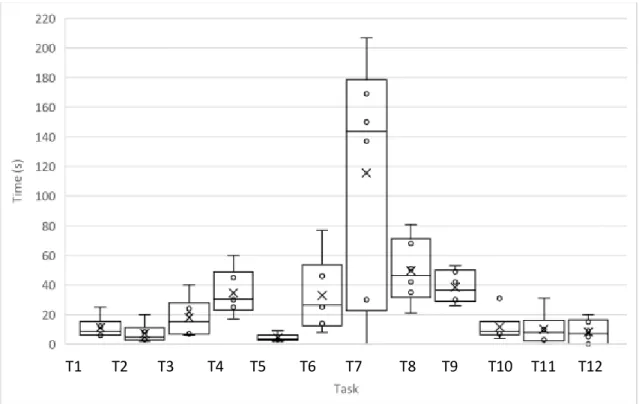
Figure 5.5 - Average time in seconds taken in each task for the first round of tests on desktop and stantard deviation. ... 40
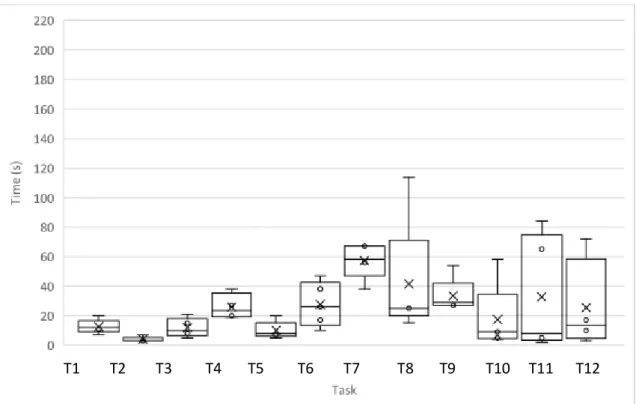
Figure 5.6 - Average time in seconds taken in each task for the second round of tests on desktop and standard deviation... 40
Figure 5.7 - Comparison between the first and final versions of the desktop application interface for task 2. ... 41
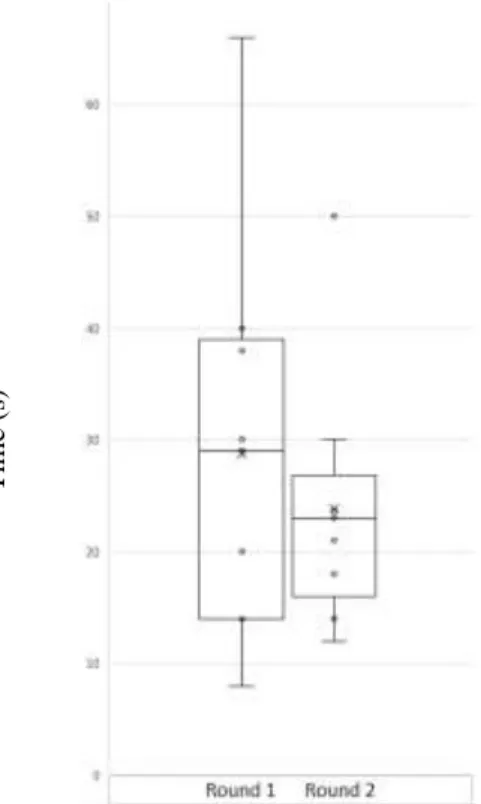
Figure 5.8 - Comparison between the average time in seconds taken to complete task 2 in rounds 1 and 2 ... 42
Figure 5.9 - Comparison between the first and final versions of the desktop application interface for task 7. ... 42
Figure 5.10 - Comparison between the average time in seconds taken to complete task 7 in rounds 1 and 2. ... 43
Figure 5.11 - First version of the desktop application interface for task 10. ... 43
Figure 5.12 - Final version of the desktop application interface for task 10. ... 44
Figure 5.13 - Comparison between the average time in seconds taken to complete task 10 in rounds 1 and 2. ... 44
Figure 5.14 - Comparison between the first and final versions of the desktop application interface for task 15. ... 45
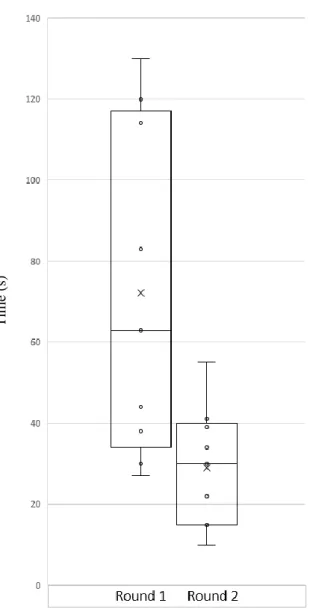
Figure 5.15 - Comparison between the average time in seconds taken to complete task 15 in rounds 1 and 2. ... 46
Figure 5.16 - Average time in seconds taken in each task for the first round of tests on mobile. ... 47
Figure 5.17 - Average time in seconds taken in each task for the second round of tests on mobile. ... 48
xx
Figure 5.18 - Average time in seconds taken in each task for the third round of tests on mobile.
... 48
Figure 5.19 - Comparison between the first and final versions of the mobile application interface for task 4. ... 49
Figure 5.20 - Comparison between the first and final versions of the mobile application interface for task 7. ... 50
Figure 5.21 - Comparison between the average time in seconds taken to complete task 4 in rounds 1, 2 and 3 ... 50
Figure 5.22 - Comparison between the average time in seconds taken to complete task 7 in rounds 1, 2 and 3 ... 50
Figure 5.23 - Average clicks on each task for round 1 of desktop tests. ... 52
Figure 5.24 - Average clicks on each task for round 2 of desktop tests. ... 52
Figure 5.25 - Comparison between the first and final versions of the desktop application interface for task 9. ... 53
Figure 5.26 - Comparison between the first and final versions of the mobile application interface’s bottom bar. ... 53
Figure 5.27 - Average clicks on each task for round 1 of mobile tests. ... 54
Figure 5.28 - Average clicks on each task for round 2 of mobile tests. ... 54
Figure 5.29 - Average clicks on each task for round 3 of mobile tests. ... 55
Figure 5.30 - Percentage of users that made mistakes on each task for round 1 of desktop tests. ... 56
Figure 5.31 - Percentage of users that made mistakes on each task for round 2 of desktop tests. ... 56
Figure 5.32 - Percentage of users that made mistakes on each task for round 1 of mobiles tests. ... 57
Figure 5.33 - Percentage of users that made mistakes on each task for round 2 of mobile tests. 57 Figure 5.34 - Percentage of users that made mistakes on each task for round 3 of mobile tests. 58 Figure 5.35 - UEQ score for the first version of the desktop application prototype. ... 59
Figure 5.36 - UEQ score for the second version of the desktop application prototype... 59
Figure 5.37 - Comparison between the first and final versions of the desktop application interface for the registry. ... 60
Figure 5.38 - UEQ score for the first version of the mobile application prototype. ... 61
Figure 5.39 - UEQ score for the second version of the mobile application prototype. ... 61
Figure 5.40 - UEQ score for the third version of the mobile application prototype. ... 62
Figure 5.41 - Comparison between the first and final versions of the mobile application interface for injured number 15’s registry. ... 62
Figure 5.42 - First set up for the eye tracking tests. ... 63
Figure 5.43 - Eye tracking hardware. ... 64
Figure 5.44 - Location the users must look at to complete task 2 (first version of the prototype). ... 65
Figure 5.45 - Heat map of task 2 (first version of the prototype). ... 65
Figure 5.46 - Location the users must look at to complete task 2 (second version of the prototype). ... 66
Figure 5.47 - Heat map of task 2 (second version of the prototype) ... 66
Figure 5.48 - Locations the users must look at to complete task 10 (first version of the prototype). ... 67
Figure 5.49 - Heat map of task 10 (first version of the prototype). ... 67
Figure 5.50 - Locations the users must look at to complete task 10 (second version of the prototype). ... 68
Figure 5.51 - Heat map of task 10 (second version of the prototype). ... 68
Figure 5.52 - Locations the users must look at to complete task 15 (first version of the prototype). ... 69
Figure 5.53 - Heat map of task 15 (first version of the prototype). ... 69
Figure 5.54 - Locations the users must look at to complete task 15 (second version of the prototype). ... 70
xxi
xxii
List of Tables
Table 4.1 - User needs for system administration. ... 16 Table 4.2 - User needs for operation preparation ... 17 Table 4.3 - User needs for operation execution by type of users. ... 17 Table 4.4 (cont.)- User needs for operation execution by type of users. ... 18 Table 4.5 - User needs for operation analysis... 18 Table 4.6 - System requirements for system administration ... 27 Table 4.7 - System requirements for operation preparation. ... 28 Table 4.8 - System requirements for operation execution. ... 29 Table 4.9 - System requirements for operation analysis. ... 31 Table 5.1 - List of tasks proposed to users in order to test the prototypes. ... 35 Table 5.2 - Task success rate for both the desktop and mobile applications. ... 38 Table 5.3 - Reduction rate of the time taken to complete tasks on the desktop application ... 39 Table 5.4 - Reduction rate of the time taken to complete tasks on the mobile application ... 47 Table 5.5 - Reduction rate of the number of clicks required to complete tasks on the desktop application. ... 51 Table 5.6 - Reduction rate of the number of clicks required to complete tasks on the mobile application. ... 53
xxiv
List of Abbreviations
ASQ After-Scenario Questionnaire
CO Commanding Officer
CONFIG USER Configuration user
DISTEX Disaster Exercise
HCI Human-computer interaction
INSARAG The International Search and Rescue Advisory Group
MED Medical Team
NGOs Non-governmental organisations
OSOCC On-Site Operations Coordination Centre
PCT Posto de Comando em Terra; Ashore Command Post
RECON Reconnaissance Team
SAR Search and Rescue Team
SUS System Usability Scale
SYS ADMIN System Administrator
TEC Technical Team
THEMIS disTributed Holistic Emergency Management Intelligent System
UCD User-Centered Design
UEQ User Experience Questionnaire
UI User Interface
UNISDR United Nations Office for Disaster Risk Reduction
1
1 Introduction
1.1. Context of the dissertation
Disaster Management is a very complex issue involving many different actors and organizations, that vary in capabilities, size and attitudes, such as the Red Cross and Red Crescent Movements, UNISDR (United Nations Office for Disaster Risk Reduction), INSARAG (The International Search and Rescue Advisory Group) and NGOs (Non-governmental organisations) in very challenging scenarios, which require fast and correct actions, making the decision-making process a critical element while facing stressful conditions (Byman, Lesser, Pirnie, Benard & Waxman, 2000; Correia, Severino, Nunes & Simões-Marques, 2018).
In order for the decision makers to make correct assessments and decisions, they need accurate and relevant information, which makes it their most valuable asset at their disposal along with critical thinking (Albanese & Paturas, 2018). However, there is also the risk of being presented with too much information that comes from the media, hard-copy notes, telephone conversations and face-to-face briefings, causing the decision maker to be overwhelmed, hindering the decision-making process (Albanese & Paturas, 2018).
Given these factors, it is imperative that a digital tool for decision making in disaster management scenarios is highly usable and intuitive, so as to prevent human error and provide the much-needed information to the decision maker, and instead of hindering it enhances workflow and the decision-making process (Estuar, de Leon, Santos, Ilagan, & May, 2014).
The Portuguese Navy conducts disaster relief operations (DRO) whenever needed, providing support to populations affected by catastrophes, as well as assisting local authorities, being capable of acting independently and fully self-sustained. The ashore command post (PCT - Posto de Comando em Terra)1, is responsible for setting the priorities of action and managing the
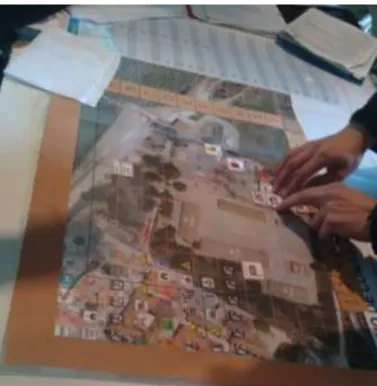
available resources, given the general directives for the specific DRO. In the initial setup the officer commanding the PCT receives information provided by team coordinators, which in turn receive information reports by radio. With a map of the affected area set on a table, the information is then represented by graphical markers placed manually on the map, to help the disaster manager to get a generalized picture of the current scenario, as illustrated Figure 1.1. Based on this information the PCT commanding officer orders actions and assigns teams via the team coordinators that transmit them by radio. Information regarding the affected population is kept on handwritten tables, along with a log of events.
Given the lack of use of technological solutions to support the disaster management process, there is an undergoing R&D project funded by the Portuguese Ministry of Defense, aiming at the creation of an intelligent emergency management system named THEMIS (disTributed Holistic Emergency Intelligent System), to support the decision making process performed at the PCT, including the report of information about events and response teams, and ultimately aiding inter-agency cooperation (Simões-Marques, Correia, Teodoro, & Nunes, 2018a).
1 The PCT corresponds to the On-Scene Operational Command Center (OSOCC) in the INSARAG terminology (United Nations Office for the Coordination of Humanitarian Affairs (OCHA), 2015).
2
Figure 1.1 - Means used for situational awareness and disaster management at the command post.
Illustrated in Figure 1.2 is a high-level conceptual perspective of the system in a scenario of a major disaster where multiple international agencies provide assistance and relief (Simões-Marques et al., 2018b). This dissertation will be focusing on the system’s UI (User interface) for the “Responders” and “Disaster Managers”.
Figure 1.2 - High-level concept of project THEMIS (Simões-Marques, Correia, Teodoro & Nunes, 2018b).
3
1.2. Objectives
This dissertation’s primary goal is to produce and validate two user interface prototypes for the THEMIS emergency management intelligent system, one for desktop equipment and the other for mobile equipment. The user interfaces’ usability and user experience are critical given the complexity of the context of use (i.e., disaster management). THEMIS purpose is to help the decision makers by giving them all the relevant information regarding the operation and by providing counseling and assistance in decision-making through advice on courses of action. It should also allow users to report information and add it to the system, to keep the scenario as up to date as possible.
1.3. Methodology
The methodology used in this dissertation is based on a framework known as User-Centered Design, which is composed of four stages: Understand and specify the context of use; Specify the user requirements; Produce design solutions to meet user requirements; Evaluate the designs against requirements. This is an iterative process where user representatives are part of the development from the very beginning, that aims to produce a solution that meets the user requirements. The methodology used in this dissertation is further explained in chapter 3.
1.4. Structure of the dissertation
The present dissertation is divided in five chapters, which are further divided in subchapters, that will be briefly explained below.
The first chapter, an introduction of the dissertation, goes over the context on the work developed, as well as its objectives and a brief description of the methodology used.
The second chapter has a more theoretical nature, in which all the concepts, ideas and tools are gathered along with detailed explanations and contextualization of the concepts used in this dissertation.
The third chapter explains the methodology, in order to set the tone and framework for the activities developed and presented further along this document.
The fourth chapter follows the UCD framework, where the context of use was identified along with the users. Once identified the users’ needs it was possible to convert them into functional requirements and then begin designing the prototypes for the user interfaces, beginning on paper and finishing on a digital platform, until a version close to final and suitable for testing is developed.
The fifth chapter presents usability tests conducted using the prototype developed earlier. Then the results are analyzed, and new iterations of the prototype are developed, based on results and user feedback. These new versions are also tested, and its results are compared with previous iterations, producing a final version of the user interface prototype.
The sixth and final chapter is composed by conclusions regarding the work developed and its objectives, as well as limitations and suggestions for future work.
4
Afterwards the references used to support the work developed throughout the dissertation are listed.
5
2
Literature review
2.1. Disaster management
UNISDR defines disaster as “a serious disruption of the functioning of a community or a society at any scale due to hazardous events interacting with conditions of exposure, vulnerability and capacity, leading to one or more of the following: human, material, economic and environmental losses and impacts”. These losses typically exceed the ability of the affected community to meet and fulfil its demands using regular resources, requiring extraordinary support and relief (Dwivedi, Shareef, Mukerji, Rana, & Kapoor, 2017). For the first phase of emergency relief, victims need minimum requirements for survival, such as food, water, shelter and medicines, as the main objective is to save lives and minimize human suffering. This first phase, which is the most critical regarding operational time, usually lasts for some days to a week (Wisetjindawat, Ito, Fujita, & Eizo, 2014;Beamon & Balcik, 2008).
According to the International Federation of Red Cross and Red Crescent Societies (IFRC), the world's largest humanitarian organization, disaster management can be defined as “the organization and management of resources and responsibilities for dealing with all humanitarian aspects of emergencies, in particular preparedness, response and recovery in order to lessen the impact of disasters.”
Disaster management encompasses several activities, as seen in Figure 2.1, them being: Mitigating disasters; preparing for disasters and reducing risk of disasters; responding to disasters; and recovering from disasters. Its importance is highlighted by Russian war surgeon Pirogov in 1864: “In comparison a well-functioning organization of disaster management may save more lives than the knife of the surgeon”.
Figure 2.1 – Disaster Management Cycle2.
6
A disaster management system is a specific kind of information system suited to support complex processes regarding the coordination of operations in response to several types of disasters (Simões-Marques et al., 2018a).
Nowadays there are several disaster management systems and applications, designed for a series of different goals. These can be aimed for the general population to report incidents and emergencies to a central entity, while receiving real time alerts, like the FEMA (Federal Emergency Management Agency) application (https://www.fema.gov/mobile-app).
There is also Alert Technologies Corp’s OpsCenter, which is aimed for a coordination centre, providing real time information and resource management capabilities, such as staff management and checklists. This system, however, doesn’t have a geographical panorama for operations or a mobile app (https://www.alerttech.com/OpsCenter).
US-based Verint Systems’ NowForce provides a plethora of services, like personal safety apps, cloud-based computer aided dispatch and mobile response tools, aimed at campus security, private security and public safety organizations. This system is a much more complete alternative for disaster management, as the user interface is quite intuitive, and provides various options for viewing relevant information (https://www.nowforce.com/solution/overview/).
2.2. THEMIS
The goal of the THEMIS project is to implement an Intelligent System aimed at supporting disaster operations management in complex disaster scenarios. The core inference processes were discussed in (Simões-Marques, 2019), namely the ones addressing the assignment of response teams. Other lines of research, included knowledge management and the issues regarding the design of the THEMIS intelligent system’s Knowledge Base (Correia et al., 2018) (Simões-Marques, Filomena Teodoro, Calhamonas, Nunes, 2020), or exploiting user interaction considering augmented reality as a solution for on-site responders (Nunes, Lucas, Simões-Marques, & Correia, 2018)
An ongoing research focusing on the augmented reality of the mobile application (Alexandre Campos, 2019) (Campos, Correia, et. al., 2019), continues the previous work and uses the outcomes of the present work, which were published in (Simões-Marques, Mendonça, Figueiredo, Nunes, 2020).
A different study took a more empirical approach to user experience regarding the THEMIS project. Personas were used in order to find users’ needs, UML use-cases were used to map the activity and interactions of the users with the system and other users, in this case using the aforementioned personas. The study also provides samples of user interfaces for both desktop version (aimed at the decision-maker at the command post) and the mobile version (aimed at the responders on the field). Furthermore, functional requirements were specified in order to dictate what are the must-have functions and features of the system (Simões-Marques et al., 2018a). It can be said that the last study mentioned above was the first step towards ensuring good usability and user experience, which is the main goal of this dissertation.
2.3. User-Centered Design
User-Centered Design (UCD) is a well-defined framework, which has the users as the main focus from the first stages of the development process, thus making it possible to develop more useful and easy to use products and systems (Nunes, 2006).
7
UCD focuses on the user’s domains, environments, cultures, user requirements and is not a static process, as there exist multiple variations, composing of different methods and tasks, depending on process needs (Mithun, 2018).
This framework is composed by four main steps, as standardized in ISO 9241-210:2010, and depicted in Figure 2.2, that happens after the need for developing a product is identified. These steps are as follows:
1. Understanding and specifying the context of use; 2. Specifying the user requirements;
3. Producing design solutions; 4. Evaluating the design.
This is an iterative process that produces a product that fulfils the users’ needs, however after evaluation there are always improvements that can be introduced to further better the users’ experience.
Figure 2.2 - User-Centered Design3
The UCD framework can be applied whenever there is a need to develop a system or product as the following examples show.
One study followed the UCD framework to develop Learn to Quit, a smoking cessation app designed for people with serious mental illness. The researchers used expert panel guidance, development of personas and paper prototyping, all tools used in this dissertation as well. The prototype developed scored a mean of 74% on the System Usability Scale, to be used further ahead on section 5.5., which suggests that the prototype had promise. The study concluded that
8
the prototype’s simplicity enhanced the user experience, as well as gamification aspects and the use of cartoons (Vilardaga et al., 2018).
Another study used the UCD framework to develop a platform for medication reconciliation IT based on two applications. The usability tests used the System Usability Scale, where the score went from 72.3% to 75.0% on different iterations. The study concluded that most patients were satisfied with the app, as the usability and usefulness were highly complementary (Marien et al., 2018).
A study also used the UCD framework to help develop a chatbot-based messaging application for e-commerce. The research team began by gathering information on the users through a questionnaire and interviews. This allowed the researchers to understand user needs, referred as “goals” in the study, as well as the context of use. This in turn allowed for the development of 3 personas to model the typical users of the system. Afterwards the team identified usability and user experience goals in order to define “features of the system”, also known as system requirements. Once those were defined and design solutions were proposed, prototype design began in Balsamiq, in order to create a low-fidelity prototype, or wireframe, that allows for minimal interaction, which was then subjected to user tests, which in turn generated feedback to develop a high-fidelity prototype. This prototype was subjected to usability tests, which were composed by interviews, before and after, free exploration and task completion. The study concluded that by following the UCD framework, the prototype was accepted and rated positively by users, who agreed that the prototype was effective, efficient to use, easy to learn, enjoyable and helpful, as well as safe to use (Pricilla, Lestari, & Dharma, 2018).
Not only in HCI (Human-computer interaction) can UCD be applied. One study used the UCD framework to develop new workstations for six people in the IT department of a company. As usual in the UCD approach, the users were integrated in the design process from the beginning, which in turn allowed to produce solutions that were more complete, adequate and satisfactory to the user. Thusly the company mentioned the intention of expanding the use of UCD to other products (Duschenes, Mendes, Betiol, & Barreto, 2012).
Another study aimed to gauge user opinions on vehicle dashboard and instrument panel layout for the next generation of automobiles. This study followed the first steps of UCD, where the researchers identified the end users and surveyed their opinions regarding the current solutions’ usability, in order to further understand their needs and features they would like to see in future designs (Gibson, Butterfield, & Marzano, 2016).
A study from 2018 applied the UCD framework to develop and modernize business modeling tools, focusing in Component Business Modeling, a tool used by IBM as a use case. The research team began by identifying issues in the user base, and then followed by using personas to describe the typical user, to better understand the use context and user needs. Then by converting the issues previously identified into desired user goal, the research team was able to prioritize design aspects. The researchers then consulted stakeholders and selected users to further consolidate desired outcomes of the system. Thusly the research team began to design the user experience by creating scenarios, which were reviewed frequently. Finally, after considering the technical aspects of developing the tool, the research team followed an agile approach to software development. The study concluded that the UCD framework allowed for the successful adoption of the developed tool (Arar et al., 2018).
By involving users from the very beginning, UCD helps to ensure high usability of products, as the process is convenient, effective and mapped, so that it meet the user requirements, based on ergonomics and usability knowledge to find the user’s needs (Mithun, 2018).
9
2.4. User experience
User Experience (UX) is defined by “a person’s perceptions and responses that result from the use or anticipated use of a product, system or service.”, according to ISO 9241-210:2010, while Christian Kraft defines it as “the feelings that the user gets when using a product”. Kraft further claims that “using feelings as a comparison model allows us to understand that the user experience can be anything from hate to love. From anger to happiness. From indifference to passion. From expectance to nostalgia. From pride to humiliation. And so forth.” (Kraft, 2012).
There is also a need to differentiate User Experience from Consumer Experience. The first regards only the actual usage of the product while the second also includes when the user looks up the product all the way to customer service (Kraft, 2012).
Key factors for user experience are first impressions and how long they last, long term UX and how it can be compared to a personal relationship and positive or negative surprises (Kraft, 2012). Given the complexity of and the large variety of tasks present in the coordination and execution of emergency response scenarios, User Experience is of the utmost importance, given that THEMIS is a very complex and interactive computer-based system (Simões-Marques et al., 2018a).
2.5. Usability testing
Usability is defined by ISO 9241-210:2010 as the “extent to which a system, product or service can be used by specified users to achieve specified goals with effectiveness, efficiency and satisfaction in a specified context of use”. The Usability Professionals Association, UPA, defines Usability as “an approach to product development that incorporate direct user feedback throughout the development cycle in order to reduce costs and create products and tools that meet user needs.” Steve Krug (2000) provides his view on Usability as “making sure that something works well: that a person of average (or even below average) ability and experience can use the thing – whether it’s a website, a fighter jet, or a revolving door – for its intended purpose without getting hopelessly frustrated.”. Tullis and Albert (2008), looked at the previous definitions as well as others, and noted that they shared common themes: (1) a user is involved; (2) that user is doing something; (3) that user is doing something with a product, system or other thing.”
The importance of Usability cannot be overlooked. In November 2005, there were 75 million websites on the internet and about 30 million intranets inside corporate firewalls, summing up to over 100 million user interface designs. Of these about 70 million are professional user interface designs, intended to serve the customers of a business, government agencies or non-profit organizations. As such, these user interfaces must have good usability otherwise these could incur in heavy costs (Nielsen, 2005).
In order to evaluate a user interface design there are several tools at one’s disposal. The quickest and cheapest of them are heuristic evaluations, which helps identifying usability problems in early designs and prototypes, which at least three users (Simões-Marques & Nunes, 2012). Nielsen also deducted the correlation of the amount of usability problems to the number of heuristic evaluators, as well as the relationship between the ratio of benefits to costs and the number of evaluators (Nielsen, 1994). The most well-known heuristics are Jakob Nielsen’s, which were published in 1994, where the author concluded that these heuristics seemed to be excellent for explaining usability problems (Nielsen, 1994):
10 • Visibility of systems status;
• Match between system and the real world; • User control and freedom;
• Consistency and standards; • Error prevention;
• Recognition rather than recall; • Flexibility and efficiency of use; • Aesthetic and minimalist design;
• Help users recognize, diagnose and recover from errors; • Help and documentation.
There are also other well-known and widely used heuristics.
Gerhardt-Powals' cognitive engineering principles are comprised by 10 heuristics, similar to Nielsen’s, albeit more holistic. They were developed in a study regarding antisubmarine warfare, where there was a specific user with a specific set of tasks. The study concluded that cognitively-engineered interfaces are superior in performance, satisfaction and workload, reaction time and accuracy measures. The study further concluded that applying these principles (or heuristics) will enhance HCI (Gerhardt‐Powals, 1996).
Weinschenk and Barker (2000) compiled a list of 20 principles and guidelines from different sources including Nielsen’s 10 Heuristics, Apple and Microsoft.
Ben Shneiderman’s Eight Golden Rules can also be used during an heuristic evaluation (Shneiderman & Plaisant, 2005).
Another set of heuristics are Connell and Hammond’s 30 Usability Principles, that are grouped into seven larger sets (Connell, 2000): Requirements and Functionality Principles; User-System Principles; User Principles; Comparative Principles; System Performance Principles; Perceptual and Motor Principles; and User Support Principles.
Cognitive walkthrough is a tool that can be used to evaluate the usability of a UI, beyond the use of heuristics. It is a theoretically structured evaluation process in the form of a list of questions, which focus the designer’s attention on individual aspects of the interface. The process begins by specifying a series of tasks, then the success of each task is evaluated, and finally questions about each task, regarding ease of the task and system response, gather feedback for the designer’s consideration (Lewis, Polson, Wharton, & Rieman, 1990). This tool can detect almost 50 percent of the problems that can be revealed by a full-scale evaluation study, by using different realistic tasks. This however, doesn’t mean that the need for evaluating interface prototypes disappears. It just means that a considerable amount of problems can be encountered with very limited investment and resources (Lewis et al., 1990). This tool provides self-reported metrics regarding the use of the system, while the users are performing the tasks, answering questions and thinking aloud. The test moderator should take notes of the participant’s behaviour and responses to questions, but most importantly to gather are errors, their frequency, type and severity. Task success and task efficiency are also data that are useful for further analysis (Tullis & Albert, 2008).
Self-reported metrics can be gathered at the end of tasks, but also at the end of the study (Tullis & Albert, 2008). While there are various tools to gather data and user feedback at the end of the study, this dissertation will focus on the two tools used: System Usability Scale and User Experience Questionnaire.
The System Usability Scale (SUS) is a ten-item Likert scale, developed by John Brooke in 1996 that presents the user with statements regarding a variety of aspects of system usability, to which
11
they agree or disagree (Brooke, 1996). The results are then presented as a percentage, where a higher percentage means a better score. Tullis and Stetson, in 2004 compared five questionnaires for assessing the usability of one website, one of them being SUS. After analysing the data, the study concluded that SUS offered the most reliable results across sample sizes (Tullis & Stetson, 2004).
The User Experience Questionnaire (UEQ), is composed by 6 scales with 26 items. The scales are divided in pragmatic quality and hedonic quality and are as follows: Attractiveness; Perspicuity; Efficiency; Dependability; Stimulation; Novelty. Each item is composed by two terms of opposite meanings, with their order randomized, so that half the items start with a positive item and the rest with a negative item. The items are scored in a 7-stage scale, so that they can vary from -3 to +3, the most negative answer to the most positive (Laugwitz, Held, & Schrepp, 2008).
A powerful tool in usability research is eye tracking technology. Eye tracking is a tool that allows a user’s eye movements to be measured in order to gain the knowledge of where the user is looking at, at any given time, as well as the sequence in which they do so. This can give researchers insight regarding the way users process visual and display-based information, as well as factors that influence the usability of user interfaces (Poole & Ball, 2006).
Eye trackers allow researchers to know where the users are looking at, for how long, how their focus varies from item to item in the UI, what elements they miss, how they navigate and how size and position affects their attention. Eye tracking’s main strengths are that it doesn’t rely on memories or aware knowledge of the user and it allows to identify elements the user recognized and gazed at for some time, but didn’t understand its use (iMotions, 2008). Another advantage is that researchers don’t have to bother the user during the test too much when they are concentrated on the task at hand (Pernice & Nielsen, 2009).
There are two types of eye trackers: screen-based eye trackers, and glasses. The first are remote bars that are mounted on the screen where the UI is being displayed on, while the latter are mobile headsets that have small infra-red cameras mounted near the user’s eyes.
Although considered a new field, eye tracking has been used for many years in psychological research, and the first eye tracking experiments occurred more than 100 years ago, in around 1901 and 1905 (iMotions, 2008). Being an established technology, there are a few use cases that combine this technology with usability research.
One such use case is where researchers used eye tracking and think aloud techniques to evaluate the usability of three web services, two polish websites and BBC’s website, by giving their test users specific tasks to solve. The procedure consisted of a set of instructions, three questions and six tasks. Such tasks were finding the weather in Gdansk or find the exchange rate of polish currency to Euro. The data gathered with the eye tracker allowed researchers to produce heat maps, a quantitative analysis of where the users looked at in the UI (Weichbroth, Redlarski, & Garnik, 2016).
Another study analysed the navigation of users in travel blogs, profiles on social networks and online travel communities, as well as advertising efficacy of a banner on said sites. Thusly the research team used eye tracking along with self-administered questionnaires at the end of tests. The study concluded that eye tracking attention measurements differed slightly from measures of self-reported memory (Hernández-Méndez, Muñoz-Leiva, Liébana-Cabanillas, & Marchitto, 2016).
A study from South Korea used eye tracking to examine how consumer’s attention allocation behaviour worked in online search, more specifically attention adjustment, renewal, equilibrium
12
seeking and how these search behaviours vary when exposed to advertisements. This study concluded on users’ attention span, and how they navigate on the UI (Ahn, Bae, Ju, & Oh, 2018). Eye tracking also aided researchers to evaluate the usability of learning technologies at the classroom level, by grounding it in empirical evidence to be studied as the method used was based on the physiological data provided by the technology. This study is composed of four use cases where teachers provided face-to-face lessons with students from primary school to university (Prieto, Sharma, Kidzinski, & Dillenbourg, 2018).
A study also used eye tracking technology as a tool to evaluate specific design features of a prototype ecosystem services decision support system. The results provided helped identify critical features that could potentially influence the perception of the information present in the UI (Klein, Drobnik, & Grêt-Regamey, 2016).
Another study aimed at identifying critical issues regarding the usability of e-voting systems used eye tracking to study the user’s behaviour while using two different systems. As such, it was possible to identify two problematic areas that affect the ease of use, via qualitative and quantitative data analysis provided by executing a specific set of tasks, as well as the issues of displaying non-relevant information and avoiding user mistakes (Realpe-Muñoz et al., 2018).
13
3 Methodology
The methodology used to develop this work was based on the User-Centered Design framework (ISO 9241-210:2010). This framework consists of four main steps which are depicted in Figure 3.1.
Figure 3.1 – Used methodology steps, based on the UCD framework.
In the first step (Understanding and specifying the context of use), the target users were defined as well as the context in which they will use the system, through interviews to users (people with exercise experience and project coordinator), observing a Disaster Relief Training Exercise (DISTEX) and analyzing its related existing documentation, as well as researching emergency management systems that already exist, albeit without the intelligent decision support functionality. From this step resulted: (i) a list of the users’ needs; (ii) user personas were created that describe the archetypes of the various system’s users; and (iii) system use cases that map the interactions between the various actors and the system.
Regarding the second step (Specifying the user requirements), the users’ needs collected in the previous step were converted to system functional requirements. This was done using use case diagrams. These diagrams were elaborated for the more complex user needs, and all user needs were decomposed in a logical way. Afterwards, functional system requirements were identified to address the needs.
The third step (Producing design solutions) refers to the actual design of the user interfaces. However, an analysis of existing emergency management system solutions was needed to gather common practices and approaches. Then, paper prototypes were used, as it is a cheap and quick way to design basic user interfaces, in order to validate the core concept and gather feedback in a meeting with users. With the users’ feedback, adjustments were made, and the digital design of the interfaces took place.
14
In the fourth and final step of the process (Evaluating the design), a first version of both desktop and mobile prototypes was validated through freely exploring and accomplishing simple tasks, by a few experts, i.e. THEMIS project contributors and Naval Academy cadets. Then a group of participants took part in a test where a number of tasks were given for them to complete using a simulation of the interfaces, a usability evaluation methodology called Cognitive Walkthrough. In addition, the users were asked to answer two questionnaires, SUS and UEQ. The tests’ results were analyzed to identify flaws in the interfaces’ design and correct them. This analysis resulted in changes in the prototypes, which were then subjected to the similar usability tests as for the first versions. In addition to the aforementioned tools to evaluate usability and user experience, eye tracking was also used in order to gain insight as to how the users navigated through the interfaces, to further understand how key elements of the interface were missed and which elements drawn unwanted attention. This could be seen by creating gaze heatmaps of certain interfaces where users struggled to navigate or spent extra time.
15
4 Interface prototypes development
4.1. Phase 1 of UCD - Understand and specify the context of use
The work developed began by first understanding the context of use of the system in development, then the types of users, so that it is possible to assess the users’ need to obtain the system’s functional requirements.
4.1.1. Context of use
In order to identify user needs, first there is the need to list and fully understand the contexts in which the system will be used. Thusly, four use contexts were identified: system administration,
operation preparation, operation execution and operation analysis.
In the system administration context, the user (system administrator) will manage the core aspects of the system: the database, the knowledge base and the inference engine.
The operation preparation context, the user will define the operation scenario as well as the resources available to the crisis response effort. This will be done after the ship sails towards the affected area and will give the system the necessary information to configure and initialize the operation.
During the operation execution, the system will have users in two different environments. Those at an ashore command post (PCT) that will conduct the operations, managing and assigning resources to incidents. The other users will be at the disaster site, leading their teams as they follow the instructions, such as reporting incidents or repairing structures, given by the users at the PCT.
After an operation is over, there will be an operation analysis context, in which users will be able to look at the history of events, and playback the operation.
4.1.2. Types of users
Given the contexts of use, for each of them, the users must also be listed and fully defined, so that their needs can be gathered.
For the system administration context, the user is quite straightforward, as it will be a system administrator.
The operation preparation will be done by a user who will input the necessary information to configure a new operation, or finish configuring an existing one, which can be anyone with proper access to the system.
It’s during the operation execution that there will be the biggest number of users. Here there are five types of users, one at the ashore command post and four at the disaster affected area itself.
• The on-scene Commanding Officer (PCT), who needs a holistic view of the operation, so that they can integrate information and establish the priorities out in the field. Occasionally needs details. Reports to the Commanding Officer at the command post aboard (CO). The PCT convert the CO’s priorities into specific orders to the response teams.
• The reconnaissance (RECON) team leader receives orders from the PCT and coordinates their team. Reports injured and incidents to the PCT. Once their base mission is done, they provide help to other teams.
16
• The search and rescue (SAR) team leader receives orders from the PCT and coordinates their team. Rescues victims according to the priority defined by the PCT, brace structures when needed and transports injured to the medical post, by foot. Once their base mission is done, they provide help to other teams.
• The medical (MED) team leader helps building the field hospital or medical post. Their main activities are done in the aforementioned locations but can also go out in the field to give advanced medical care, per the PCT orders.
• The technical (TEC) team leader receives orders from the ashore command post and coordinates their team. The team makes repairs or capacities installation operations, to support the operation. The team also has specialized gear. Once the base mission is done, the team provides support to other teams.
There will also be logistic teams on the site as well, but for the beginning stages of this project, those will not be accounted for.
The operation analysis will be done by any officer that evaluates operations.
4.2. Phase 2 of UCD - Specifying the user requirements
4.2.1. Users’ needs
Once the users and the context were defined, information to assess user needs was gathered. Such was possible resorting to: a gathering of information regarding existing emergency management applications; field observation of a Disaster Relief Training Exercise (DISTEX); an analysis of relevant documentation, such as the Operation’s Orders for two different DISTEX; as well as conversations with navy officers with disaster management operational experience.
In order to understand explicit user needs, first, directed questions with users and people with training and disaster relief exercise experience were asked as well as brainstorming sessions with experts.
With all of this information gathered, and for each of the contexts of use, there are user needs that were identified and listed, so that system requirements can be determined. The tables list the users’ needs for the system administration (table 4.1), operation preparation (table 4.2), operation execution (table 4.3) and operation analysis (table 4.4).
4.2.1.1. System administration
For the system administration the user’s needs it was considered that the user is different than the rest of the contexts. In Table 4.1 the user needs for the system administration context are listed.
Table 4.1 - User needs for system administration.
Nº.
User needs
1 Differentiated log in for system administration 2 Manage knowledge base
3 Manage database
17 4.2.1.2. Operation preparation
In this context the user needs to check existing information, fill and generate the operation’s orders. In Table 4.2 the user needs for the operation preparation context are listed.
Table 4.2 - User needs for operation preparation
Nº.
User needs
1 Differentiated log in for operation preparation 2 Load an operation preparation file
3 Save an operation preparation file 4 Create a new operation preparation file 5 Ship identification
6 Define number of brigades and composition 7 Write a mission introduction
8 Define mission objectives 9 Define mission priorities
10 Define disaster type according to the international disaster database 11 Define area of operations
12 Define brigades’ tasks 13 Define communication plans 14 Preview operation’s orders 15 Generate operation’s orders
4.2.1.3. Operation execution
With this being the main and most critical usage of the system, a high number of needs were identified. These needs were also divided by the types of users. In Table 4.3 the user needs for the operation execution context are listed.
Table 4.3 - User needs for operation execution by type of users.
Nº.
User needs
Users
PCT RECON SAR MED TEC
1 Differentiated log in for operation execution X X X X X
2 Load an operation execution file X X X X X
3 Save an operation execution file X X X X X
4 Create a new operation execution file X X X X X
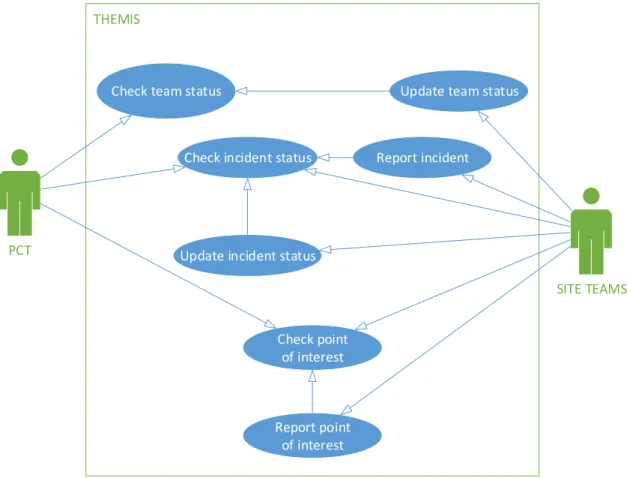
5 Check team status X
6 Update team status X X X X
7 Report incident X X X X
8 Check incident status X
9 Update incident status X X X
10 Report point of interest X X X X
11 Check point of interest X X X X X
12 Set priority preferences X
13 Check priority preferences X
14 Analyze system recommendation X
18
Table 4.4 (cont.)- User needs for operation execution by type of users.
Nº.
User needs
Users
PCT RECON SAR MED TEC
16 Manage orders X
17 Check order execution status X
18 New order alert X X X X
19 Confirm order reception X X X X
20 Update order execution status X X X X
21 Manually parameterize a new order X
22 Edit existing information X X
23 Access edit history X
24 Check current position X X X X
25 Register people X X X
26 Manage people registry X X
27 Look up and consult procedures and technical
documentation. X X X X
28 Check the operation’s history of events. X
29 Generate forms or documents. X
30 Communicate with users through the system. X
4.2.1.4. Operation analysis
Much like the system administration context, it was considered that the user was different than the other contexts. In Table 4.5 the user needs for the operation analysis context are listed.
Table 4.5 - User needs for operation analysis
Nº.
User needs
1 Differentiated log in for operation analysis 2 Search operation preparation file
3 Load operation preparation file 4 Search operation execution file 5 Load operation execution file 6 Playback operation’s events
Given the context of use, the types of users and their needs, it was possible to create five personas that realistically represent the system’s users, during the operation’s execution. These were created to provide accurate archetypes that can be used to assess the design development, as well as further understand the underlying needs and expectations the system is trying to fulfill. They also represent the majority of the user group, giving a clearer picture of how they will interact with the system in a realistic way.
19
The first persona created was the PCT commander to aid in designing the desktop version of the prototype, and then MED, RECON, SAR and TEC team leaders for the mobile version. The PCT commander persona is exemplified in Figure 4.1 while the rest are available in appendix A. BIO
NOME: Alves IDADE: 42 POSTO: Capitão-Tenente (CTEN; OF-3)
Oficial na Marinha Portuguesa, o CTEN Alves, começou a sua carreira militar na Escola Naval. Ao longo da sua carreira desempenhou múltiplas funções a bordo de navios e em terra.
A vontade de bem fazer é uma máxima que guia a sua ação e que incute às suas equipas. Além da preocupação com o rigor e a excelência, não descura o elemento humano no seu processo de decisão e perfil de liderança.
FUNÇÕES ATUAIS
É o Oficial Imediato da fragata NRP Corte-Real. PROFICIÊNCIA NO USO DE TECNOLOGIA
O CTEN Alves está habituado a utilizar meios digitais, desde computadores pessoais aos smartphones e tablets.
O CTEN Alves tem competências nos mais diversos softwares, tais como o Microsoft Office que usa com proficiência. Ao nível da gestão de informação e sistemas de apoio à decisão, o CTEN Alves, utiliza o SINGRAR para a gestão da Batalha Interna. FUNÇÃO EM OPERAÇÕES HUMANITÁRIAS
Como Imediato do navio, quando é chamado a desempenhar tarefas no âmbito do apoio humanitário e assistência a catástrofe, o CTEN Alves é o responsável pelo Posto de Comando em Terra (PCT). O comandante necessita de ter disponível o máximo de informação para o processo de tomada de decisão, que é complexo, mas conta com o apoio dos seus colaboradores e do sistema THEMIS para definir as prioridades de ação, para que se possa gerir de forma eficiente e eficaz os recursos disponíveis.
MOTIVAÇÕES PARA A UTILIZAÇÃO DO SISTEMA THEMIS
Durante a operação o CTEN Alves tem de definir prioridades de ação de modo a que os coordenadores de brigada possam gerir as
suas equipas eficientemente.
Assim, o output esperado pelo chefe do PCT, o Imediato, é a visualização de uma informação credível e em tempo para a tomada de decisão. Para isso, precisa de ter filtros para selecionar a informação mais relevante para a tomada de decisão. A informação consultada tem, desejavelmente, de ser clara e objetiva, sem qualquer ambiguidade.
As funcionalidades que o CTEN Alves identifica como necessárias no sistema são:
• Visualização integrada da operação (localização de edifícios e estruturas críticas, incidentes, localização de vítimas e das brigadas);
• Filtragem de informação de modo a ser possível focar-se em tipos de incidentes e recursos específicos; • Consulta/Edição de dados sobre incidentes e recursos;
• Aconselhamento na gestão e emprego dos recursos disponíveis; • Capacidade de emitir ordens para as equipas;
• Reforço da capacidade de comunicar/interagir com outros centros de coordenação dos níveis tático, operacional e estratégico; bem como com os próprios recursos.
Figure 4.1 - Example of a persona (written in portuguese).
4.2.2. System functional requirements definition
In this step, specifying the user requirements, the user’s needs identified so far need to be converted into functional systems requirements. Therefore, by representing the needs as use cases it is possible to understand how the user will interact with the system and what functional requirements there are. These system requirements will dictate which key elements the interfaces must have for the system to satisfy the users’ needs.
4.2.2.1. Use cases
In order to convert the users’ needs into functional system requirements each actor’s interaction with the system will be logically decomposed so as to find out what the system’s key elements for each interface are. Some needs, however, are straightforward and don’t require a use case diagram to be decomposed and analyzed. The use cases are: system administration, set up a new
20
operation, check location and status of incidents and brigades, validate system recommendations, manually parametrize orders, input information on-behalf, receive orders from PCT, report status to PCT, register people, look up and consult procedures and technical documentation, check the operation’s history of events, generate forms or documents, based on the system’s data and communicate with users through the system.
4.2.2.1.1. System administration.
The use case depicted in Figure 4.2 illustrates a system administrator’s interactions with the system. This user is in charge of managing the system’s knowledge base, and in order to do so, they require a login capability, as well as a way to input new knowledge to the existing base and manage the knowledge base itself.
SYS ADMIN
Log in
Input knowledge
Manage knowledge
Figure 4.2 - System administration use case.
4.2.2.1.2. Set up a new operation.
In Figure 4.3, a use case regarding the user that configures the system before an operation needs to be able to browse the existing knowledge in the system and input missing information. Afterwards the user needs to be able to validate the information required to generate an operation’s orders. CONFIG USER Browse existing knowledge Input missing information Generate Operation Order Validate Operation Order