www.ache.org.rs/CICEQ
Chemical Industry & Chemical Engineering Quarterly 15 (2) 77−81 (2009) CI&CEQ
KANAKAPURA BASAVAIAH1 NAGARAJU RAJENDRAPRASAD1
KANAKAPURA BASAVAIAH VINAY2
1
Department of Chemistry, University of Mysore, Manasagangothri, Mysore-570 006, India
2
Process Analytical Laboratory, Advinus Therapeutics, Peenya, 2nd Phase, Bangalore-560 058, India
SCIENTIFIC PAPER
UDC 615.214:616.89]:543.24:544.344
MICROTITRIMETRIC DETERMINATION OF A
DRUG CONTENT OF PHARMACEUTICALS
CONTAINING OLANZAPINE IN
NON-AQUEOUS MEDIUM
Two simple, rapid, reliable and cost-effective methods based on titrimetry in non-aqueous medium are described for the determination of olanzapine in pharmaceuticals. In these methods, the drug dissolved in the glacial acetic acid was titrated with the acetous perchloric acid with visual and potentiometric end point detection, crystal violet being used as the indicator for visual titration. The methods are applicable over 1-15 mg range of olanzapine. The proce-dures were applied to determine olanzapine in pharmaceutical products and the results were found to be in a good agreement with those obtained by the reference method. Associated pharmaceutical materials did not interfere. The precision results, expressed by inter-day and intra-day relative standard de-viation values, were satisfactory, higher than 2%. The accuracy was satisfac-tory as well. The methods proved to be suitable for the analysis of olanzapine in bulk drug and in tablets. The accuracy and reliability of the methods were further ascertained by recovery studies via a standard addition technique with percent recoveries in the range 97.51-103.7% with a standard deviation of less than 2%.
Key words: olanzapine; assay; titrimetry; non-aqueous; crystal violet; potentiometry; pharmaceuticals.
Olanzapine (OLP), chemically known as 2-me-thyl-10-(4-methyl-piperazin-1-yl)-4H-3-thio-4,9-diaza- -benzo[f]azulene (Fig. 1) is an atypical antipsychotropic drug. It is the most commonly prescribed second-ge-neration neuroleptic for the treatment of psychiatric patients suffering from schizophrenia. The need for reliable, sensitive, and fast methods for its analysis in bulk samples and pharmaceutical preparations, as been obvious since its introduction in a therapy of psychiatric disorders in 1997.
Fig. 1. Structure of olanzapine.
Corresponding author: K. Basavaiah, Department of Chemistry, University of Mysore, Manasagangothri, Mysore-570 006, India. E-mail: [email protected]
Paper received: 5.11.2008 Paper revised: 21.01.2009 Paper accepted: 5.02.2009
Only a limited number of analytical methods for the quantitative determination of OLP in pharmaceu-tical preparations are known such as UV-spectropho-tometry [1,2], visible spectrophoUV-spectropho-tometry [3], flow in-jection spectrophotometry [4], kinetic spectrophoto-metry [5], HPLC [6], HPTLC [7] and capillary zone electrophoresis and linear voltammetry [1]. Many re-ported methods are sensitive but time consuming and require expensive instrumental set-up and some pre-liminary treatment.
Despite its simplicity, versatility and long history, there is only one report on the use of the technique for the assay of OLP. Firdous et al. [2] have developed a non-aqueous titrimetric method using 0.10 N HClO4
as titrant and naphthobenzene as an indicator. Though the method is reported to be accurate with a percent recovery of 99.0-100.67% and precise with an inter- -day precision of 0.35%, it is applicable to macrosize samples.
crystal violet indicator or potentiometrically using a modified glass-saturated calomel electrode system. The methods, in addition to being rapid, sensitive (ap-plicable over 1-15 mg range), accurate and precise, gave satisfactory results when applied to formulations containing OLP. Additionally, the methods can be used in laboratories where modern and expensive instruments are not available.
EXPERIMENTAL
Materials and Methods
Apparatus
Potentiometric titration was performed with an Elico 120 digital pH meter provided with a combined glass-SCE electrode system. The KCl of the salt bridge was replaced with 0.10 M methanolic KCl.
Reagents and solutions
All chemicals used were of analytical reagent grade. All solutions were made in glacial acetic acid, unless mentioned otherwise.
Perchloric acid
The stock solution of (≈0.1 M) perchloric acid (S.
D. Fine Chem., Mumbai, India) was diluted appropria-tely with glacial acetic acid to get a working solution of 0.010 M perchloric acid and standardized with pure potassium hydrogen phthalate by using crystal violet as the indicator [8].
Crystal violet indicator (0.10%)
Prepared by dissolving 50 mg of the dye (S. D. Fine Chem., Mumbai, India) in 50 mL glacial acetic acid.
Standard drug solution
Phramaceutical grade olanzapine (OLP) was procured from Cipla India Ltd, Mumbai, India, as a gift, and was used as received. A stock standard so-lution containing 1 mg mL-1 OLP was prepared by dissolving 250 mg of pure drug in glacial acetic acid and diluting to the mark in a 250 mL calibrated flask with the same solvent.
General Procedures
Visual titration (method A)
An aliquot of the drug solution containing 1-15 mg of OLP was pipetted out into a clean and dry 100 mL titration flask and the total volume was brought to 15 mL by glacial acetic acid. Two drops of the crystal violet indicator were added and titrated with standard 0.010 M perchloric acid to a blue colour end point. The amount of the drug in the measured aliquot was calculated from
Amount (mg) = VMwR/n
where V = volume of perchloric acid required, mL;
Mw = relative molecular mass of the drug; R = molarity
of the perchloric acid and n = number of moles of
perchloric acid reacting with each mole of OLP.
Potentiometric titration (method B)
An aliquot of the standard drug solution equi-valent to 1-15 mg of OLP was pipetted out into a clean and dry 100 mL beaker and the solution was diluted to 20 mL by adding glacial acetic acid. The combined glass-SCE (modified) system was dipped in the solution. The contents were stirred magnetically and the titrant (0.010 M HClO4) was added from a
microburette. Near the equivalence point, titrant was added in 0.10 mL increments. After each addition of titrant, the solution was stirred magnetically for 30 s and the steady potential was noted. The addition of titrant was continued until there was no significant change in potential on further addition of titrant. The equivalence point was determined by applying the graphical method. The amount of the drug in the measured aliquot was calculated as described under visual titration.
Procedure for tablets
Oleanz 10 (Cipla India Ltd, Mumbai, India), Ole-anz 20 (Cipla India Ltd, Mumbai, India) and Opin 10 (Sun pharmaceutical Ltd), all tablets, were used in the investigation.
Twenty tablets were weighed and ground into a fine powder. An amount of the powder equivalent to 100 mg of OLP was weighed accurately into a 100 mL calibrated flask, 70 mL of glacial acetic acid was ad-ded and shaken for about 20 min. Then glacial acetic acid was added to the mark, mixed well and filtered using Whatmann No 42 filter paper. The first 10 mL portion of the filtrate was discarded. A suitable aliquot was next subjected to analysis by titrimetry as des-cribed earlier.
RESULTS AND DISCUSSIONS
the equivalence point with the potentiometric end point detection (Fig. 2). With both methods of the equivalence point detection, a reaction stoichiometry of 1:2 (drug:titrant) was obtained which served as the basis for calculation. Using 0.010 M perchloric acid, 1-15 mg of OLP was conveniently determined. The relationship between the drug amount and the titration end point was examined. The linearity between two parameters is apparent from the correlation coeffi-cients of 0.9986 and 0.9996 obtained by the method of least squares for visual and potentiometric me-thods, respectively. From this, it is implied that the reaction between OLP and perchloric acid proceeds stoichiometrically in the ratio 1:2 in the range studied (1-15 mg).
Validation
The optimized methods were completely vali-dated according to the procedures described in ICH guidelines for the validation of analytical methods [9].
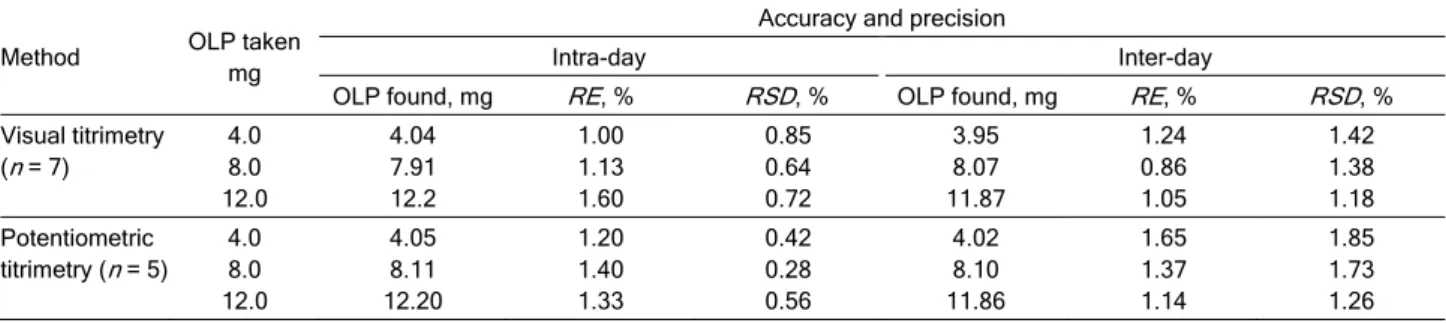
Intra-day and inter-day accuracy and precision The precision of the methods was evaluated in terms of the intermediate precision (intra-day and inter-day). Three different concentrations of OLP
with-in the range of study with-in each method were analyzed with-in seven and five replicates with respect to method A and B during the same day (intra-day precision) and five consecutive days (inter-day precision). For inter- -day precision, each day analysis was performed in triplicate and pooled-standard deviation was calcu-lated. The RSD values of intra-day and inter-day stu-dies for OLP showed that the precision of the thods was good (Table 1). The accuracy of the me-thods was determined by the percent mean deviation from the known concentration, bias (%) = [(Concen-tration found - known concen[(Concen-tration)×100/known con-centration]. Bias was calculated at each concentration and these results are also presented in Table 1.
Ruggedness of the methods
Method ruggedness was expressed as the RSD of the same procedure applied by four different analysts as well as using four different burettes. The analysts RSD were within 3% whereas the inter-burettes RSD for the same OLP concentrations ran-ged from 1.0% suggesting that the developed method was rugged. The results are shown in Table 2.
Fig. 2. Potentiometric titration curves for 10 mg OLP vs. 0.010 M HClO4.
Table 1. Intra-day and inter-day accuracy and precision evaluation
Method OLP taken
mg
Accuracy and precision
Intra-day Inter-day
OLP found, mg RE, % RSD, % OLP found, mg RE, % RSD, %
Visual titrimetry (n = 7)
4.0 8.0 12.0
4.04 7.91 12.2
1.00 1.13 1.60
0.85 0.64 0.72
3.95 8.07 11.87
1.24 0.86 1.05
1.42 1.38 1.18 Potentiometric
titrimetry (n = 5) 4.0 8.0 12.0
4.05 8.11 12.20
1.20 1.40 1.33
0.42 0.28 0.56
4.02 8.10 11.86
1.65 1.37 1.14
1.85 1.73 1.26 100
200 300 400 500 600 700 800
0 2 4 6 8 10 12
em
f in
m
V
Volume of perchloric acid
0 100 200 300 400 500 600
0 2 4 6 8 10 12
Volum e of perchloric acid
dE
/d
Application
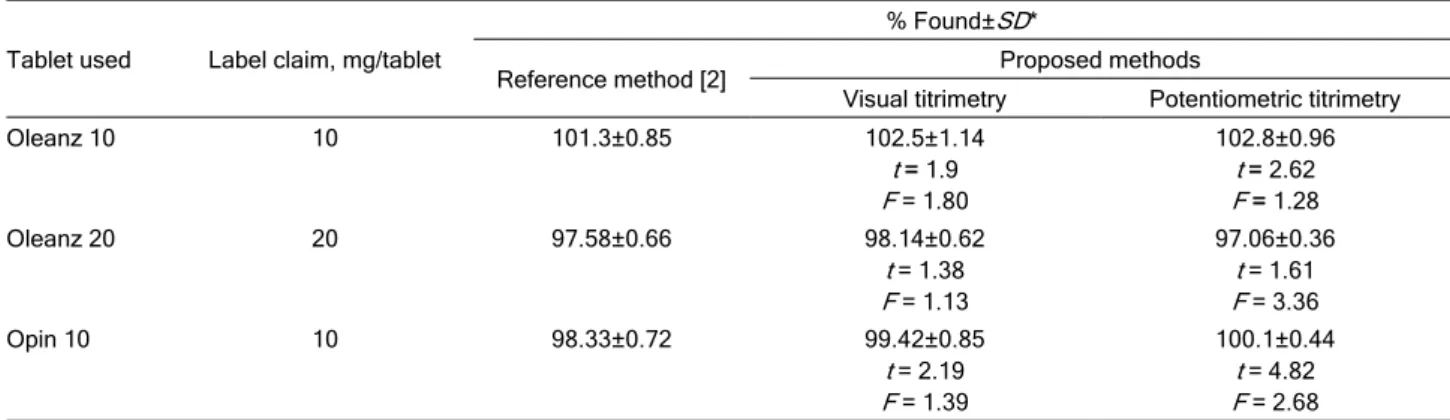
The proposed methods were successfully ap-plied to determine OLP in tablets. The same tablets were analyzed by an established procedure [2] for comparison. In the reference method, the tablet ex-tract in methanol was prepared and its absorbance was measures at 226 nm. The results obtained by the proposed methods agree well with those of the refe-rence method [2] and with the label claim. The results were also compared statistically by a Student’s t-test for accuracy and by a variance F-test for precision with those of the reference method at 95% confidence level as summarized in Table 3. The results showed that the calculated t and F values did not exceed the tabulated values inferring that proposed methods are as accurate and precise as the reference method.
Recovery study
The accuracy and reliability of the methods were further ascertained by performing recovery experi-ments. To a fixed amount of drug in formulation (pre- -analyzed), pure drug at three different levels was added, and the total was found by the proposed methods. Each test was repeated three times. The results compiled in Table 4 show that recoveries were in the range 99.5 to 103% indicating that commonly added excipients to tablets such as talc, starch, ge-latin, sodium alginate, magnesium stearate, calcium gluconate and calcium dihydrogen orthophosphate, did not interfere in the determination.
Table 2. Method ruggedness expressed as intermediate precision (% RSD)
Mehod OLP taken, mg Ruggedness
Inter-Analysts (n = 4) Inter-burettes (n = 4)
Visual titrimetry (n = 7)
4.0 8.0 12.0
1.75 2.12 2.46
0.64 0.72 0.36
Potentiometric titrimetry (n = 5)
4.0 8.0 12.0
2.26 2.52 1.84
0.28 0.14 0.39
Table 3. Results of the analysis of tablets containing OLP by the proposed methods and comparison with the reference method
Tablet used Label claim, mg/tablet
% Found±SD*
Reference method [2] Proposed methods
Visual titrimetry Potentiometric titrimetry
Oleanz 10 10 101.3±0.85 102.5±1.14
t = 1.9 F = 1.80
102.8±0.96 t = 2.62 F = 1.28
Oleanz 20 20 97.58±0.66 98.14±0.62
t = 1.38 F = 1.13
97.06±0.36 t = 1.61 F = 3.36
Opin 10 10 98.33±0.72 99.42±0.85
t = 2.19 F = 1.39
100.1±0.44 t = 4.82 F = 2.68
*Average of five determinations
Table 4. Results of the recovery study using the standard addition method
Tablet studied
Visual titrimetry Potentiometric titrimetry
OLP in tablet extract, mg
Amount of pure OLP added, mg
Total OLP found, mg
Pure OLP reco-vered*, %
OLP in tablet extract, mg
Amount of pure OLP added, mg
Total OLP found, mg
Pure OLP reco-vered*, %
Oleanz 20 4.1
4.1 4.1
2.0 4.0 6.0
6.15 8.06 10.0
102.5±0.63 99.04±0.72 98.30±1.12
4.11 4.11 4.11
2.0 4.0 6.0
6.18 8.12 10.08
103.6±0.62 100.3±1.04 99.58±0.72
Opin 10 3.98
3.98 3.98
2.0 4.0 6.0
5.93 7.95 9.90
97.51±0.71 99.33±0.96 98.72±0.58
4.0 4.0 4.0
2.0 4.0 6.0
6.02 8.01 10.22
101.2±0.67 100.3±0.92 103.7±1.36
CONCLUSIONS
Although several instrumental techniques [1-7] have been reported for the assay of olanzapine in pharmaceuticals they suffer from such draw backs as high cost, multiple extraction steps and also several clean-up steps (HPLC). They are time consuming and often poorly reproducible. In contrast, the proposed titrimetric methods are rapid, simple, precise and ac-curate; and above all, inexpensive. The previous non--aqueous titrimetric assay of olanzapine [2] is appli-cable for samples containing 50 mg active ingredient. In contrast, the present methods can be used over a semimicro scale (1-15 mg) thus offering an additional cost advantage. Hence, the proposed methods can serve as useful reference methods for routine assay as a part of industrial quality control.
Acknowledgement
Authors thanks M/S. Cipla India Ltd, Mumbai, for gifting pure olanzapine. One of the authors (N.R.P.) thanks the authorities of the University of Mysore, Mysore, for permission and facilities.
REFERENCES
[1] M.A. Raggi, G. Casamenti, R. Mandrioli, G. Izzo, E. Kennder, J. Pharm. Biomed. Anal. 23 (2000) 973-981
[2] S. Firdous, T. Aman, N. Alim-Un., J. Chem. Soc. Pak.27 (2005) 163-167
[3] A. Krebs, B. Starczewska, H. Puzanowsha-Tarasiewicz, J. Sledz. Anal. Sci. 22 (2006) 829
[4] A. Jasinska, E. Nalewajko, Anal. Chim. Acta. 508 (2004) 165-170
[5] A.A. Mohamed, Monatshefte fur Chemie/Chemical Monthly 139 (2008) 1005-1010
[6] X. Xuejun, T. Zhonghua., Zhongguo Yiyao Gongye Zazhi 35 (2004) 46-48, CAN 142:451962 AN 2005:262998.
[7] C.R. Shah, N.J. Shah, B.N. Suhagia, N.M. Patel, J. AOAC. Intl. 90 (2007) 1573-1578
[8] R.N. Jiri Kucharski, L.A. Safarik, Titrations In Non-Aqueous Solvents, Elsevier Publ. Comp., Amsterdam, 1965, p. 94