João Batista P. Falcão Filho* Institute of Aeronautics and Space São José dos Campos/SP – Brazil.
Maria Luísa Collucci C. Reis Institute of Aeronautics and Space São José dos Campos/SP – Brazil. [email protected]
Algacyr Morgenstern Jr. Institute of Aeronautics and Space São José dos Campos/SP – Brazil. [email protected]
* author for correspondence
Experimental results from the
sounding vehicle Sonda III test
campaign in the Pilot Transonic
Wind Tunnel
Abstract: The Pilot Transonic Wind Tunnel of the Institute of Aeronautics and Space has conducted the irst test campaign of a sounding vehicle, Sonda III. The campaign is part of a project whose activities and inal results are presented in this paper. During the test campaign, many activities were performed to increase the productivity and accuracy of the tunnel. These activities included calibration procedures, corrective and preventive trials, development of auxiliary devices, and theoretical and experimental analysis. Two tasks are described in details: the development and tests performed with the static pressure probe and the automatic re-entry lap actuation system. Several tests were carried out with the Sonda III at Mach numbers ranging from 0.3 to 1.0, at stagnation pressures of 70, 94, and 110 kPa. Experimental results include global aerodynamic coeficients (using internal balance) and pressure distribution over essential regions of the test article (using pressure sensitive paint technique).
Keywords: Aerodynamics, Experimental results, Sonda III, Transonic Wind Tunnel.
LIST OF SYMBOLS AND ACRONYMS
A: Cross sectional area of fuselage AEB: Brazilian Space Agency ALA: Aerodynamics Division of IAE
AEDC: Arnold Engineering Development Center
CD: Drag coeficient
CD0: Drag coeficient at zero angle of attack
CFD: Computational luid dynamics
CL: Lift coeficient
Cm: Pitching moment coeficient
Cl: Roll moment coeficient Cn: Yawing moment coeficient
CNPq: National Council for Scientiic and Technological Development
CY: Side force coeficient
DCTA: Department of Aerospace Science and Technology
EEI: Industrial Engineering College
FINEP: Brazilian National Agency for the Financing of Project and Studies
IAE: Institute of Aeronautics and Space ITA: Technological Institute of Aeronautics
C: Reference length
M: Mach number
PIC: Programmable microcontroller
PSP: Pressure sensitive paint
q: Dynamic pressure, deined by 0.5ρ∞ V∞2
TTP: Pilot Transonic Wind Tunnel UNITAU: University of Taubaté
UNIVAP: University of Vale do Paraíba USP: University of São Paulo VLS: Satellite Launch Vehicle
V∞: Velocity at free stream condition ρ∞: Static density at free stream condition σM: Standard deviation of Mach number
INTRODUCTION
The TTP of the IAE is a modern installation, built in 1997 and made operational in 2002. The tunnel has a conventional closed circuit and is continuously driven by an 830 kW main axial compressor and an intermittent injection system, which operates in a combined mode, for at least 30 seconds. Its test section is 300 mm wide and 250 mm high, with slotted walls, and it has automatic stagnation pressure controls (from 50 to 125 kPa), Mach number (from 0.2 to 1.3), stagnation temperature and humidity to properly simulate Mach and Reynolds numbers (Falcão Filho and Mello, 2002).
Figure 1 shows the operational envelope of the TTP, in which the test capacity of the tunnel in terms of Reynolds numbers related to a typical reference chord of 27.4 mm can be seen. The TTP is a 1/8th scale of an industrial transonic project. It was initially designed to study the innovative features of the industrial facility,
Received: 10/07/2011 Accepted: 04/10/2011
mainly concerning with the injection system operation in combination with the conventional main compressor operation. It was also designed to train the technical team to develop basic and academic research in high-speed regimes. Other activities include tests of vehicles with simple geometrical shapes, tests for the development of new aerodynamic transonic proiles, qualitative tests of airplanes with basic conigurations, anemometric tests, amongst others. To accomplish this, the tunnel has three sets of six multi-component internal balances manufactured by MicroCraft™ for measuring forces and moments, four modules of 16 pressure channels scanners from PSI™ (2000) for pressure distribution tests, a Schlieren visualization system, hot-wire equipment, and PSP technique to determine pressure distribution over the model surface. In addition, the tunnel possesses a two-dimensional probe positioning system, angle of attack remotely controlled system and re-entry lap capability (Falcão Filho et al., 2009).
Figure 2 shows a partial view of the aerodynamic circuit of the TTP along with some valves and tubing from the auxiliary systems, and the structural frame in grey, which
whose objective was to achieve know-how about sounding vehicles wind tunnel tests. Out of this amount, 48% were used in the product development, 47% in maintenance and 5% in consumables. The campaign lasted 46 months in contrast to the 41 originally planned, and it used the tunnel for an estimated 1,200 working hours.
Thus, the TTP technical team conducted a test campaign to assess the aerodynamic parameters of Sonda III, using an internal balance, and to investigate the pressure distribution using PSP (PSP technique) over important regions of the model, such as the ogive, the inter-stage area, and fins. The Sonda III vehicle is a sounding rocket developed by the IAE. This is a double stage vehicle with a 300 mm diameter second stage, capable of carrying a payload of approximately 100 kg up to an altitude of 600 km. It is one of the sounding rocket families named Sonda, which started with Sonda I, first launched in 1965. Sonda III was launched 27 times between 1976 and 2002. Two models were constructed to allow the installation of an internal balance inside the fuselage: a second stage model (scale 1:11) and a two-stage complete configuration model (scale 1:20). The internal balance was fixed to a sting structure to measure the model’s aerodynamic global parameters: forces (lift, CL, drag, CD and side,
CY) and moments (pitching, Cm, roll, Cl and yawing,
Cn). General force and moment coefficients were
calculated based on literature (Anderson, 2001), by Eq. 1 and 2:
C Force=
Force
q A (1)
C
Moment =
Moment
q A C (2)
where:
0 0 0.1 0.2 0.3 0.4 0.5
0.2 0.4 0.6 Mach Number
0.8 INJECTION
blow-off limit main compressor
turbining limit plenum evacuation
limit
sonic throat operation
limit main compressor limit
structural limit
R
e
ynolds number (millions)
T0 = 313 K
typical chord = 0.0274 m
1 1.2 1.4
Figure 1. The operational envelope of the TTP.
is used to open the plenum chamber door. Technical details regarding the TTP can be found in Falcão Filho and Mello’s (2002) paper.
As a transonic wind tunnel, the TTP is a suitable tool to investigate important effects in the transition range (Goethert, 1961). Particularly for the IAE sounding vehicles, some physical phenomena can be more precisely assessed and used for CFD code comparisons. This resulted in a proposal for a project, which was approved to run from 2007 to 2010. The AEB, by means of the VLS Associated Technology Projects, sponsored the activities of a complete test campaign with the sounding vehicle Sonda III, named “Realização de Ensaios do VS-30 no Túnel Transônico Piloto do IAE” (Tests Development with VS-30 in the IAE Pilot Wind Tunnel). An amount of BRL 271,981.57 was provided for the project,
A is a reference area, herein adopted as the maximum
cross sectional area of the fuselage,
C is a reference length, considered as the maximum fuselage diameter, and
q is a reference dynamic pressure, calculated from the free stream parameters (density and velocity), and given by Eq. 3:
q= 1
2 ȡ V 2
(3)
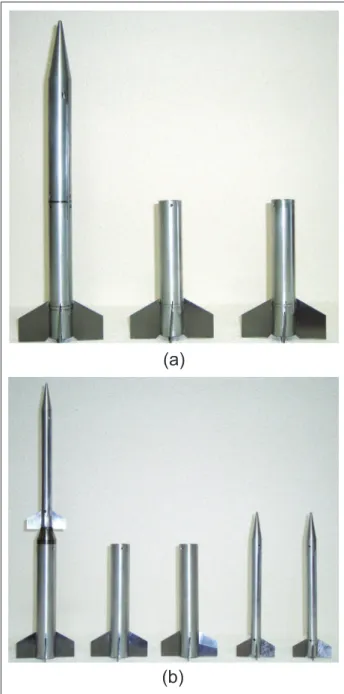
Figure 3 shows the scaled models utilized in the experiments, which have conigurations of angle of ins equal to 0º, 2.5º and 5.0º.
During the test campaign, many activities were performed to increase the tunnel’s productivity and accuracy of results. The present paper describes the main steps followed in implementing the project and some results obtained.
PRELIMINARY TASKS
Several procedures were undertaken during the campaign to better adapt the TTP for the proposed tests, which yielded important results that were then incorporated into the installation. Four different categories can be highlighted:
(1) calibration procedures for the following: forced extraction mass low from the plenum chamber, injection system operation with open and closed circuits, six-component internal balances with uncertainty determination, low quality assessment in the test section, model’s angle of attack setting of the model, and positioning of the re-entry laps;
(2) corrective and preventive maintenance procedures for several components and subsystems to guarantee the perfect operation of the tunnel throughout the campaign, such as the main frequency inverter, auxiliary compressors of injection system, circuit pressure and humidity controls, the cooling tower, the main motor gear lubrication, the auxiliary service air system, and cleaning of the aerodynamic circuit;
(3) design development of pressure probe with 34 measuring channels to test section uniformity veriication, calibration rig for multi-components internal balances loads application, two-dimensional platform for probe positioning, proile rotation device installed on the test section walls, blockage valve installed in the cooling water circuit, items for the pressure sensor scanner calibration, and plenum chamber opening mechanism;
(4) carrying out of theoretical and experimental studies to improve the TTP test performances, such as determining the main parameters of the injection system and the polytropic coeficient of the reservoirs, designing a irst-throat for Mach number 1.3, determining the operational parameters of the dryer system and the main parameters of the supersonic mixing chamber, as well as numerical simulations of NACA 0012 proile and Sonda III installed in the test section.
During the campaign, many scientiic studies were presented at conferences, and the TTP team had the technical collaboration of undergraduate students from many universities (ITA, ETEP, UNIVAP, UNITAU, USP-São Carlos), under Scientiic Initiation scholarships
(a)
(b)
Figure 3. Sonda III: (a) second stage in scale 1:11 and (b)
longitudinal distance from test section entrance (mm)
M
ach number
0 0 0.1 0.2 0.3 0.4 0.5 0.6 0.7 0.8 0.9 1
100 200 300 400 500 600 700 800 900
Figure 5. Distribution of the Mach number centerline (shaded area marks the nominal test section region).
sponsored by CNPq: Goffert et al. (2008a, 2008b), Zanin et al. (2008a, 2008b), Tagawa et al. (2008), Silva et al. (2009), Goffert and Falcão Filho (2008, 2009), Souza
et al. (2009), Reis et al. (2009), Goffert et al. (2010), Silva
et al. (2010), Souza et al. (2010), Vargas and Falcão Filho
(2010), Costa et al. (2010), Schiavo et al. (2011), Silva
et al. (2011), Falcão Filho and Ubertini (2011), Falcão Filho et al. (2011), Goffert et al. (2011).
Out of all the preliminary tasks conducted during the campaign, there are three very important ones worthy of mention: the internal balance calibration procedures, which are well documented in Tagawa et al. (2008) and
Reis et al. (2008, 2009, 2010); the static pressure probe
development; and the automatic re-entry lap actuation system. The last two will be further described.
According to Davis et al. (1986), the basic criterion to
ensure good low quality in modern transonic wind tunnels is given by the standard deviation of the Mach number over the nominal test section where the model is installed. The accuracy in this area must be periodically veriied to guarantee the robustness and repeatability of the tests performed in the installation. The criterion for the standard deviation of the Mach number is described by Eq. 4:
|2σM| ≤ 0.001 (4)
A static pressure probe was developed to assess the Mach number distribution in the TTP. The probe is composed of an ogive tip with an outer diameter of 17.2 mm and a cylinder 1,240 mm in length. The blockage area ratio of the probe is 0.39%. On the surface of the probe, there are 33 static pressure tap stations. Each station is composed of four oriices, which are circumferentially distributed in a cross section area of the cylinder. The four oriices are interconnected, which provide a single static pressure value of the low at each station location. One tap at the tip of the probe provides the total pressure. Pressure sensors located outside of the plenum chamber supply the pressure readings. Pressure taps holes of 0.5 mm diameter guarantee good accuracy of the pressure readings. The probe wall thickness is 2.1 mm to ensure suficient rigidity to prevent the probe from bending. Figure 4 shows the probe installed in the test section. Thanks to the rigidity imposed on the design, total bending of only 0.5 mm at the tip was observed, which was practically unnoticeable in the nominal test section region.
Figure 5 shows the Mach number distribution along the central line of the test section measured by the static pressure probe. The test section re-entry laps are closed and there is no forced mass extraction from the plenum chamber.
(a)
(b)
Figure 4. Static pressure probe installed in the test section
The shaded area marks the nominal test section region and the dashed vertical line marks the test section end. Two measuring stations are located further along this line, in the lap region. Mach number values in this igure were obtained by taking an average value from the test runs data readings over a period of 60 seconds. Mach number deviation observed in the nominal test section region was about 0.002 for most of the operational conditions in the tunnel. It shows that there is good low quality in the TTP, though still behind the modern state-of-art requirement established by Eq. 4. The test section wall convergent angle and the re-entry lap positioning angle can still be adjusted for better results, which will be carried out in a near future study.
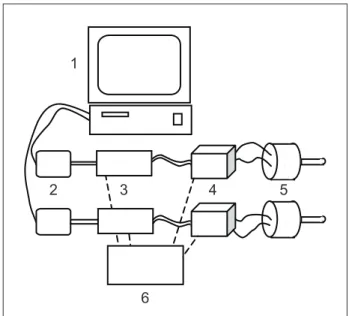
A remote control system based on stepper motors for the two lap panels (located at each lateral wall just after the test section) was developed to improve the tunnel performance and productivity (Fig. 6a). In the past, the opening of the lap angles was manually adjusted by means of wheels that commanded a worm screw, as seen in Fig. 6b, and it was necessary to stop the test to manually operate the laps command. As the tunnel circuit is pressurized, this procedure was very tedious and time consuming. Besides, in transonic tunnels, it is important to operate the re-entry laps remotely to investigate optimum test conditions for each test coniguration and model attitude. For example, at high angle of attack during polar movements, adjustment of the laps may be necessary.
The low chart in Fig. 7 shows the electronic components involved in the project to operate the stepper motors. The central microcomputer (1) located in the TTP control room, which is used to manage and monitor all subsystems actions in the tunnel, commands the lap to move to a determined angle. The signal is sent to the stepper motors (5) through auxiliary circuits (2), programmable microcontrolers named PIC (3) and power drivers (4). The PICs and the power drivers are supplied by a stable voltage source (6). Two hybrid stepper motors (5) were selected to operate in bi-polar and in series mode, since it is more appropriate for the driver utilized, with only two poles and with a lower raged current per phase. The power drivers chosen (4) with high performance receive signals from PICs (3). The signals are: clock, direction of movement and enabling, which command the stepper motors operation.
A PIC was chosen because it can be installed very close to the drivers and motors, thereby avoiding electrical noise. PICs are very popular due to their low cost, wide availability, large user base and programming, and re-programming capability. The microcontroller works as a remote logical unit, which receives data from the
Figure 6. Re-entry lap actuation: (a) modiied to remote control actuation, (b) original manual control.
1
2 3 4 5
6
Figure 7. Electronic logical data transference for stepper motor control using PIC.
(a)
central microcomputer. Then, the central microcomputer is free to perform other tasks. The PIC was programmed by a code developed in Assembler language, recorded by a Microchip™ unit, in order to send instructions to the drivers. The code contains information to control the stepper motors: the amount of pulses to allow movement, which directions to take and to emit an emergency signal. Since this logic unit is close to the motors, the communication frequency may be higher without electronic noise, thus allowing a faster motor movement. A switched mode power source supplies the PICs and the power drivers. An auxiliary electronic circuit between the microcomputer and the PIC was introduced to control voltage level and optical isolation, for operational safety reasons.
The PIC receives instructions from the central microcomputer by means of a program developed in LabView®. This program reports the current positioning of the angle of lap. When the user wants to change this value, a warning signal in yellow displays the value of the lap positioning while the operation is in progress. The original white color is restored when the operation is completed. The conversion between the desired angle and the amount of pulses and motor rotation direction is embedded in this operation as well as a protocol for communication with the PIC. It was necessary to establish a relation between the angle position and the positioning ruler in the shaft. The opening lap angle can be monitored and changed during a tunnel test procedure. Its average speed is 0.7 degrees per second, which is adequate for all tests devised in the tunnel.
RESULTS FROM FORCE AND MOMENT
The second stage of the Sonda III model was tested for the entire range of Mach number (Reis et al., 2010), even
though only hypersonic regimes data are of real interest. However, the results for the complete vehicle at transonic range are very useful due to its light at low altitude. Eighty aerodynamic polars were planned for the complete model varying the angle of attack from -5º to +5º, for coniguration of ins angle at 0º, 2.5º and 5.0º, related to the air direction. The Mach number range was from 0.2 to 1.0 for three stagnation pressure conditions: 70, 94 and 110 kPa.
For vehicles like Sonda III, which have jet exits at their rear, it is common to determine the aerodynamic coeficients data reduced to coeficients based on the assumption of zero base drag, i.e., the axial force
measured by the balance is subtracted from the model base area multiplied by the pressure difference between the measured value at the model base and at the free stream condition (Pope and Goin, 1978). Figure 8
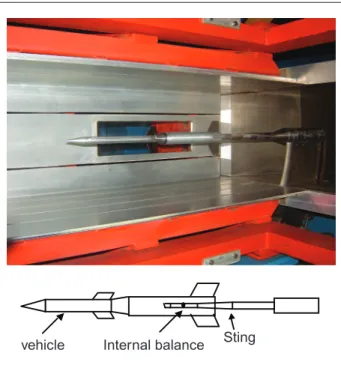
shows the complete model of Sonda III in scale 1:20 installed in the test section of TTP, with one end of the internal balance connected to the model and the other one to the sting, which is ixed to a semi-circular sector of angle of attack positioning. The diagram in the igure clariies the balance installation. Two pressure taps were installed at the rear part of the model to measure the base pressure, by taking an average of both taps. For all data herein reported, the assumption of zero base drag was applied.
vehicle Internal balance Sting
Figure 8. Sonda III complete model in scale 1:20 installed in the test section of the TTP and balance installation scheme.
The forces read by the internal balance had to be reduced to tunnel wind direction to obtain the lift and drag coeficients. Considering that the model is well aligned and the yaw angle is negligible, one can write (Pope and Goin, 1978):
FL =FNcosĮ-FA senĮ (5)
FD =F
N senĮ+FAcosĮ (6)
where:
FN and FA are the forces read by the internal balance, in its normal and axial direction, respectively,
FL and FD the forces in the normal and axial directions
relative to the wind direction, i.e., lift and drag, as they are deined, and
It is important to observe that the internal balance has small delections under stress and, during the tests, this effect on the angle of attack measurement was not considered.
Finally, in order to obtain the correct value of aerodynamic forces and moments, many inluences should be considered, such as: model support inluence, upwash, downwash, buoyancy effects, and model blockage area ratio inluence. In a transonic wind tunnel, many of these effects may be diminished by adjusting the low conditions in the test section, actuating in the wall delection and in the opening angle of re-entry laps. In most cases, it is possible to obtain good results in transonic wind tunnels simply by ensuring that the blockage area ratio is kept below 1% (Pope and Goin, 1978). The data presented herein represent the irst approach for the aerodynamic loads determination for Sonda III, as no other correction was employed. However, since the blockage area ratio of the model is 0.81% and the tunnel was adjusted to typical operational conditions of laps opening (10o), reliable results are expected for low Mach numbers (M∞<0.7) and reasonable results for higher speeds.
All the tests were performed using an internal balance with the following load limits of force: 160 N normal, 16 N axial and side; and moments: 24 Nm pitch, 16 Nm roll and yaw. The balance was calibrated in a rig with dead loads applied to obtain the calibration matrix to be used for data reduction (Reis et al., 2009). The Mach
number range was from 0.3 to 1.0, the stagnation pressure was 70, 94 and 110 kPa, and the model was installed in the test section in two different conigurations: one with the ins oriented in “+” and the other in “x”, turned 45º in relation to the former.
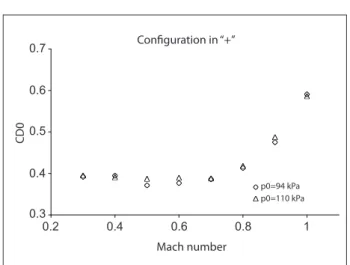
Figure 9 shows the CD variation at zero angle of attack
with the model in “+” coniguration. Results were as expected, characterized by a constant value for low Mach numbers and growing as it approaches sonic Mach number (for M≥0.8). No appreciable differences can be observed with the variation of stagnation pressure, i.e., with the variation of Reynolds number.
Figure 10 shows drag curves as a function of angle of attack for Mach number 0.80 for the model with ins at zero degree and in “+” coniguration, with stagnation pressures of 70, 94 and 110 kPa. The general appearance of the curves is quite close to the theoretical prediction, with a curve that has a parabolic tendency. It is observed that the Reynolds number variation (stagnation pressure) has not caused a signiicant impact on the curves. It can also be seen that the curve for 70 kPa presented some oscillation, because during the tests this low pressure value could not be kept very stable.
0.2 0.3 0.4 0.5 0.6 0.7
0.4 0.6
CD0
Configuration in “+”
p0=94 kPa p0=110 kPa
Mach number
0.8 1
Figure 9. CD at zero angle of attack for “+” coniguration with
ins at zero degree for stagnation pressures at 94 and 110 kPa.
-6 -4 -2 0
Angle of attack
M = 0.80 configuration in “+”
D
ra
g
co
e
ff
ici
e
n
t
(
CD
)
2
p0=94kPa p0=70kPa p0=110kPa 0.45
0.40 0.50 0.55 0.60
6 4
Figure 10. CD for Mach number 0.80, for coniguration in “+”,
and with ins at zero degree for stagnation pressures of 70, 94, and 110 kPa.
Figure 11 shows a typical result of the variation of the
CL with respect to the angle of attack for Mach number
0.5, with stagnation pressure of 94 kPa, ins at 0 degree of delection and coniguration in “+”. The sequence followed in positioning the angle of attack was 0º, 1º, 2º, 3º, 4º, 5º, 4º, 3º, 2º, 1º, 0º, -1º, -2º, -3º, -4º, -5º, -4º, -3º, -2º, -1º and 0º. It is interesting to repeat some angle positions in order to check the repeatability of the tests. The curve shows a likeness to the theoretical prediction (polynomial of third degree) with a hysteresis effect almost nonexistent. In general, the curves for other test conditions showed similar trend.
Figure 12 shows a comparison of typical curves of CL, for coniguration in “+”, ins at 0 degree and
an irregular plane. But, considering the value of 0.06, it is possible to associate the same effect to the normal direction. In this way, a corresponding angle of attack of 0.1 degree causes an increase of about 0.06 in CL. A misalignment of 0.1 degrees represents a total of 0.7 mm linear misalignment between the extremities of the model, which could not be observed by the available alignment device. In Fig. 14 the hysteresis effect is practically undetectable. The same behavior was observed for all other low conditions.
angle of attack (degree)
-6 -5 -4 -3 -2 -1 0
-0.15 -0.10 -0.05 0.00 0.05 0.10 0.15
1 2 3 4 5 6
CY
Figure 14. CY in the “+” coniguration, ins at zero degree of
delection, and stagnation pressure of 94 kPa.
Figure 15 shows the average CYs and their standard deviation for all 80 test runs. From run 1 to 24, the model was in configuration in “+” and from 25 to 48 in “x”. No significant variation of CY was observed, indicating that the model’s axisymmetric feature was observed. However, as already observed, the value reflects a misalignment of about 0.7 mm along the model’s body. From runs 49 to 80, the model underwent
angle of attack (degree)
-1.5 -1.0 -0.5
-6 -4 -2 0 2 4 6
0.0 0.5 1.0 1.5
configuration in “+” fins at 0 degree Mach number 0.5
CL
Figure 11. CL for coniguration in “+”, ins at 0 degree of
delection, Mach number 0.5, and stagnation pressure of 94 kPa.
angle of attack (degree)
-5 -3
M = 0.3 M = 0.4 M = 0.5 M = 0.6 M = 0.7 M = 0.8 M = 0.9 M = 1.0
1 1
-1.80 -1.30 -0.80 -0.30 0.20 0.70 1.20 1.70 CL
3 5
Figure 12. CL for coniguration in “+”, ins at 0 degree, and
stagnation pressure of 94 kPa.
perfectly through the origin, indicating a possible small misalignment of the model relative to the airlow, since the model is axisymmetric.
It is common to represent lift and drag in the same graphic, with a variation of the angle of attack. This graphic is called drag polar and, in Fig. 13, polar curves for all Mach numbers, for coniguration in “x”, ins angle at 0 degree and stagnation pressure of 94 kPa are represented. All curves related to low Mach number are practically coincident. For Mach number equals and greater than 0.8, there is a noticeable increase of CD.
Figure 14 shows the CY, for the “+” coniguration,
ins at zero degree of delection, stagnation pressure of 94 kPa, and for angle of attack sweep of: 0º, 1º, 2º, 3º, 4º, 5º, 4º, 3º, 2º, 1º, 0º, -1º, -2º, -3º, -4º, -5º, -4º, -3º, -2º, -1º and 0º. A zero value throughout the range was expected, however a CY of about 0.02 at -5º of angle of
attack up to 0.06 at +5º of attack can be observed. This indicates that the angle of attack mechanism travels in
CD CL
2.0
1.5
1.0
0.5
0.0
-0.5
0.2 0.3
M = 0.3 M = 0.4 M = 0.5 M = 0.6 M = 0.7 M = 0.8 M = 0.9 M = 1.0
0.4 0.5 0.6 0.7 0.8
-1.0
-1.5
-2.0
0 10
-0.3 -0.2 -0.1 0.0 0.1 0.2 0.3 0.4 0.5 0.6 0.7
0.8 Roll moment coefficient (CI)
Standard deviation of CI
20 30 40
runs
50 60 70 80
Figure 16. Average Cl and its standard deviation, for all 80 runs.
-6 -5 -4 -3 -2 -1 0
-0.5 configuration in “+”
angle of attack (degree) Mach number 0.8
Stagnation pressure 94 kPa
configuration in “x” -0.4 -0.3 -0.2 -0.1 0.0 0.1 0.2 0.3 0.4 0.5 Cn
1 2 3 4 5 6
Figure 17. Cl for the “+” and “x” conigurations.
Figure 17 shows a comparison of Cm for the “+” and “x” conigurations for Mach number 0.8 and stagnation pressure of 94 kPa. It is interesting to note that with the
0.12
0.10
0.08
0.06
0.04
0.02
0.00
0 10 20 30 40
runs
Side force coefficient (CY) Standard deviation of CY
50 60 70 80
Figure 15. Average CY and corresponding standard deviation for all 80 runs.
several modifications from “x” to “+” and it also had parts with different fin angles changed (Fig. 3b). For these runs, one can observe a little decrease in the average CY but an increase in the standard deviation. It is possible to conclude that the tunnel support had, in fact, a misalignment of about 0.1 degree, which means that repair actions must be carried out to achieve better results.
A similar investigation was performed for the Cl, as shown in Fig. 16. From runs 1 to 48 the model’s ins were at 0 degrees of delection, from 49 to 64 at 2.5 degrees of delection and from 65 to 80 at 5.0 degrees of delection, as can be clearly seen in the igure. The observed standard deviations were very small for all runs. However, for ins at 0 degrees the average value for some runs was very different from the expected zero value, related to low Mach number (0.3, 0.4 and 0.5), indicating that a more precise internal balance should be used for these low low conditions.
“+” coniguration, the curve presented a typical stable third-degree polynomial curve behavior with angle of attack variation, and crossing the origin of the graph. For the “x” coniguration the same third-degree polynomial curve behavior was present (rotated counterclockwise from “+” coniguration) and the curve does not pass through the origin. The inluence of the ins in the “x” coniguration is clear.
It is possible to determine an equation to be added to the values from coniguration “+” to obtain the values from coniguration “x”, given by Eq. 7.
Cn = -0.05 + 0.03Į (7)
where:
α is the angle of attack.
RESULTS FROM PRESSURE DISTRIBUTION
Tests at some Mach number conditions were performed to determine pressure distribution over the second stage model, using the PSP technique.
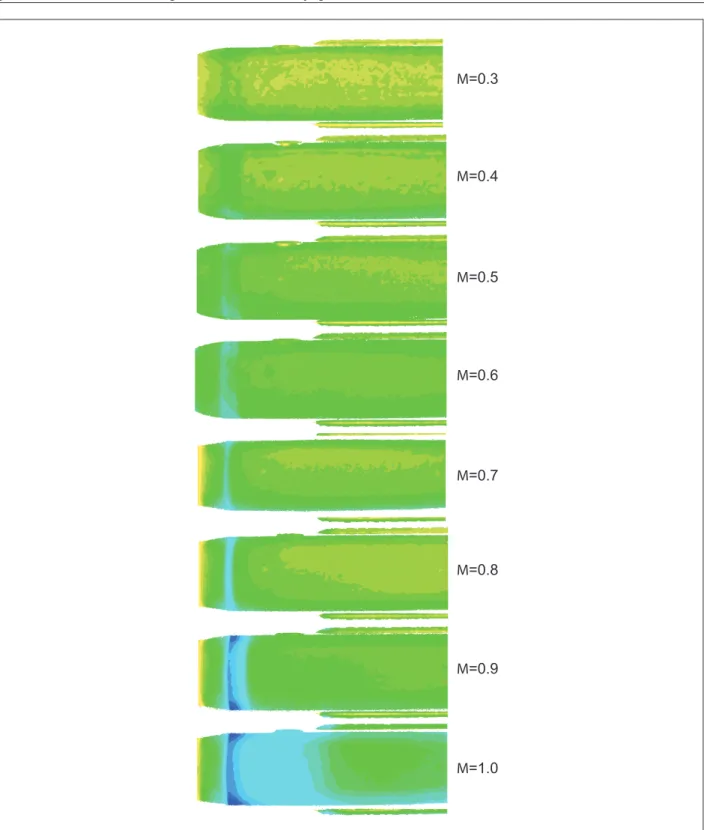
to Mach number 1.0. One conventional pressure tap was drilled at the model fuselage, at 148 mm from the nose tip of the fuselage, which was connected to a pressure sensor. The pressure measured by the sensor was 0.230 kPa higher than the value obtained by the PSP technique, representing a very low relative error of 0.5%.
Figure 19 shows the same region for all Mach numbers in the range from 0.3 to 1.0. It is interesting to observe that the expansion region grows when the Mach number increases. For free stream Mach number of 0.8, 0.9 and 1.0, the maximum local Mach number values found were 1.17, 1.45 and 1.55, respectively.
Figure 20 shows an image of inter-stages regions of the complete model at Mach number 0.7 and angle of attack of zero degree. Two plateaus of pressure values were observed on the fuselage. One at the second stage (pressure about 73.0 kPa), and the other at the first stage (pressure about 71.0 kPa). The plateau in the second stage has a value that is a little higher and grows with the proximity of the inter-stage cone. This can be explained by the cone influence at subsonic Mach number and by the presence of fins. The pressure at the inter-stage cone was greater, as expected, approximately 19%, and the Mach number decreased to 0.46. In the expansion region, the sudden pressure decrease indicates a local Mach number of
about 0.93 (indicated by the narrow dark blue color vertical strip in Fig. 20).
CONCLUSIONS
The main activities related to the irst test campaign of the sounding vehicle Sonda III from IAE held in TTP were described. The main tunnel characteristics and model conigurations were described, as well as the internal balance used. The preliminary tasks undertaken to the tunnel installation were presented, and important developments were described in more details. They are as follows:
a) The pressure probe to assess the low quality in the test section, showing the longitudinal Mach number distribution for the whole Mach number range; and
b) The implementation of automatic control for the re-entry laps that optimizes the tunnel testing procedures, along with a description of the main features of the design in which a programmable microcircuit is used.
Important results of global aerodynamic loads and pressure distribution over the model surface were presented. Since completely accurate procedures of testing corrections for the tunnel were not yet developed, optimum expected conditions were applied to the tunnel controls and good
Figure 18. Image obtained with PSP technique showing pressure distribution over the model front region surface, at Mach number 1.0
and angle of attack of 0 degree.
0 100
200 300 400 500 600 700 800 900 1000 1100
1200 Field Pressure 60000
55000 50000 45000 40000
35000 30000 25000
20000
0 500 1000 1500
200 400 600 800 1000 1200 1400 1600
M=0.3
M=0.4
M=0.5
M=0.6
M=0.7
M=0.8
M=0.9
M=1.0
Figure 19. Images obtained with PSP technique showing pressure distribution over the model front region surface, at Mach number
from 0.3 to 1.0 and angle of attack at 0 degree.
results are envisaged using a model in scale 1/20, with a 0.8% of blockage area ratio.
Global load coeficients were determined for Mach number range from 0.3 to 1.0 and stagnation pressure of 70, 94 and 110 kPa, for a complete version of the model, with
conigurations of ins at 0º, 2.5º and 5.0º of delection, and varying the angle of attack from -5º to +5º. The curve of
to verify the alignment conditions in the test section. A misalignment of about 0.1 degree was found, which did not compromise the accuracy for the whole campaign, but this fact will be investigated in more details in the future. No appreciable impact was observed with stagnation pressure (Reynolds number) variation. A noticeable change could be seen in the curve of Cm when the model was changed from the “+” to the “x” conigurations, due to the aerodynamic inluence of the ins.
PSP was used to determine the pressure distribution over essential regions of the model, such as the ogive, inter-stage sector, and ins. The Mach number for expansion regions that is an important feature in wind tunnel testing was determined.
A very important step was taken with the conclusion of the present test campaign, enabling the technical team of TTP to proceed with aerodynamic testing in transonic range for models of real interest for the Brazilian aerospace industry.
ACKNOWLEDGMENTS
The authors are thankful to the AEB for the inancial support of project 44 0000 “Realização de Ensaios do
VS-30 no Túnel Transônico Piloto do IAE”, and to CNPq under grants 103520/2007-4, 101945/2007-8, 103518/2007-0, 101945/2007-8, 100656/2009-9, 103551/2008-5, 113853/2007-6, 104775/2008-4, 119235/2009-9, 119242/2009-5, 102506/2010-8, 106254/2008-1.
REFERENCES
Anderson, J. D. Jr., 2001, “Fundamentals of Aerodynamics”, McGraw-Hill Higher Education, 3rd Edition, New York.
Costa, R. S., Avelar, A. C., Falcão Filho, J. B. P., 2010, “Pressure Measurements Over a NACA 0012 Proile in a Transonic Wind Tunnel Using Pressure Sensitive Paint (PSP)”, Proceedings from 13rd Brazilian Congress of Thermal Sciences and Engineering, Uberlândia, Minas Gerais, Brasil.
Davis, M. W., Gunn, J. A., Herron, R. D., Kraft, E. M., 1986, “Optimum transonic wind tunnel,” AIAA 14th Aerodynamic Testing Conference, 14, West Palm Beach, AIAA-86-0756-CP.
Falcão Filho, J. B. P., Mello, O. A. F., 2002, “Descrição Técnica do Túnel Transônico Piloto do Centro Técnico Aeroespacial,” Anais ... IX Congresso Brasileiro de Ciências Térmicas e Engenharia, ENCIT-2002, Caxambu-MG, artigo CIT02-0251.
Falcão Filho, J. B. P., Avelar, A. C., Reis, M. L. C. C., 2009, “Historical Review and Future Perspectives for the PTT – IAE Pilot Transonic Wind Tunnel,” Journal of Aerospace and Technology and Management, ISSN 1984-9648,Vol. 1, No. 1.
Falcão Filho, J. B. P., Ubertini, G. P. A., 2011, “Pressure Probe Development and Tests in a Transonic Wind
Figure 20. Image obtained with PSP technique showing pressure distribution over inter-stage region of the model at Mach number 0.7
and stagnation pressure of 94 kPa, and angle of attack zero degree.
0 100
0 200 300 400 500 600
0 45000 50000 55000 60000 65000 70000 75000 80000 85000
500 1000 1500
200 400 600 800 1000 1200 1400 1600
Tunnel Calibration,” proceedings from 21st Brazilian Congress of Mechanical Engineering, Natal, RN, Brazil (accepted for publication).
Falcão Filho, J. B. P., Souza, F. M., Oliveira Neto, P. J., Rocha, A., Lima, D. S. A., 2011, “Automatic Control of Flaps in a Transonic Wind Tunnel Installation,” proceedings from 21st Brazilian Congress of Mechanical Engineering, Natal, RN, Brazil (accept for publication).
Goethert, B. H., 1961, “Transonic Wind Tunnel Testing”, Pergamon Press, New York.
Goffert, B., Tagawa, G. B. S., Zanin, R. B., Reis, M. L. C. C., Falcão Filho, J. B. P., 2008a, “Ensaio de Calibração de Turbina de Inserção do Sistema de Extração Forçada de Massa do Túnel Transônico Piloto do IAE”, Anais ... V Congresso Nacional de Engenharia Mecânica, CONEM-2008, Salvador-Bahia, artigo 0941.
Goffert, B., Truyts, C. F., Lima, D. S. A, Falcão Filho, J. B. P., 2008b, “Control of Injection System for the Pilot Transonic Wind Tunnel of IAE in Closed Circuit”, Proceedings ... XII Brazilian Congress of Thermal Engineering and Sciences, ENCIT-2008, Belo Horizonte-MG, article 1-5054.
Goffert, B., Falcão Filho, J. B. P., 2008, “Determinação do Coeiciente Politrópico Associado aos Reservatórios de Ar Comprimido do Túnel Transônico Piloto do IAE”, Anais ... V Congresso Nacional de Engenharia Mecânica, CONEM-2008, Salvador-Bahia, artigo 1029.
Goffert, B., Falcão Filho, J. B. P., 2009, “Euler Equations Applied to Flow Over NACA 0012”. In: International Congress of Mechanical Engineering, 2009, Porto Alegre - RS. Anais do COBEM 2009 - COB09-1136, 2009.
Goffert, B., Vargas, M. M., Falcão Filho, J. B. P., 2010, “Veriication and Validation of Laminar Navier-Stokes Applications,” Proceedings from 13rd Brazilian Congress of Thermal Sciences and Engineering, Dec. 05-10, Uberlândia, Minas Gerais, Brasil.
Goffert, B., Ubertini, G. P. A., Falcão Filho, J. B. P., 2011, “Design of a Supersonic First-Throat for a Transonic Wind Tunnel and Numerical Evaluation,” proceedings from 21st Brazilian Congress of Mechanical Engineering, Natal, RN, Brazil (accept for publication).
Pope, A., Goin, K. L., 1978, “High-Speed Wind Tunnel Testing”, John Wiley & Sons, New York.
PSI, 2000, “ESP-16BP Pressure Scanner User’s Manual,” Catálogo de produto da irma Esterline Pressure Systems, 3rd Edition, Retrieved in June 10th, 2011, from www.pressuresystems.com.
Reis, M. L., Castro, R. M., Falcão Filho, J. B. P., Mello, O. A. F., 2008, “Calibration Uncertainty Estimation for Internal Aerodynamic Balance”, Proceedings ... 12th IMEKO TC1-TC7 joint Symposium on Man, Science & Measurement, Annecy, France.
Reis, M. L. C. C., Falcão Filho, J. B. P., Paulino, G., Truyts, C., 2009 “Aerodynamic Loads Measurement of a Souding Rocket Vehicle Tested in Wind Tunnel,” XIX IMEKO World Congress, Fundamental and Applied Metrology, September 6/11, 2009, Lisbon, Portugal.
Reis, M. L. C. C., Falcão Filho, J. B. P., Mello, O. A., 2010, “Wind Tunnel Tests of the Sonda III Aerospace Vehicle,” Anais do VI Congresso Nacional Engenharia Mecânica, 18 a 21 de agosto, Campina Grande, Paraíba, Brasil.
Schiavo, L. A. C. A., Reis, M. L. C. C., Falcão Filho, J. B. P., Truyts, C. F., 2011, “Aerodynamic Tests of the AGARD Model B in a Transonic Wind Tunnel,” proceedings from 21st Brazilian Congress of Mechanical Engineering, Natal, RN, Brazil (submitted).
Silva, A. F. C., Braz, R. O., Avelar, A. C. B. J., Falcão Filho, J. B. P., 2009, “Study of the Mach Number Uniformity Over a Horizontal Plane Inside the Test Section of a Wind Tunnel,” In: International Congress of Mechanical Engineering, 2009, Porto Alegre - RS. Anais do COBEM 2009 - COB09-1053.
Silva, A. F. C., Ortega, M. A., Falcão Filho, J. B. P., 2010, “Diffuser Design for a Supersonic/Subsonic Mixing Chamber,” Proceedings from 13rd Brazilian Congress of Thermal Sciences and Engineering, Dec. 05-10, Uberlândia, Minas Gerais, Brasil.
Silva, A. F. C., Godinho, M. B. C., Ortega, M. A., Falcão Filho, J. B. P., 2011, “Supersonic/Subsonic Mixing Chamber Experimental Analysis,” proceedings from 21st Brazilian Congress of Mechanical Engineering, Natal, RN, Brazil (accepted for publication).
Souza, F. M., Falcão Filho, J. B. P., De Oliveira Neto, P. J., 2009, “First Throat Design of a Transonic Wind Tunnel,” In: International Congress of Mechanical Engineering, 2009, Porto Alegre - RS. Anais do COBEM 2009 - COB09-1142.
“Metodologia de Calibração de Sistema de Medida de Pressão em Túneis de Vento,” Anais do VI Congresso Nacional de Engenharia Mecânica, 18 a 21 de agosto, Campina Grande, Paraíba, Brasil.
Tagawa, G. B. S., Reis, M. L. C. C., Falcão Filho, J. B. P., 2008, “Ajuste de Curva de Calibração de uma Balança Interna Multi-Componente”, Anais ... V Congresso Nacional de Engenharia Mecânica, CONEM-2008, Salvador-Bahia, artigo 1124.
Vargas, M. M., Falcão Filho, J. B. P., 2010, “Análise Numérica Bidimensional do Escoamento em Modelo de Veículo de Sondagem,” Anais do VI Congresso Nacional
de Engenharia Mecânica, 18 a 21 de agosto, Campina Grande, Paraíba, Brasil.
Zanin, R. B., Reis, M. L. C. C., Falcão Filho, J. B. P., 2008a, “Análise da Uniformidade Longitudinal do Número de Mach na Seção de Testes do Túnel Transônico Piloto do IAE em Circuito Aberto”, Anais ... V Congresso Nacional de Engenharia Mecânica, CONEM-2008, Salvador-Bahia, artigo 1031.